


12 Hidden Gold Signals You Should Track (That Most Traders Ignore) - PART I

Most traders obsess over the Fed, the dollar, and bond yields.
But they’re also widely watched, heavily priced in, and often reactive, not predictive.
If you want to trade Gold with real precision, you need to see what others don’t.
The real edge?
It lies in cross-asset flows, relative value plays, and macro signals that move Gold before the headlines catch up.
In this value-packed deep dive, I’ll walk you through 12 hidden Gold signals that institutional money watches and that consistently lead price — often by days or weeks.
This is Part 1, covering the first 6 signals — each one broken down by:
✅ What it is / measures
✅ Why it works
✅ How to read it and interpret signals
✅ Common trader mistakes to avoid
Part 2 coming soon.
By the end of this series, you’ll know how to combine these into a powerful dashboard — giving you real clarity in volatile markets.

Signal #1: The “Gold Spotter” - Tracking Cross-FX Flows (Proprietary) 📈
💡 What it is:
Fuses FX flow data with Gold momentum, rescaled into a 0–100 oscillator.
Think of it as a smarter MACD — but instead of using Gold price, it detects early moves in global capital flow.

🟢 Why it works:
Institutional capital flows leave footprints. For example, when big funds rotate out of emerging markets, like ZAR or MXN, that’s a sign of risk-aversion – money seeking safety.
Often, Gold benefits as the next step in that chain (a safe-haven bid), but by the time Gold moves, these FX shifts have been underway.
Gold Spotter sees the move before Gold reacts, capturing that capital flow shift in real-time.
🔑 How to read it:
✅ Trend confirmation: Both green & red lines rising = bullish. Both falling = bearish.
✅ Divergences: If Gold price drops but Gold Spotter rises = bullish divergence (bottom forming).
✅ Crossovers: Green line crossing above red = bullish signal (risk-off flows rising). Crossing below = caution.


❌ Typical mistakes:
Don’t treat Gold Spotter only like RSI. “Overbought/oversold” levels matter, but it’s mostly about momentum direction and flow confirmation.
Always use in context with support/resistance and other confluences.
Don’t expect an instant change in price action. Gold Spotter works best on the daily chart for swing trades and gives a 3–5 day lead ahead of major turns.
📚 Use cases:
Signal #2: GLD ETF Flows - The Smart Money Thermometer
💡 What it is:
Measure the net inflows/outflows into SPDR Gold Shares (GLD) — the world’s largest Gold-backed ETF.
Since GLD physically backs shares with Gold, money moving in/out has a real impact on demand. Large spikes in flows often signal inflection points in market sentiment — whether panic buying or stealth accumulation.

🟢 Why it works:
GLD flows reveal what price action can’t: who’s behind the move.
Institutional players often accumulate through ETFs like GLD
Massive inflows usually coincide with fear-driven Gold spikes
Extreme inflows often mark tops
Persistent outflows tend to align with bottoms or disinterest
Recent example:
In Q1 2025, GLD pulled in nearly $6B in inflows
Feb: $3.8B, Mar: $2.9B — some of the largest monthly inflows in GLD’s history
Historically, such extremes often align with major sentiment turning points.
🔑 How to read it:
Add weekly/monthly GLD flows to your Gold dashboard (from ETF.com, World Gold Council, Bloomberg)
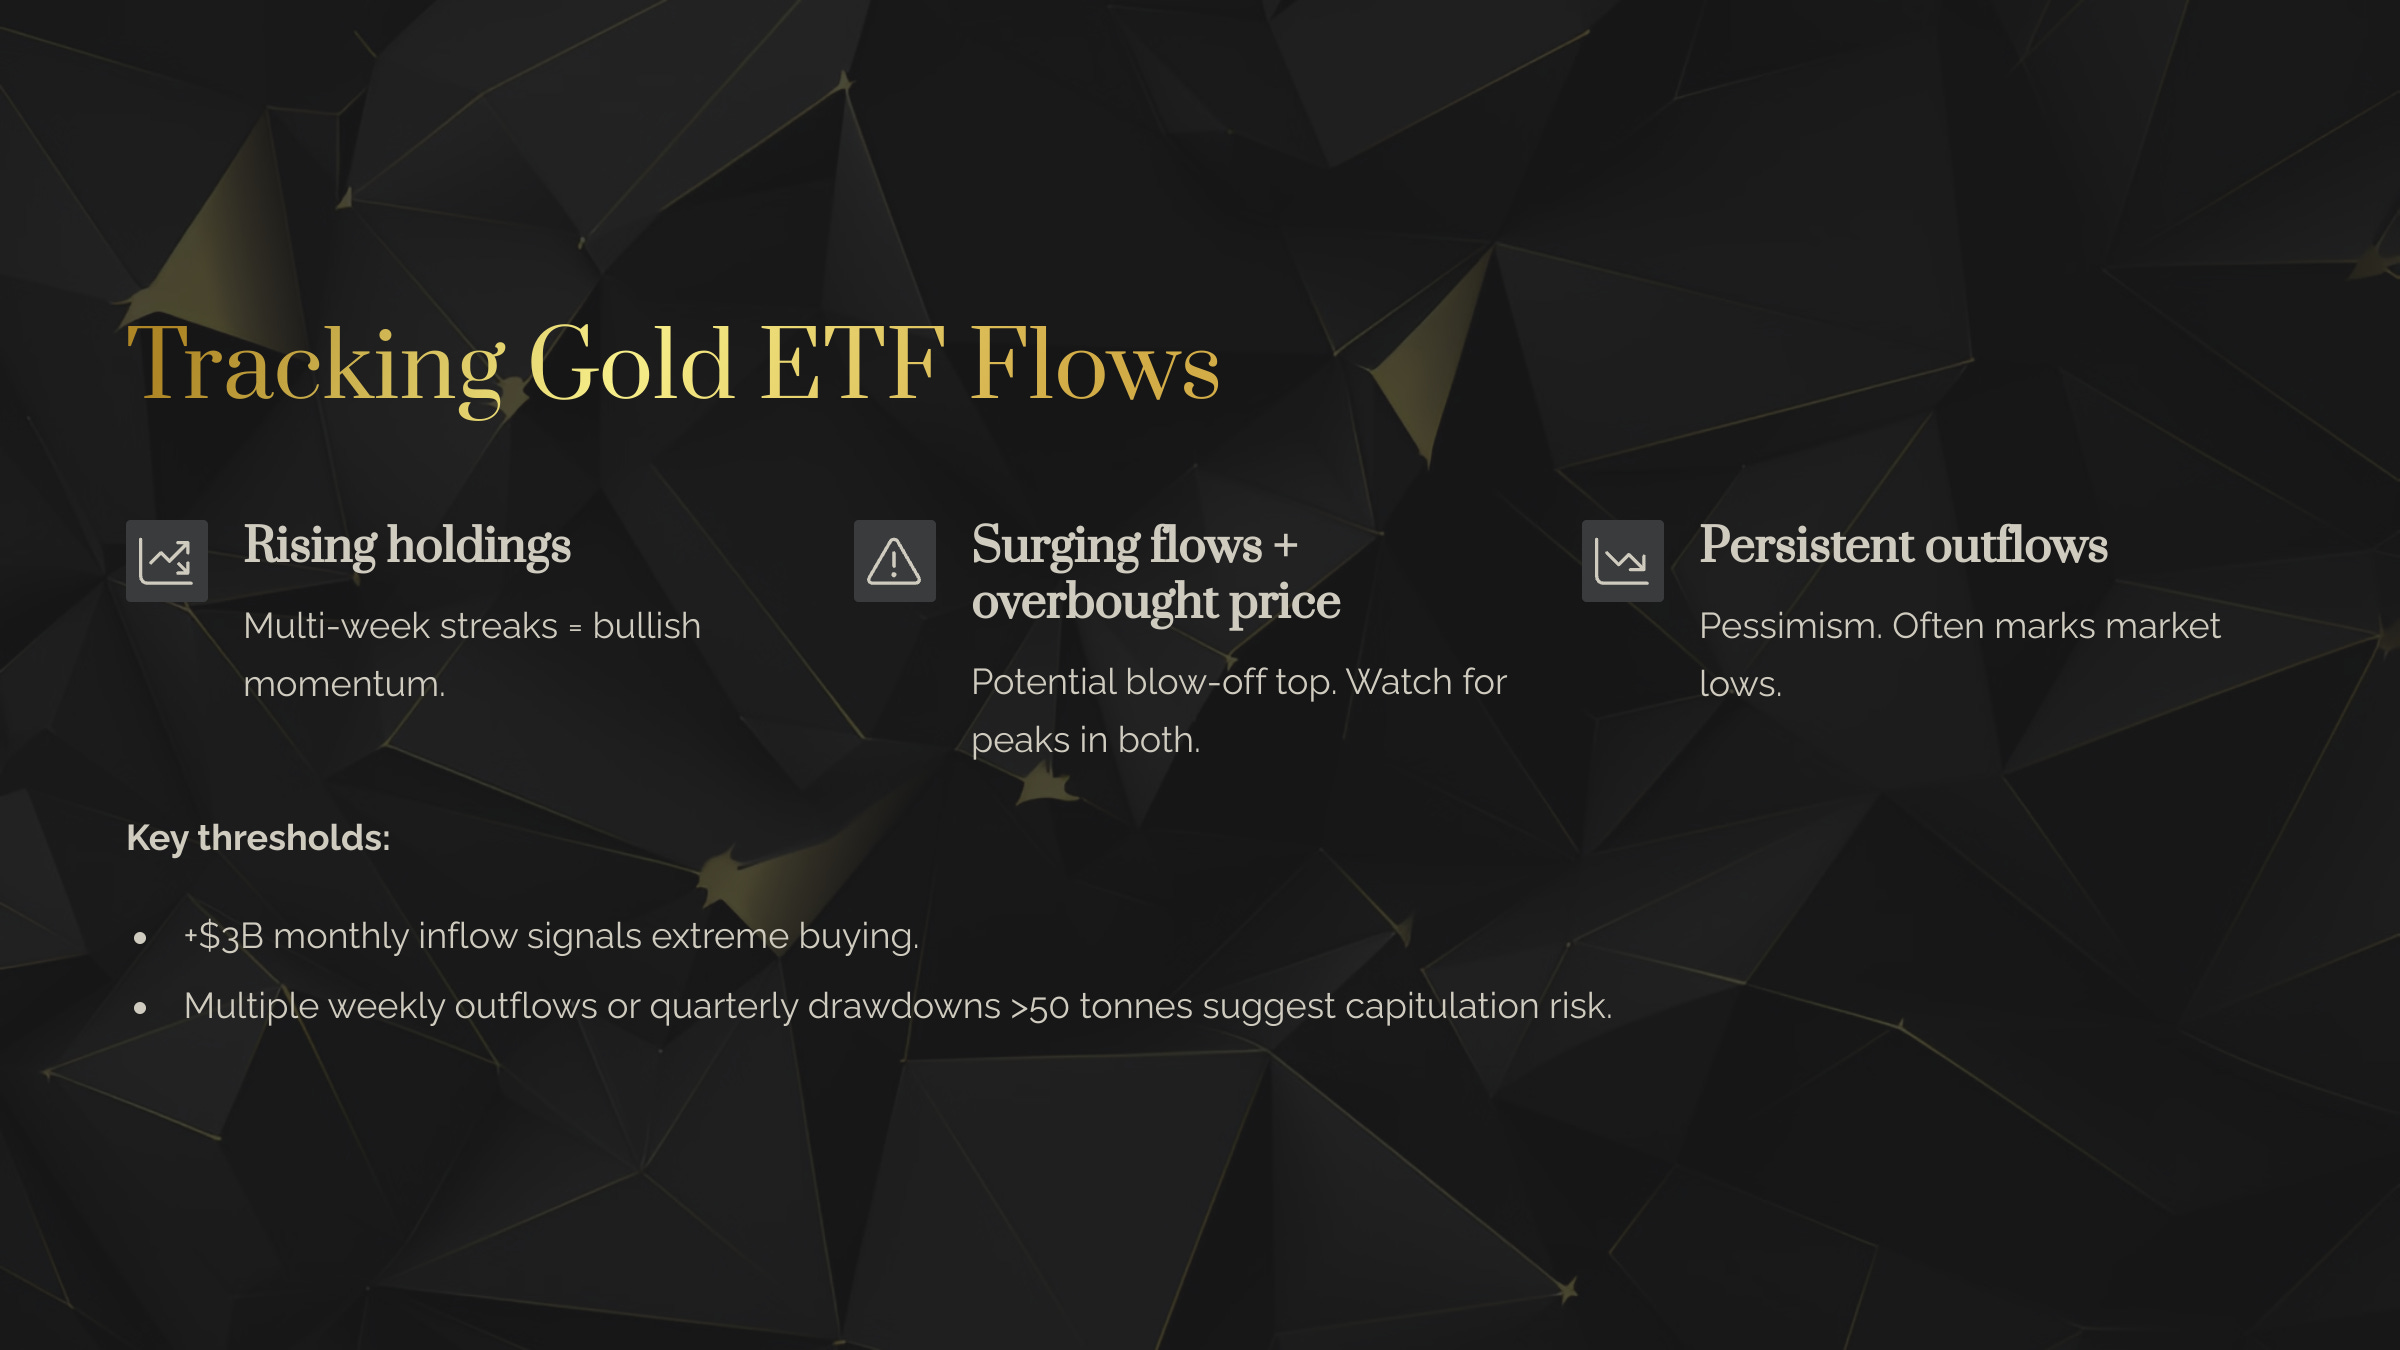
Rising holdings (especially multi-week streaks) → confirmation of bullish move
Surging flows + overbought price = caution → potential blow-off top. A classic pattern: GLD holdings surge to new highs while Gold price also peaks – that “everyone piling in” moment often precedes a pullback.
Persistent outflows → signal of pessimism or apathy → often seen near market lows.
Thresholds to watch:
+$3B monthly inflow = extreme → check technicals for exhaustion
Multiple weeks of outflows or quarterly drawdowns >50 tonnes = capitulation risk.
❌ Typical mistakes:
Ignoring ETF flows entirely → price alone doesn’t tell the full story. Why the price is moving (new buyers vs. short covering) matters.
Misreading institutional flows as retail
→ Not all inflows are sticky. Large players might enter GLD for tactical reasons → a big inflow might be short-term and reverse.Not reconciling flow + price action
→ Big inflows without price follow-through? Something’s off → could mean a looming reversal once that support fades.
📚 Use cases:
✔️ Confirming:
Gold breaks resistance + GLD flows rising → institutions are chasing → ride trend
✔️ Contrarian:
Big GLD inflow + overbought RSI + news spike → tighten stops or fade blow-off
✔️ Advanced:
Compare GLD vs IAU flows
→ If both show outflows during a price rally, the move may be unsupported.
Signal #3:
Signals #3–#11 are are exclusive to premium subscribers — and for good reason. Each one unlocks a different dimension of the Gold market that most traders completely overlook.
🔒 Not subscribed yet? Upgrade now to unlock:
all 10 + Gold Signals
the most comprehensive Gold market deep dives on Substack and weekly Gold forecasts forecasts
real-time XAU/USD trades on Telegram.
Keep reading with a 7-day free trial
Subscribe to The Gold Trader to keep reading this post and get 7 days of free access to the full post archives.