


How I Swing Trade Gold with My TradingView Indicator: Overall Game Plan + Real Setup Example

Hello, fellow traders!
My custom Gold Spotter indicator is built to give Gold traders a heads-up—usually 3 to 5 days in advance—on where Gold prices might be heading.
It’s perfect for swing trading XAU/USD, especially if you’re looking for clear, actionable signals.
Today, I’ll walk you through how I personally use this indicator to swing trade Gold, focusing on a long-only strategy (I’m skipping the deep dive into how the lines are generated or how to interpret them - we’ve covered that here).
I’ll show you exactly:
how I find solid setups
the key conditions I look for before taking action.

A quick note before we dive in:
You’ll need a free TradingView account to access the indicator.
But if you’re serious about trading, upgrading to a premium version is worth it. It unlocks advanced tools like auto chart patterns, volume footprints, and the ability to trade on multiple charts simultaneously.
Trust me, the premium version pays for itself in no time and you can get one now at 60% off.

The Overall Game Plan
When swing trading, my goal is to hold positions for a few days to a few weeks.
I’m focused on capturing the bigger moves in the market rather than chasing intraday volatility.
The Gold Spotter indicator has a slight leading edge—usually 3 to 5 days—which makes it perfect for spotting momentum shifts early enough to catch a good chunk of the swing.
Key takeaways:
I only go long: My focus is on entering during pullbacks in an uptrend or when the indicator signals a fresh wave of buying momentum.
I use the daily timeframe: This gives me the bigger-picture signal to guide my trades. But I might zoom in to a 4-h chart for entry.
I combine it with price action or support levels on the chart to refine entries.
My Checklist for Going Long
✅ Confirm overall trend on a daily chart
Is price making higher highs and higher lows recently? If yes, it’s likely an uptrend.
If the price chart is all over the place with no clear direction, I’ll be extra cautious.
✅ Indicator lines behavior
Green & Red Rising → Bullish bias
Green & Red Falling → Bearish bias
Green Crossing Above Red → Bullish crossover
Green Crossing Below Red → Bearish crossover
Bullish Divergence: Gold makes a lower low, but the green line is making a higher low.
Bearish Divergence: Gold makes a higher high, but the green line makes a lower high. This hints the trend might not last.
✅ Wait for a short-term pullback/consolidation
Always keep in mind that the indicator is leading 3-5 days.
I often wait for a small correction or consolidation on the daily chart (1–3 days of sideways or mildly bearish price action), like a pullback to EMA20.
(Optional) I’ll sometimes check if volumes are drying up or if a momentum oscillator like RSI/MACD shows oversold conditions. This isn’t necessary but adds confidence.
✅ Confirmation for entry
To confirm it’s not a false signal, I want to see a bullish daily candle near a support or after a moderate pullback before entering the trade.
If needed, I’ll check the 4-hour chart to fine-tune the entry.
✅ Stop loss/Take profit
I usually set the stop loss just below the recent swing low.
For profit, I target a multi-day move. If Gold moves 250 points in my favor, I’ll take partial profits and let the rest ride with a trailing stop.
Example #1
Green line crosses above the red line (bullish crossover) - Screenshot 1.
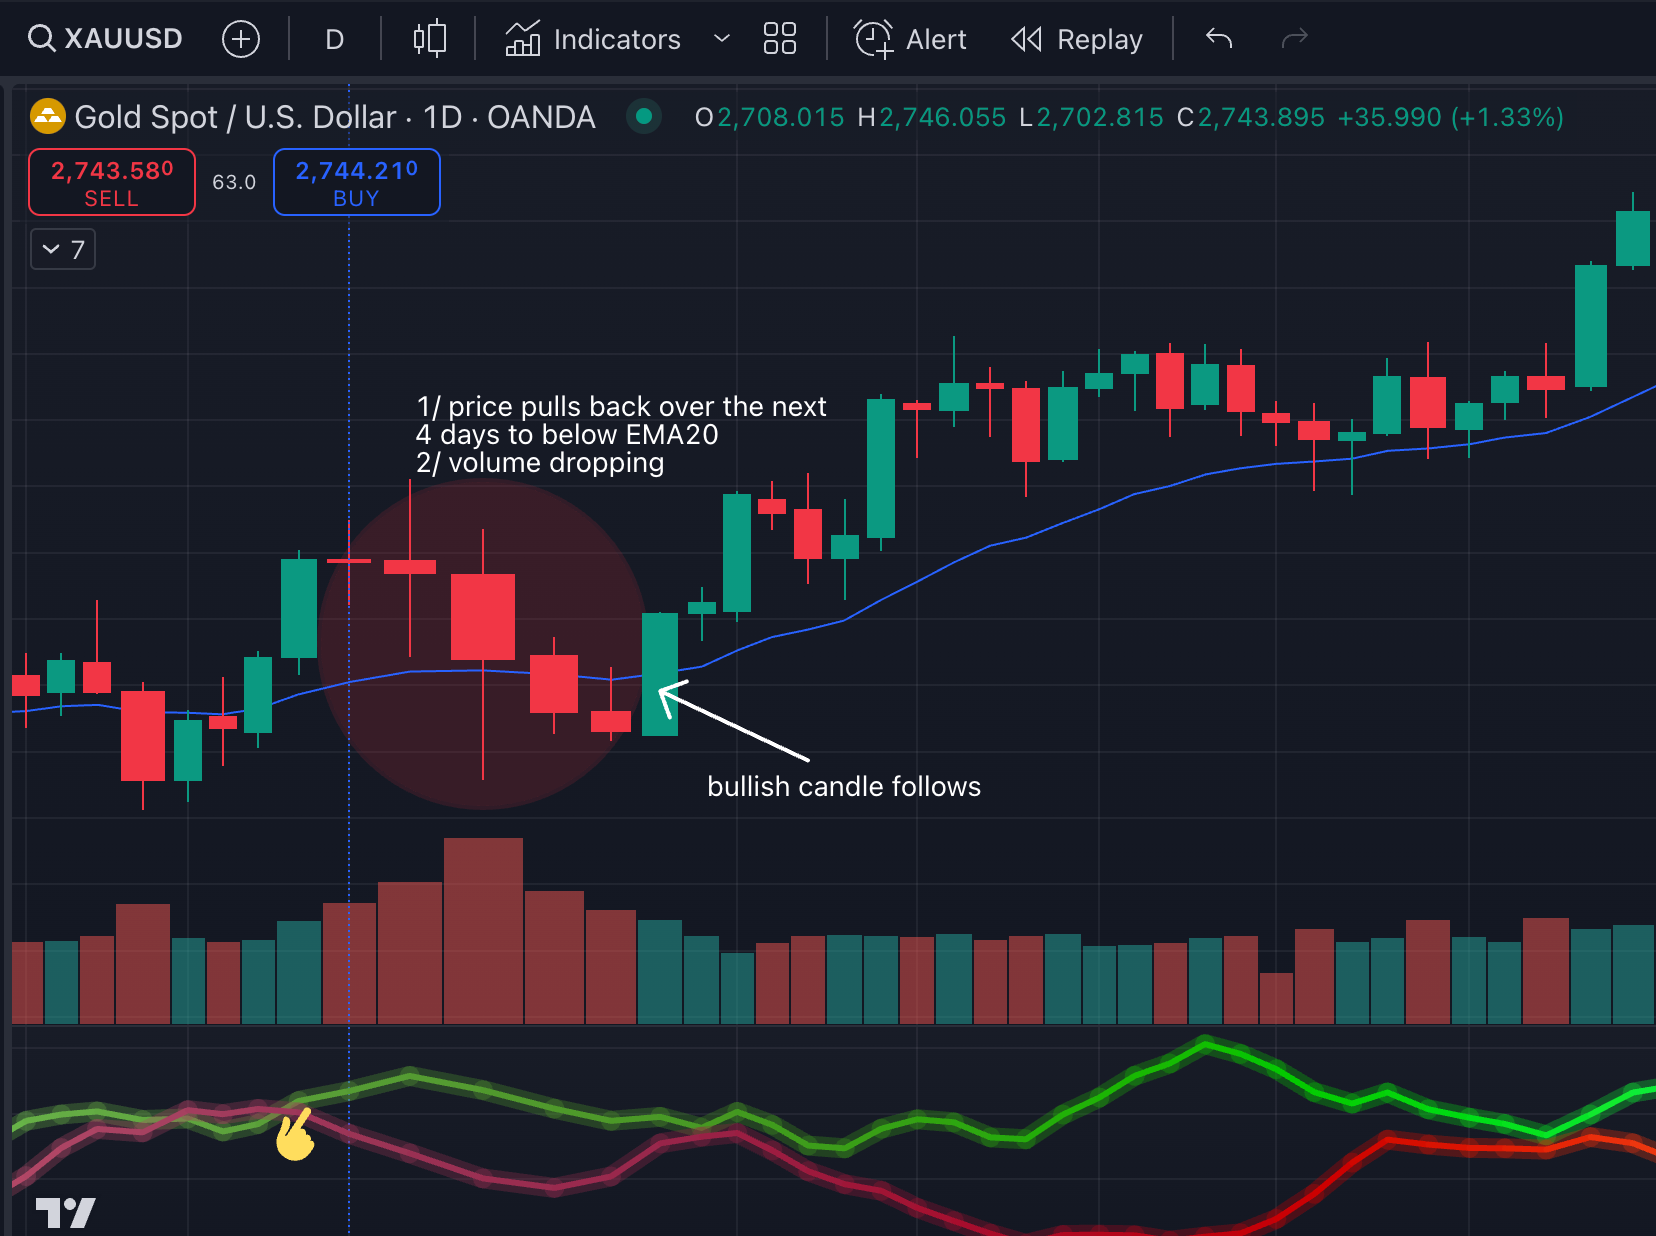
Price pulls back to a 20-day EMA. The volume eventually starts dropping - Screenshot 2.
I see a bullish daily candle - Screenshot 3.
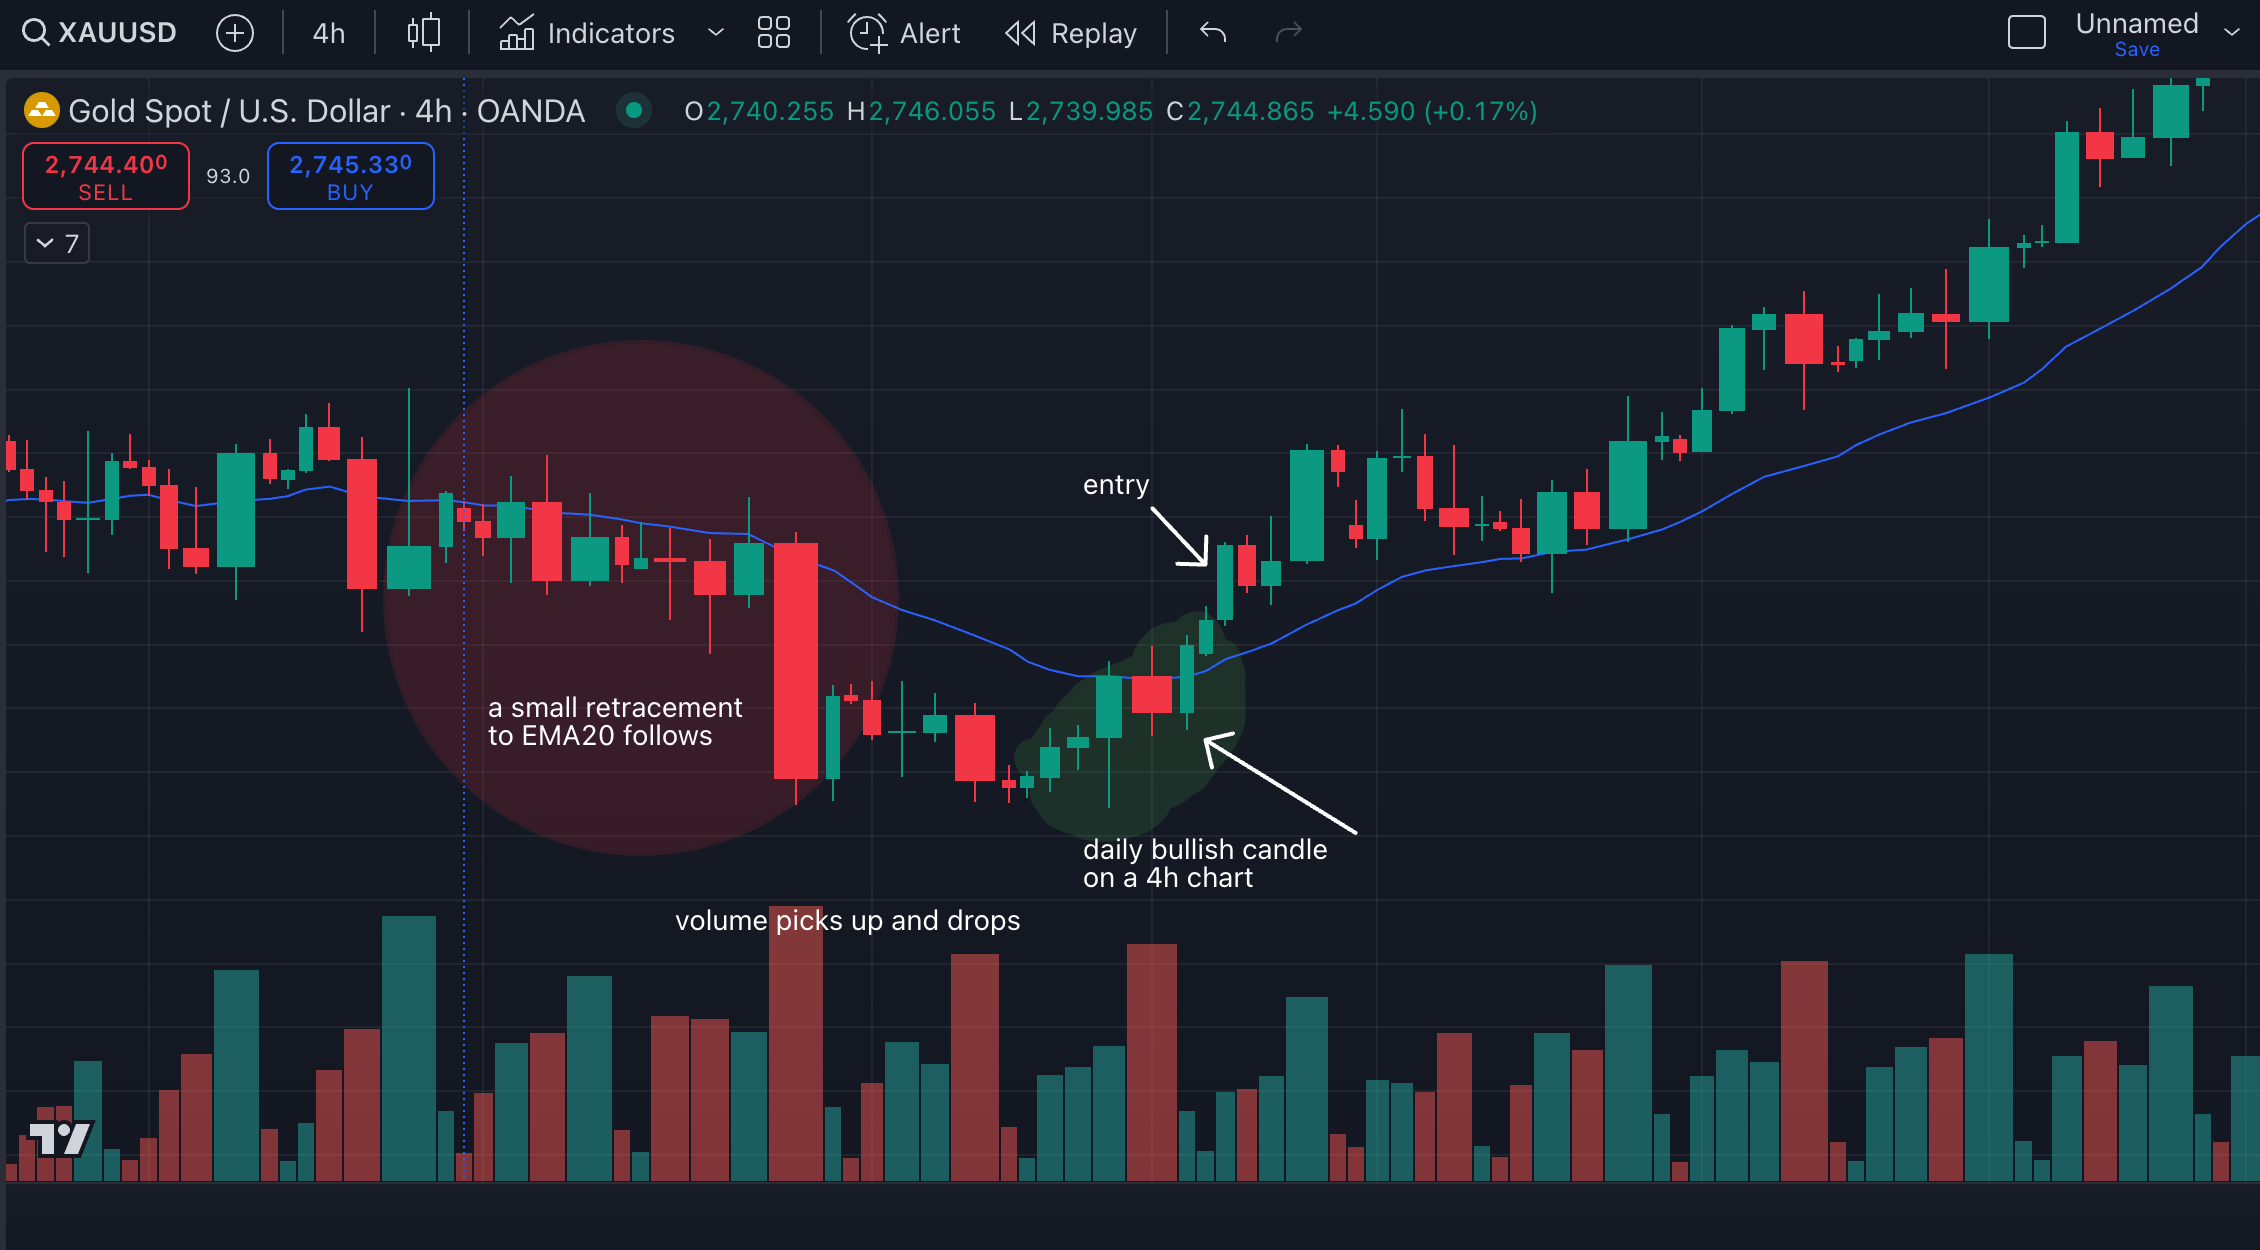
I switch to a smaller time-frame (4h chart) to fine tune entry. Place stop loss just below recent swing low - Screenshot 4.


Example #2
This setup is trickier because we initially see a bearish crossover. But over the next few days, the green line starts climbing along the red one, meaning the uptrend is on the horizon - - Screenshot 1.
Price pulls back to a 20-day EMA over the next 2 days. The volume eventually starts dropping - Screenshot 1.
A bullish daily candle forms - Screenshot 1.
I switch to a smaller time-frame (4h chart) to fine tune entry. Place stop loss just below recent swing low - Screenshot 2.

Final Thoughts
This approach has so far worked well for me.
The key is to combine:
the indicator’s lead-time
solid chart analysis
proper risk management.
No single tool is perfect, but if you use this method consistently, it can give you a real edge.
One of the toughest parts? Trusting the signal.
Since this is a leading indicator, the market might not react right away. You’ve got to be patient and let the trade develop—but don’t ignore obvious warning signs in the price action.
The goal is to give your setup a fair shot without putting too much of your capital at risk.
Safe trading,
and remember: All that glitters is not Gold,
Joe
p.s. This script is invite-only and exclusive to my paid subscribers. If you’re a paid subscriber, but hasn’t received access to the indicator, please respond to this email or write me a pm with your Trading View username.