
How Market Correlations Can Amplify Gold Signals: Pairing the Gold Spotter Indicator with DXY & Bond Yields

Hello, fellow traders!
A well-rounded Gold strategy doesn’t rely on any single dimension.
By layering my custom Gold Spotter indicator with the real-time movements of DXY and bond yields, you get a 3D view of the market.
You’re no longer shooting in the dark, but aligning multiple factors to produce higher-probability trades.
Let’s explore how the Gold Spotter Indicator can fit into your intermarket analysis and see how it works in practice (with real examples).


Recap: Gold’s Key Correlations
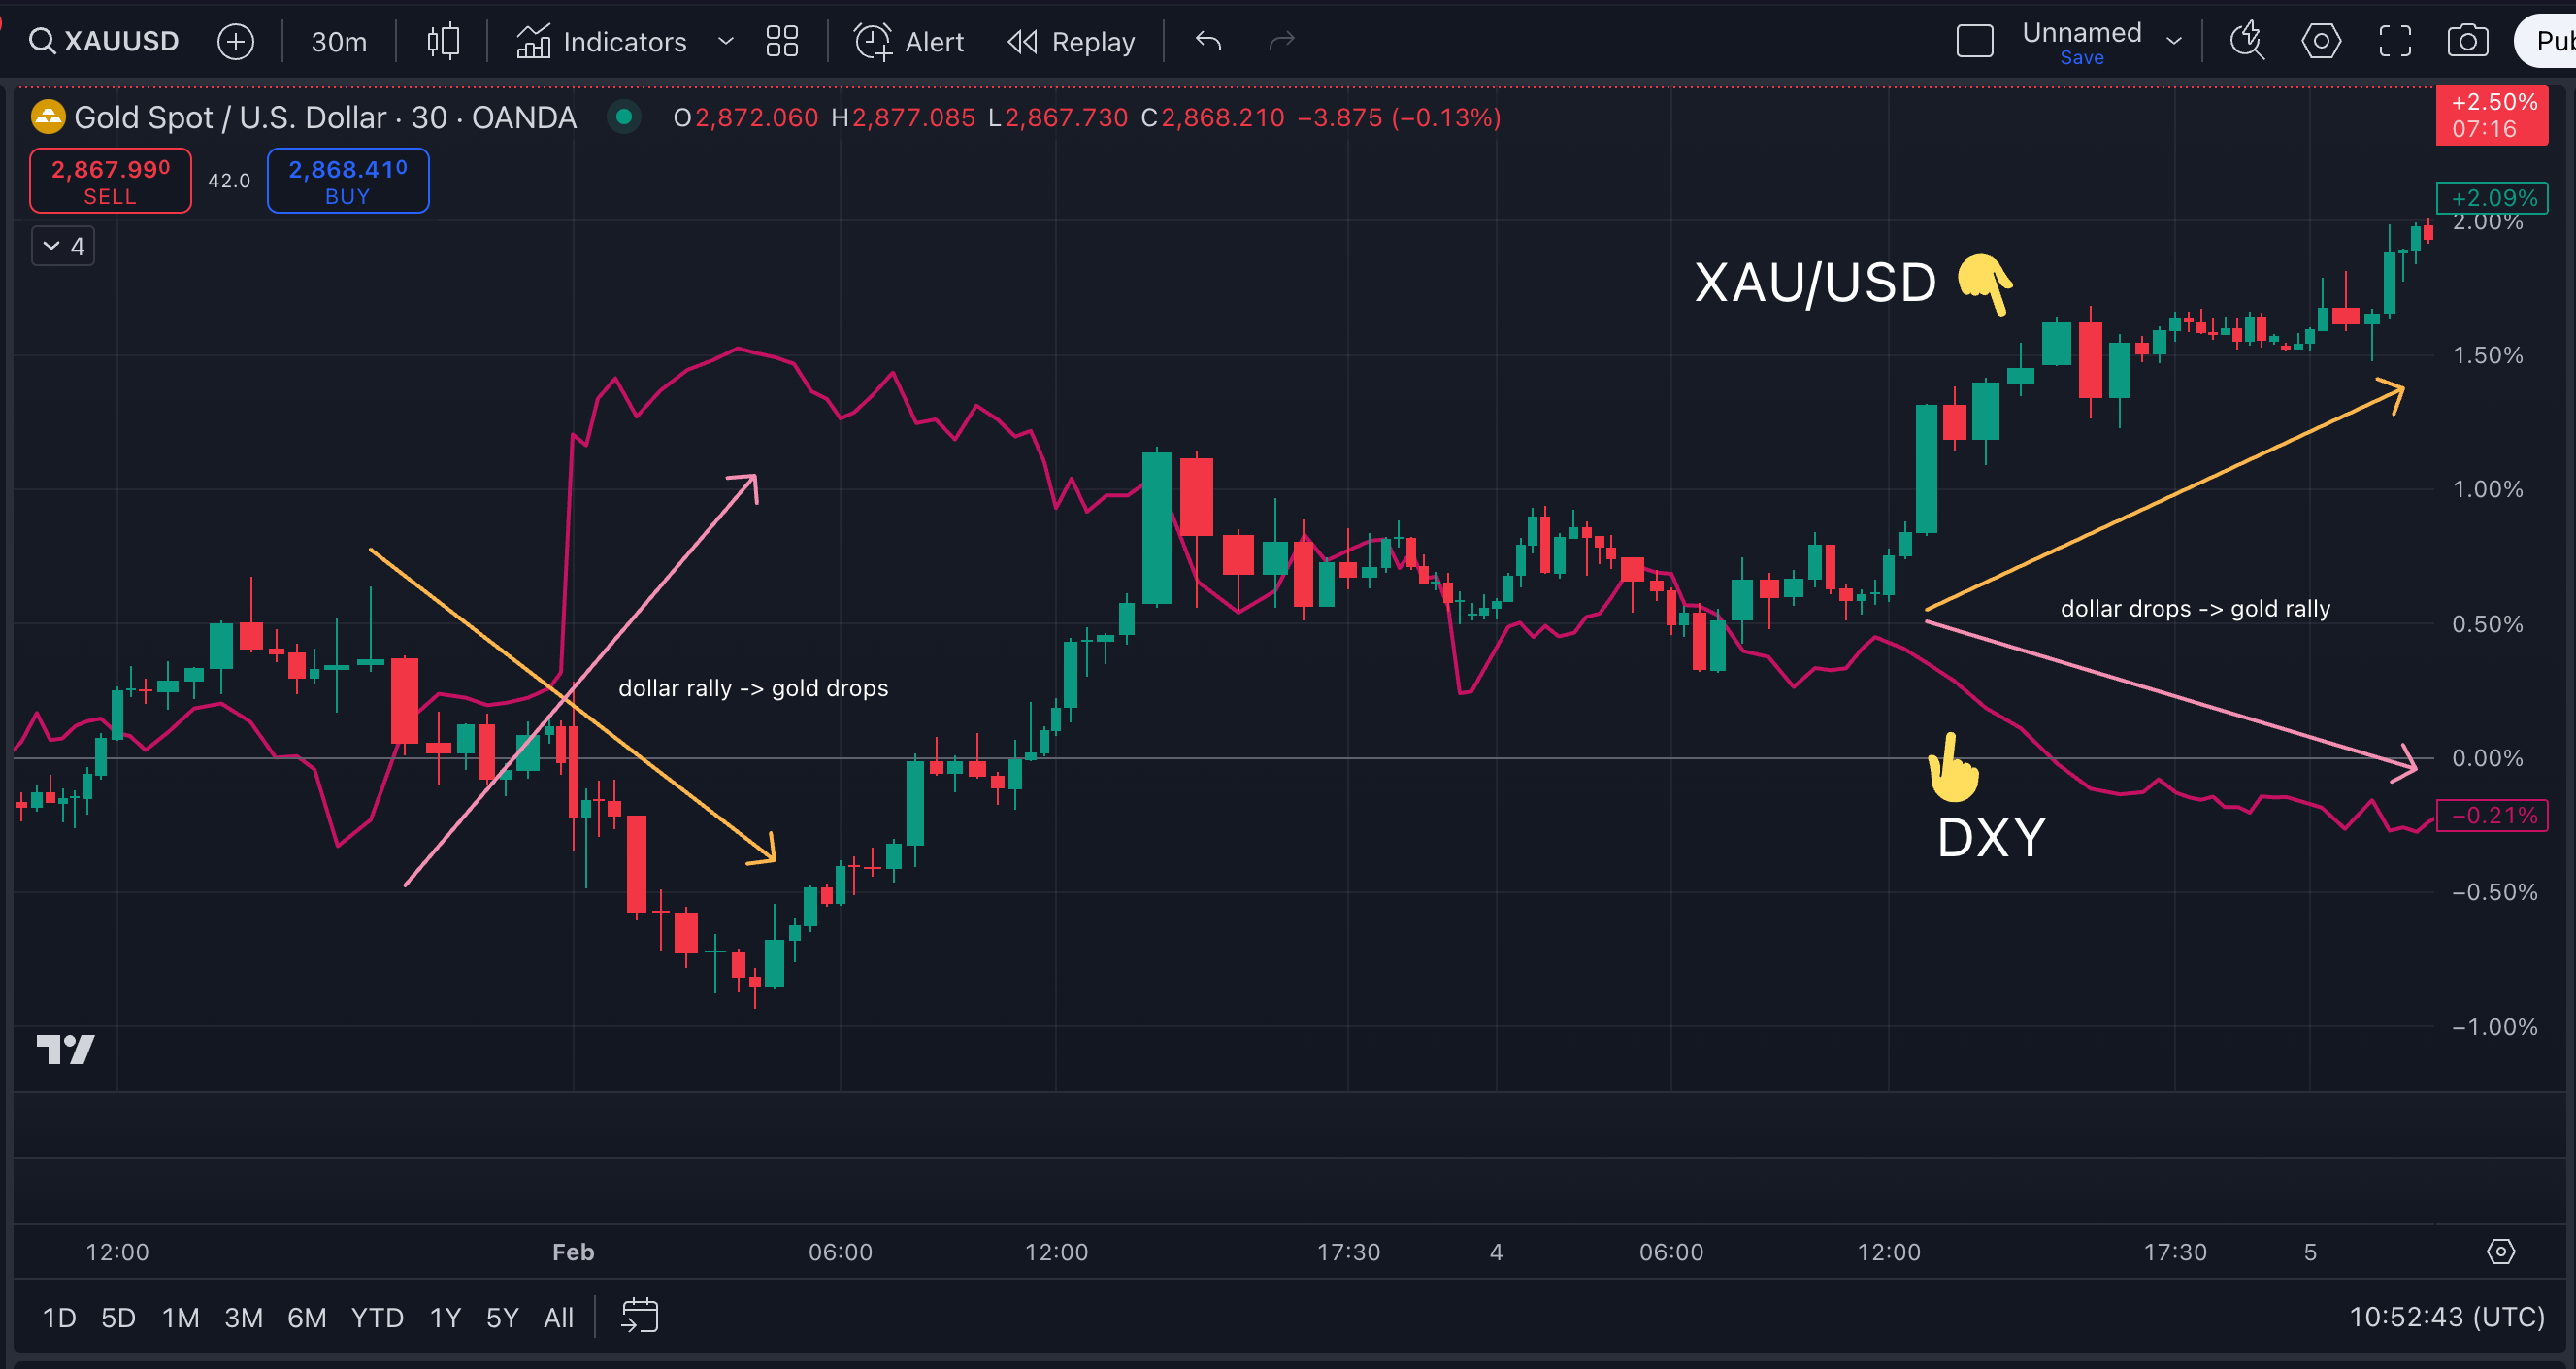
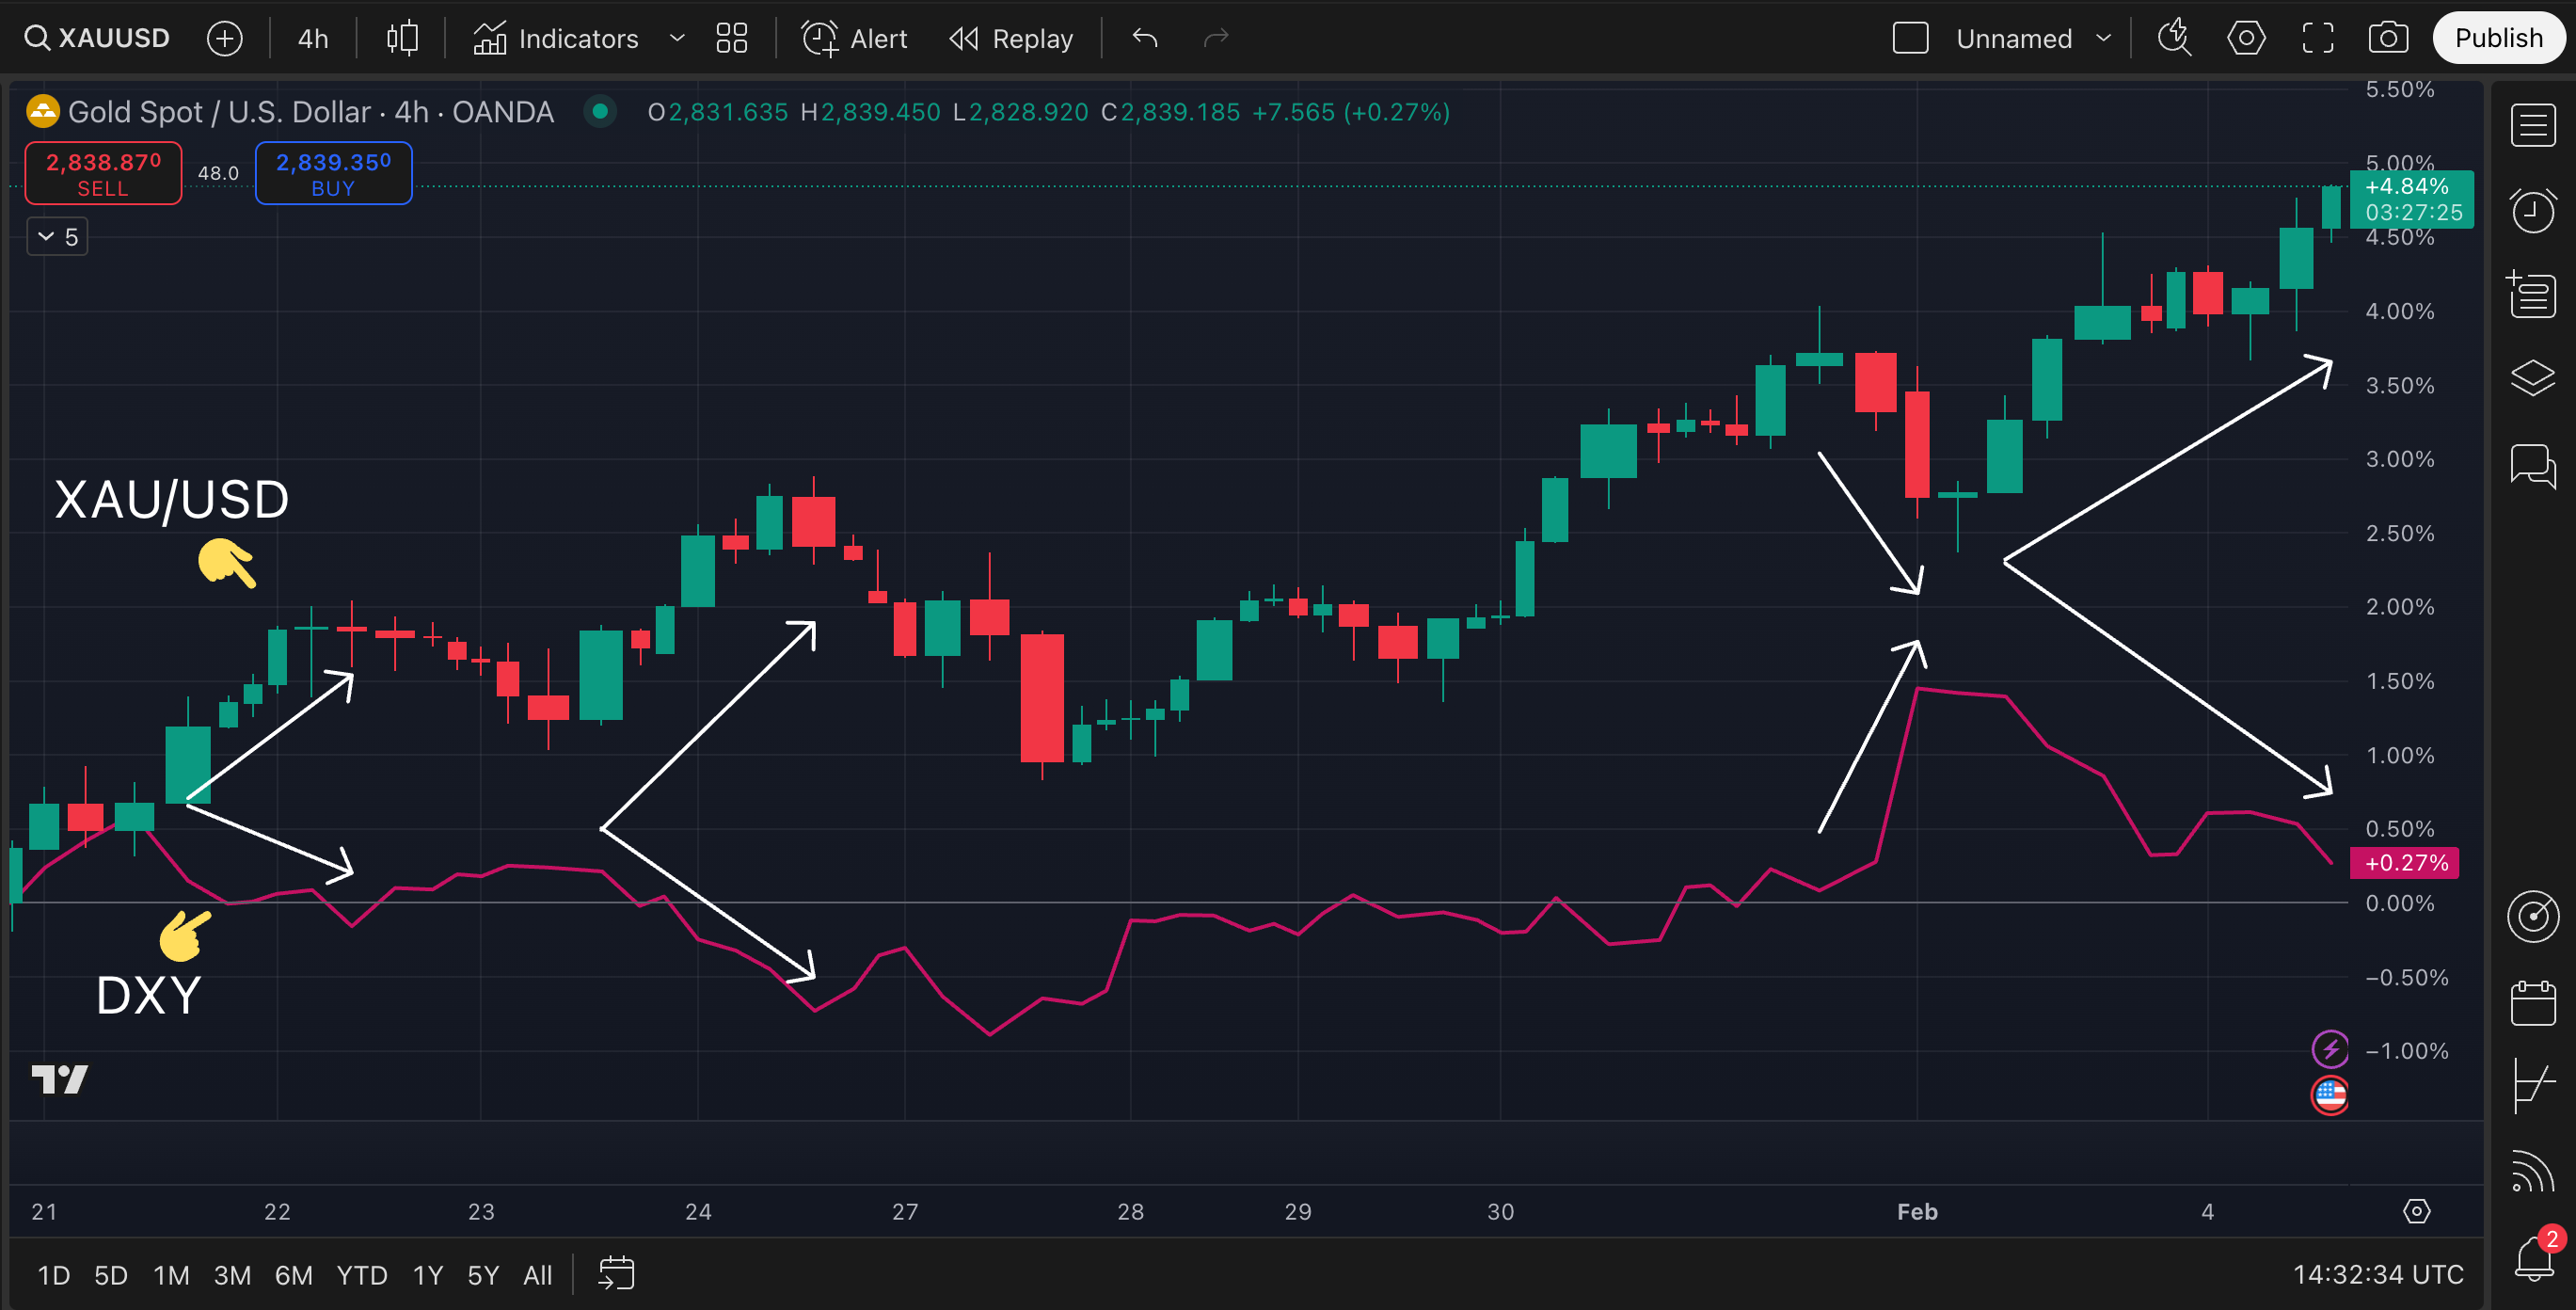
US dollar index (DXY)
Why it matters: The dollar is the world’s reserve currency; changes in its value can have ripple effects on all dollar-denominated commodities, especially Gold.
Correlation: Often inverse. When DXY rises, Gold may get pressured. When DXY weakens, Gold often rallies.
Bond yields
Why it matters: Yields reflect both risk sentiment and central bank policy expectations, which can drastically shift the flow of capital into or out of Gold.
Correlation: Often inverse. Rising yields can make Gold less appealing since Gold doesn’t offer interest. Conversely, falling yields can be Gold’s best friend.


Gold Spotter TV indicator
Why it matters: Designed to anticipate Gold’s directional shifts 3–5 days in advance (on a daily chart).
Key advantage: It provides time-based leads, which, when cross-checked with real-time moves in the dollar and yields, can filter out false positives or confirm strong set-ups.

Broad Strategy: Look for Alignment
A single indicator can be right—or it can be dead wrong if broader forces are working against it.
By pairing your Gold Trader Indicator with DXY and yields, you increase the odds of successful setup.
Think of it like a triad:
Gold Spotter Indicator → gives you the probable direction of Gold (3-5 days in advance).
DXY → check if the dollar is aligned with a Gold move.
Yields → see if interest rates/risk sentiment add extra support to Gold’s direction.
🚨 Always keep in mind that the Gold Spotter is a leading indicator, the market will not react right away in most cases.
Common alignments
Bullish Gold scenario: The indicator flashes bullish; the dollar shows signs of topping or fading; and yields are trending down or at least stalling.
Bearish Gold scenario: If the indicator turned bullish but the dollar is climbing higher (or yields are spiking), you might wait for better confirmation or manage your risk more carefully (reduce trade allocation, tighten stops etc).
Let’s see how it looks in practice.
3 Trade Scenarios Examples
The Gold Spotter Indicator is the centerpiece for timing. It’s designed to lean forward 3–5 days.
In practice, you want to see:
✅ Indicator (daily chart) → Spots a trend shift early.
✅ Market confirmation (4h charts) → DXY and yields eventually corroborate that shift (or at least don’t contradict it severely).
Proactive vs. Reactive
Proactive: Sometimes I’ll take a slightly early position purely based on the indicator’s bullish sign, anticipating the rest of the market will catch up.
Reactive: Yet, most of the times, I’ll wait for DXY to actually break down or yields to tip over before going in heavy. This approach can reduce false signals, albeit at the cost of entering later.
Example A: Textbook bullish confirmation
Gold Spotter Indicator: Bullish signal, indicating possible upward momentum starting during the next 3–5 days.
Dollar Index: DXY has been forming lower highs. Additional signal → if DXY falls below a key support level (e.g., a 50-day moving average).
Bond Yields: The 10-year yield is rolling over—say from 3.5% to 3.2%—signaling less competition for Gold.

I’ve already written how I swing trade with the Gold Spotter in this post.
In short, I wait for a small pullback/consolidation and, in most cases, I want to see a bullish daily candle after a moderate pullback before entering the trade.
I hold the position, watching for any sign of a surprise DXY reversal. If the dollar surges unexpectedly, I might scale out or tighten my stops.
If I missed the start of the rally and wonder if it’s still worth jumping onto the Gold’s bullish trend, doing the same intermarket analysis can help confirm if the overall setup is favorable to enter the trade.

Example B: Mixed signals → wait or proceed with caution
Gold Spotter Indicator: Flashes a bullish signal.
Dollar Index: Range-bound—neither strongly up nor down.
Bond Yields: Climbing steadily, which might be a headwind for Gold.

Since the indicator is bullish and the dollar isn’t a major threat right now, I might still consider a long trade.
However, yields are rising, so Gold could face downside pressure.
In this case, I’d either enter a smaller-than-usual position, or wait for clearer weakness in yields before going all-in.
Example C: Bullish Gold Spotter vs. Dollar Strength → Pass
Gold Spotter Indicator: Signals a bullish shift.
Dollar Index: Already in a strong uptrend, making consecutive higher highs with plenty of bullish momentum.
Bond Yields: Relatively stable, not giving you a clear read, or even start falling slightly.
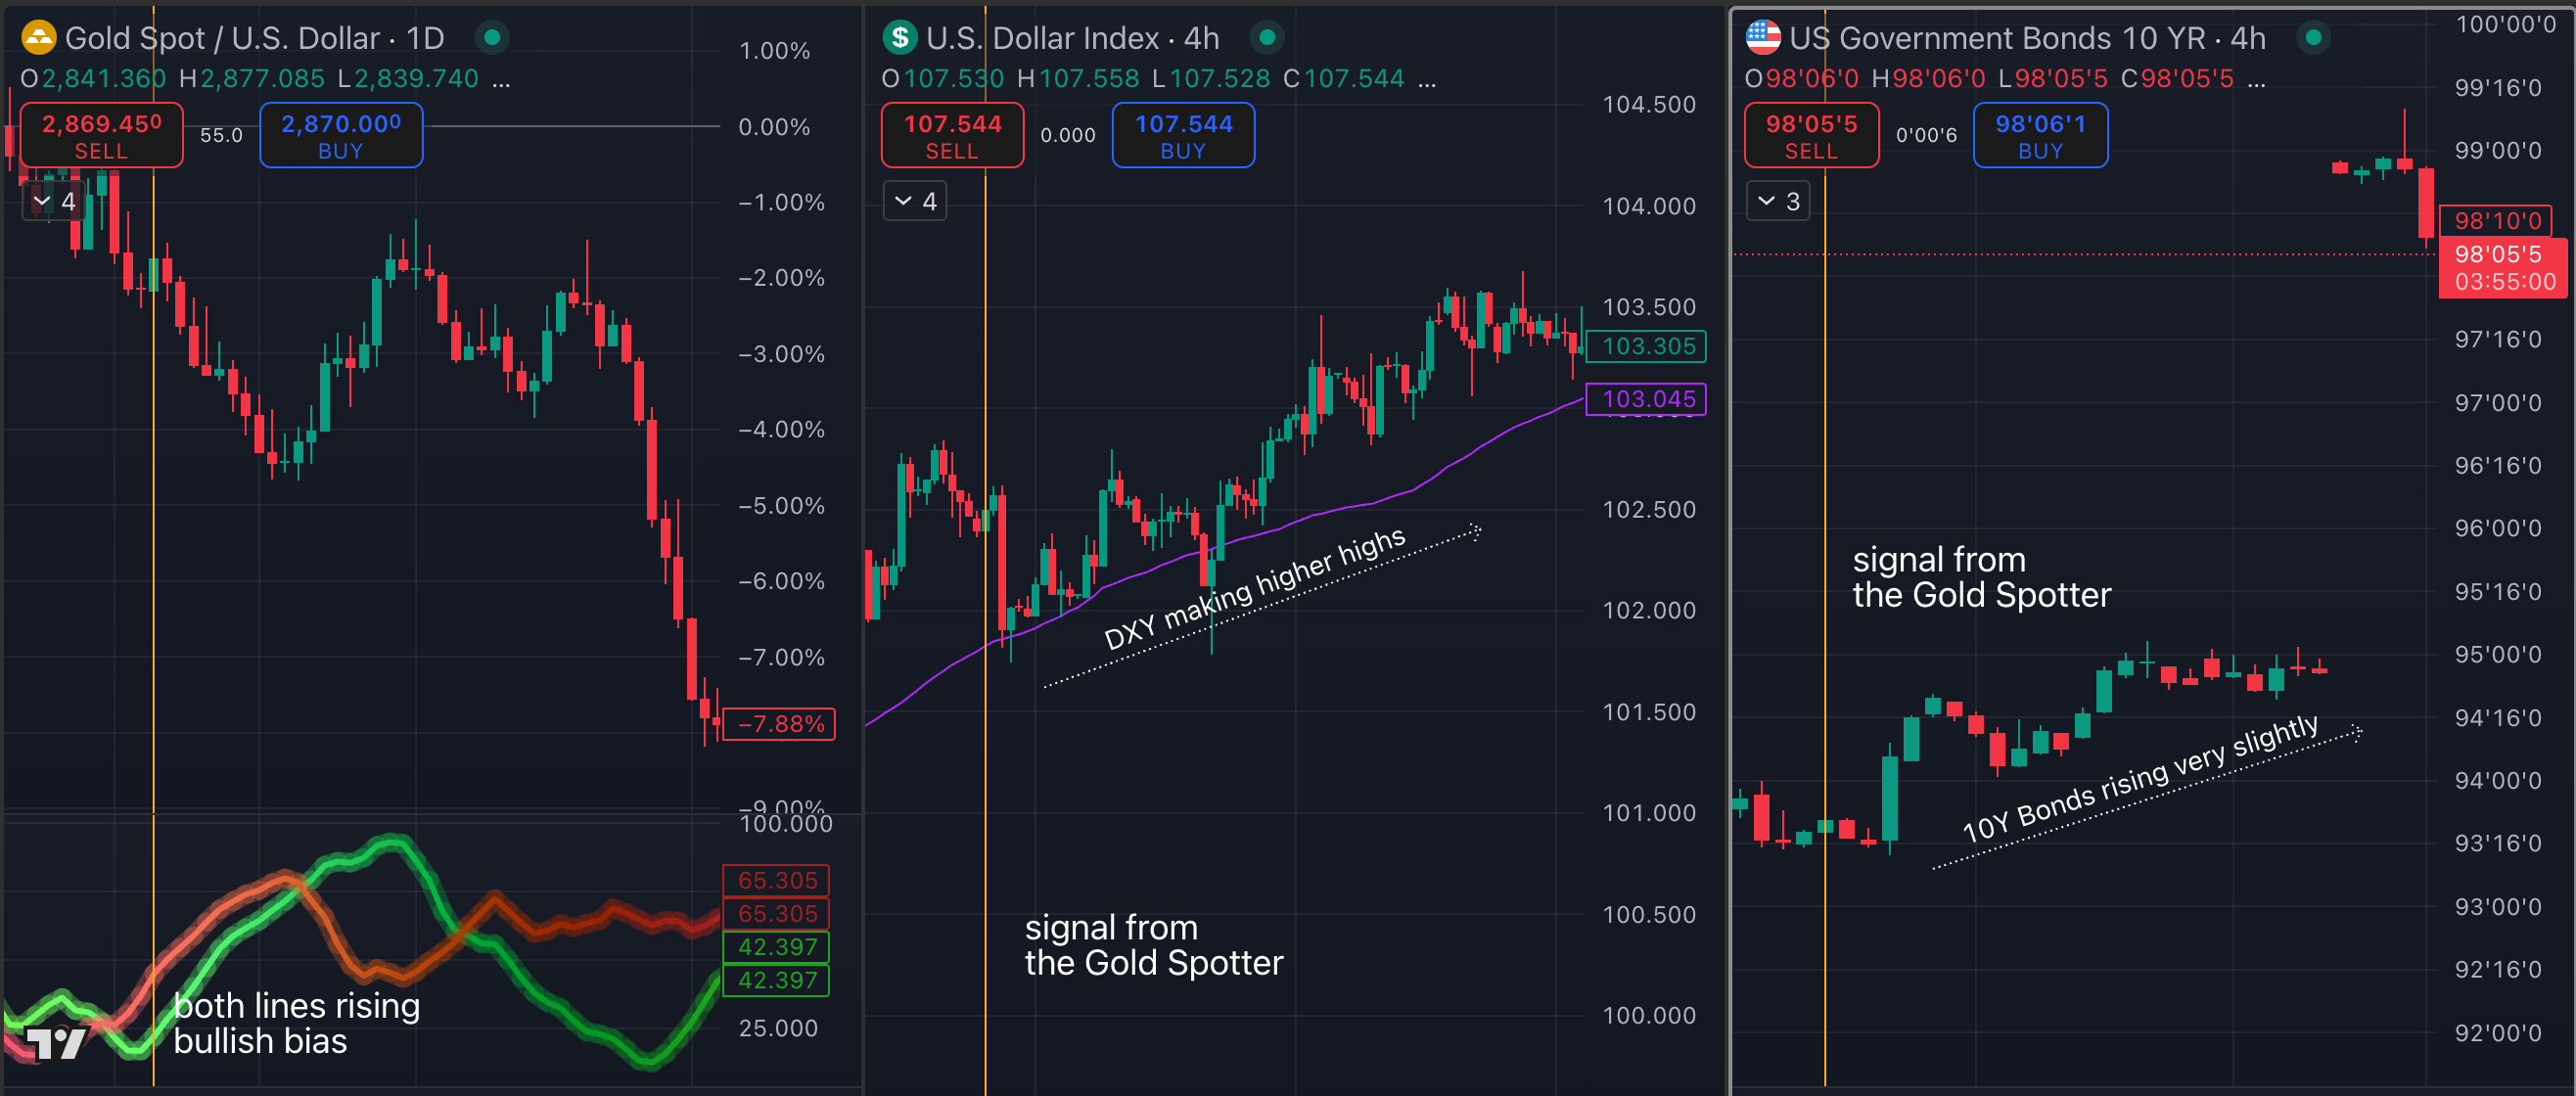
Even if the indicator says “go long,” the dollar is super strong. That’s a big caution sign for a bullish Gold position. If yields also start rising, that’s a double setback for Gold.
I’d choose to stand aside until the dollar rally shows some sign of stalling.
Alternatively, I could try a quick, intra-day long trade—but for swing or position trades, I’d likely wait.
Additional scenario: Correlation disruptions
Sometimes, correlations break.
For instance, you might see Gold rallying along with a rising dollar. This often occurs during:
Geopolitical crises: Markets chase safe-haven assets, including the dollar and Gold.
Central bank interventions: If rates are pegged or manipulated, yields might not move as expected.
In such cases, trust your indicator for Gold’s direct signals, but monitor the fundamental news or event driving the break.
These episodes can be short-lived, but they highlight why flexibility is crucial.
Lastly…
This approach isn’t about bombarding your screen with 50 technical indicators. It’s about synthesizing:
Gold-specific insights from the Gold Spotter.
Macro signals from the dollar and yields.
Every day, you can quickly gauge if the “wind” is at Gold’s back:
If DXY is at a major resistance and starting to slip, that’s a green flag for Gold.
If yields just broke their uptrend line, watch Gold for an extra push.
If your Gold Spotter Indicator is also showing bullish bias, you have that trifecta and an extra confirmation for a potential successful setup.
Safe trading,
and remember: All that glitters is not Gold,
Joe
p.s. This script is invite-only and exclusive to my paid subscribers. If you’re a paid subscriber, but hasn’t received access to the indicator, please respond to this email or write me a pm with your Trading View username.
I have been subscribed but have not gotten gotten access to Gold Spotter yet. Where can I send you my Tradingview username to get access? Thanks. 🙏