


🔥 It's here: The leading Trading View indicator fine-tuned for Gold XAU/USD

Hello, fellow traders!
I’m super excited to introduce you to a brand-new TradingView indicator that I’ve been working on for the last month:
👁️ Gold Spotter – a leading indicator designed to predict Gold’s future price direction with incredible accuracy.
This script is invite-only and exclusive to my paid subscribers.

First things first…
You need to a Trading View account to use this script.
Go here and “Join now for free” to get a 30-day free trial (cancel anytime) + 60% off TradingView annual plans.
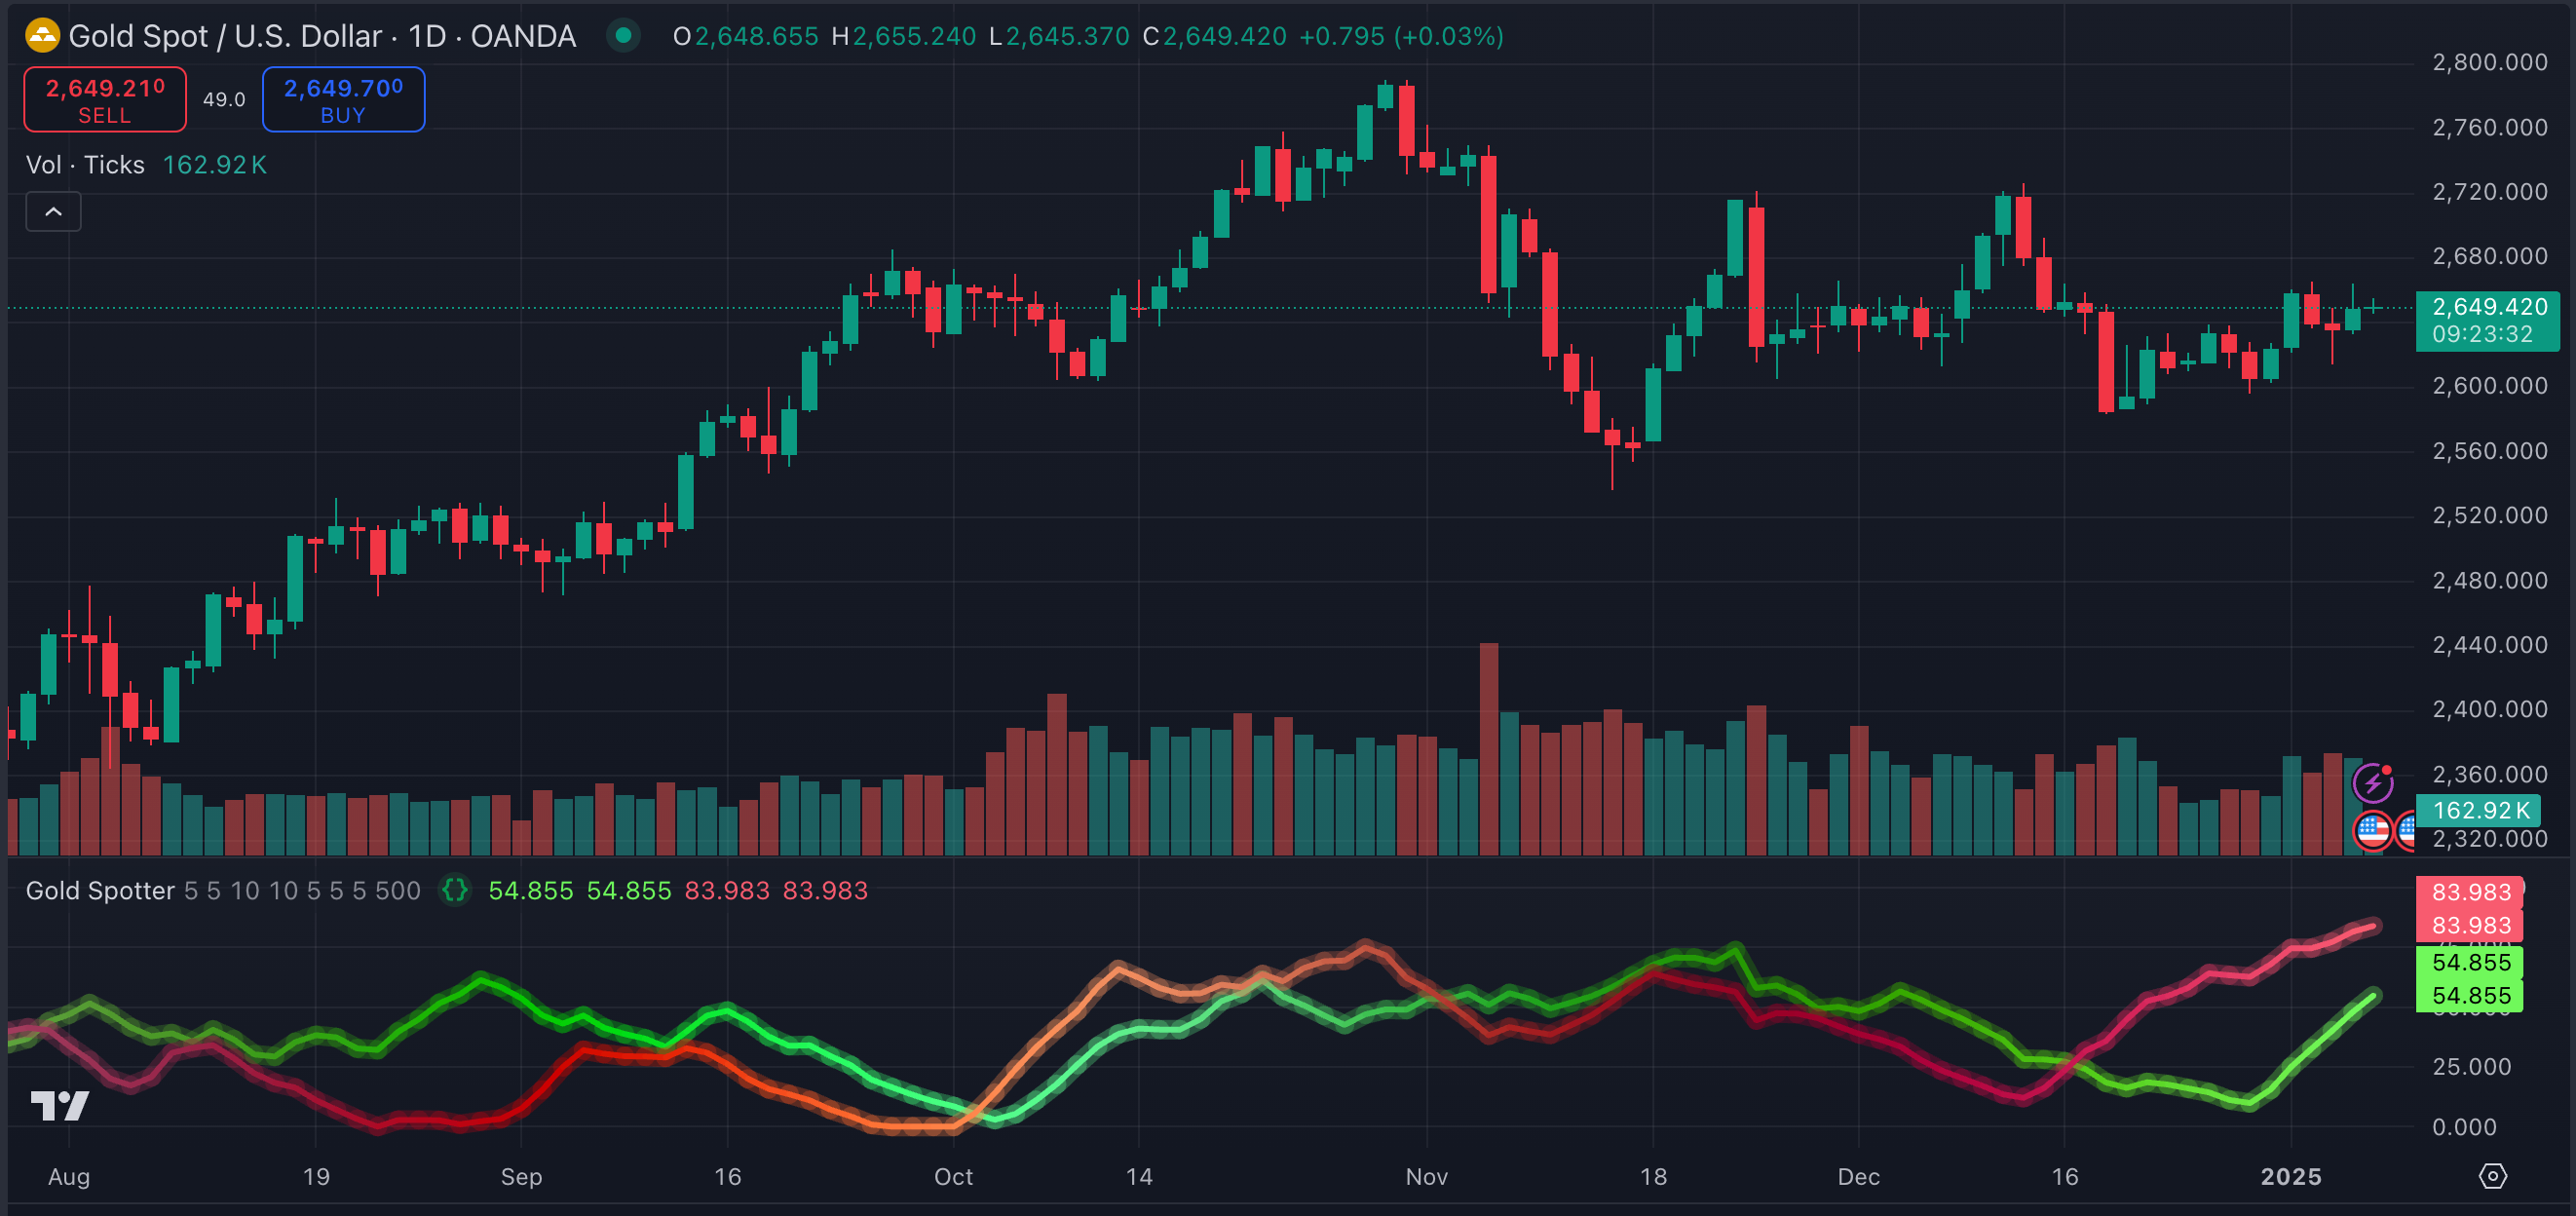
How Gold Spotter works
The indicator creates two key lines:
🟢 the Green Line
🔴 the Red Line.
Each line is based on a combination of market data that is normalized to fit within a 0–100 range.
To make these lines more predictive, they are scaled dynamically based on the relationship between Gold’s current price and its moving average. This ensures the indicator adjusts to Gold’s momentum.
When Gold’s price is above its moving average, the lines are “inflated” to amplify the signals.
When it’s below, the lines are “suppressed.”
What the lines represent
🟢 Green Line: Reflects a more stable group of instruments. These tend to move in predictable ways relative to the broader Gold market. Think of this as the “foundation” or baseline stability signal.
🔴 Red Line: Captures a more volatile group of instruments. These are often influenced by global risk sentiment and economic uncertainty, making them a strong early indicator of potential market shifts.
Together, these lines give you a unique view of hidden market dynamics that are often missed by traditional indicators.
Why it works
Gold doesn’t move in isolation. It is influenced by a combination of stability and volatility factors in the market.
By analyzing the relationships between the two baskets and weighting them based on Gold’s trend, this indicator gives you an early read on possible price movements.
The dynamic scaling ensures it adapts to changing market conditions while highlighting divergences and trends.
Timeframes and market conditions
Best timeframe: This indicator is designed to work best on 1D candles, as it relies on daily data for its calculations. It can work on 4H candles at a minimum, but it’s less accurate on lower timeframes. I also found that the Gold Spotter generally leads by 3-5 days.
Trending vs. consolidating markets: The indicator performs exceptionally well in trending markets where clear movements are present. In consolidating markets, it might still provide subtle divergences but could be less reliable due to muted signals.
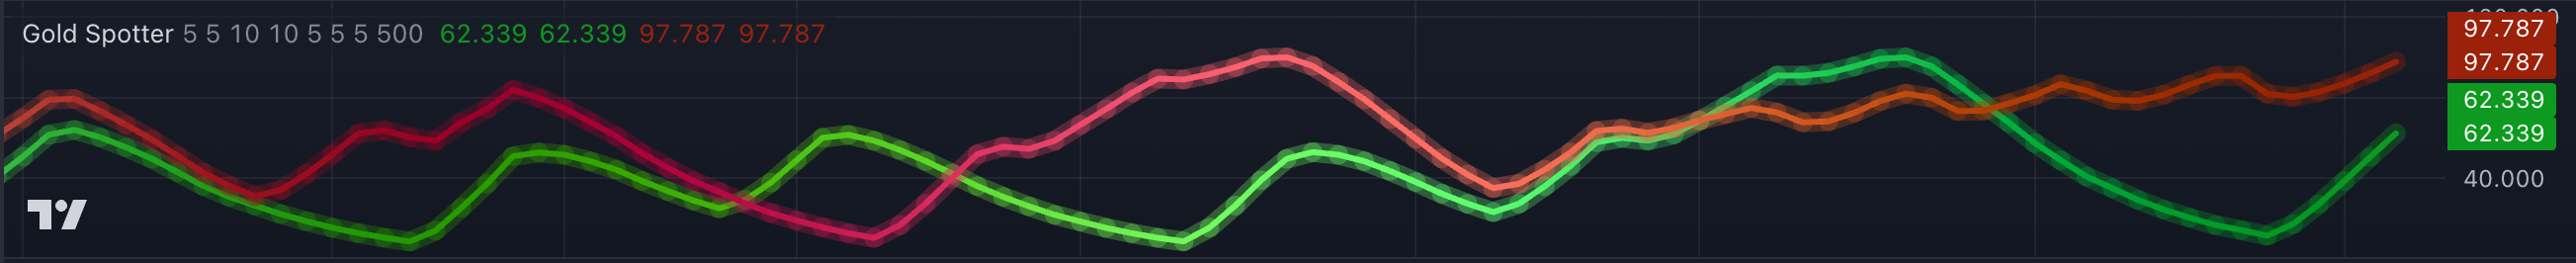
How to use Gold Spotter indicator

✅ Predict/confirm trends
When the Green and Red Lines move in the same direction, it’s a strong signal of Gold’s upcoming trend.
Both lines rising? Gold is likely to move higher. Look for a confluence of signals (like higher lows in Gold or a rising momentum indicator) to confirm an upward move.
Both falling? A decline might be coming.
✅ Spot divergences
Divergences occur when the green and red lines show conflicting movements.
Investors might be shifting into or out of certain currency groups, which can sometimes foreshadow changes in risk appetite that spills over into Gold.
Red Line rising + flat/falling Green Line: Sometimes this scenario surfaces when emerging markets are under stress. Volatile market components (Red Line) are reacting strongly to global risk sentiment or economic shifts, while the stable components (Green Line) might remain unaffected.
This often suggests short-term volatility and potential drop in Gold price. But it’s not necessarily a sustained downtrend.
Green Line rising + Red Line falling: This could signal that capital is rotating into more “stable” or “safe” flows, which can align with a moderate risk-off stance that sometimes supports Gold.
In this scenario, expect a strengthening trend for Gold.
Red + Green Lines flat: If both the Green and Red lines are flat, it suggests a period of equilibrium in the market where neither stability nor volatility factors are dominant.
This often occurs in consolidating markets and may indicate limited short-term price movement for Gold.
✅ Watch levels
Watch the indicator’s scale. Extreme values (near 0 or 100) suggest overbought or oversold conditions, which can precede reversals (similar to how traditional oscillators work).
Important!
The Gold Spotter indicator isn’t a crystal ball.
But its combination of market stability and volatility analysis provides unique insights you won’t find anywhere else.
Combine it with your usual technicals (trendlines, support/resistance, momentum indicators) and fundamental drivers to get the ultimate edge in your trading.
Use it wisely, and as always, let me know if you have questions or feedback.
This script is invite-only and exclusive to my paid subscribers. Please respond to this email or write me a pm with your Trading View username to get access.
Safe trading,
and remember: All that glitters is not Gold,
Joe
Do subscribers need to mail you to to get the indicator added to TV?