


12 Hidden Gold Signals That Pros Watch (But 99% of Traders Miss) - PART II

Most traders never look beyond price charts and headlines. Even fewer dig into the real signals that move Gold before it breaks out.
In Part I, we looked at six of those rare edge indicators — cross-asset flows and structural tells that front-run Gold’s biggest moves.
Now in Part II, we’re going deeper.
These next six signals come straight from the institutional playbook — and they offer something retail traders rarely get:
A view into physical market stress
Early insight into trend strength vs. short-covering
Macro signals that show why Gold is moving, not just that it is
Each signal is broken down in clear terms:
✅ What it shows
✅ Why it works
✅ How to track and trade it
✅ Common mistakes to avoid
By the end of this series, you’ll know how to combine these into a powerful dashboard — giving you real clarity in volatile markets.

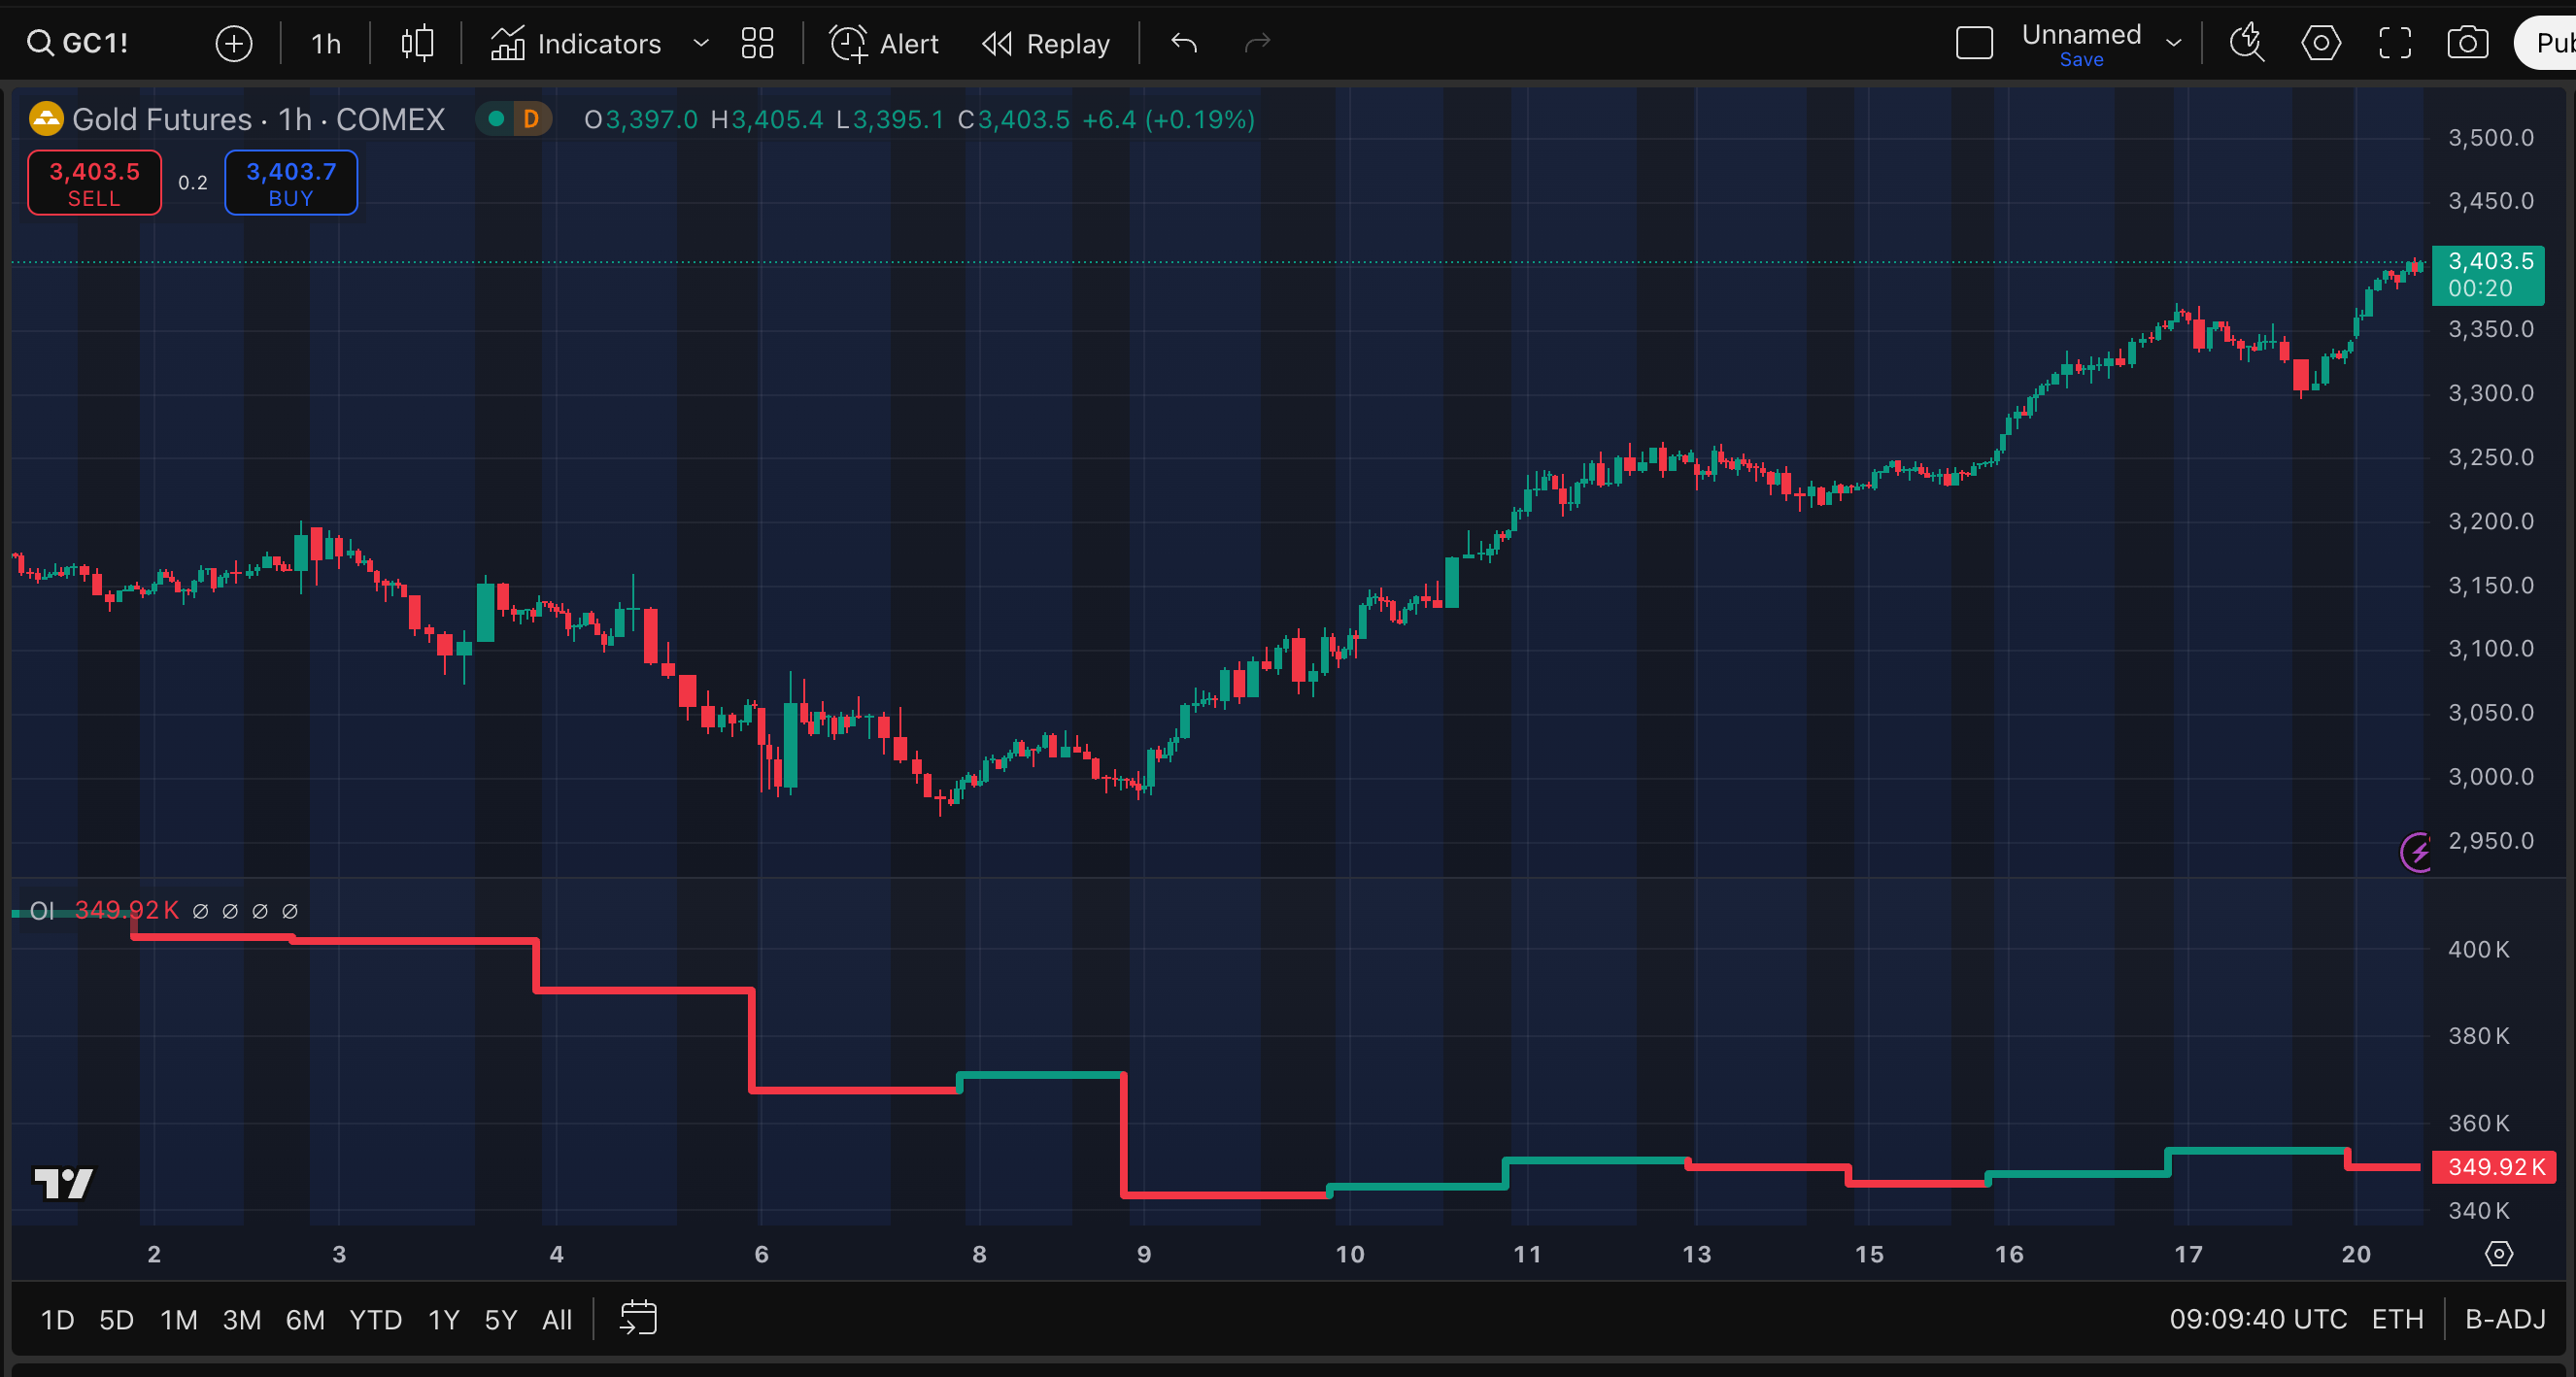
Signal #7: COMEX Open Interest + Futures Curve Shape – Positioning Insight
💡 What it is
Open Interest (OI) is the total number of active Gold futures contracts.
High OI = a lot of money and players are in the game;
Low OI = participation is thin.
Futures curve = how the market views future supply/demand pressure
Contango = normal, Gold for future delivery is slightly more expensive
Backwardation = rare → indicates tight near-term physical supply or surging spot demand


🟢 Why it works
Open Interest (OI) helps distinguish between moves driven by fresh capital inflows (sustainable) versus those fueled by short-covering or stale positioning (less durable).
The futures curve adds a timing layer:
Contango (normal state) = reflects storage costs and interest rates
Backwardation (rare) = signals urgent physical demand or tight supply → Historically tied to negative GOFO rates, backwardation has often preceded major Gold rallies due to physical shortages.
High/rising OI + backwardation =
Either a crowded speculative market (vulnerable to a flush), or
A true physical supply squeeze (potential for sharp upside continuation)
These structural signals can’t be seen on price charts alone, giving you early insight into the positioning and physical flows that drive Gold’s bigger moves.
🔑 How to read it
Track COMEX Gold OI (available daily via CME, or visible on many platforms under the Gold futures ticker GC).
Watch how OI shifts relative to price:
⬆ OI + ⬆ Price = New money entering the trend → Bullish confirmation (until it becomes overextended)
⬆ OI + ⬇ or ↔ Price = New short positioning → BUT could trigger future short-covering rally
⬇ OI + ⬆ Price = Short-covering rally → Often temporary unless new buyers appear
⬇ OI + ⬇ Price = Long liquidation → Possible capitulation — bottoming setup
Use OI extremes as sentiment tools:
High OI = “crowded trade” → vulnerable to a shakeout
Low OI = empty market → ready to rally if demand returns
Monitor the Futures Curve (available on CME or through platforms that quote Gold contract expiries (e.g., GC1!, GC2!, etc.)
Normal: Contango – further-out contracts priced slightly higher
Watch for:
Shrinking spread → growing demand for nearby delivery
Inversion (Backwardation): Spot > front-month futures
It signals urgent physical demand or supply squeeze. Even mild backwardation can act as a strong bullish tell.
❌ Typical mistakes
Misinterpreting OI directionally: Open Interest doesn’t tell you who’s winning — every futures contract has a buyer and a seller. Rising OI alone isn’t bullish or bearish.
⬆ OI + ⬆ price → likely new longs entering
⬆ OI + ⬇ price → likely new shorts entering
Always interpret OI changes alongside price action and trend context.
Not accounting for seasonal factors.
Gold OI often peaks when a big active contract is about to roll (like just before Feb, Apr, Jun, Aug, Dec contracts roll off, OI shifts). Adjust for that by looking at aggregate across all active months.
Misreading contango in high-rate environments:
In high-rate environments (like 2023–2024), Gold will naturally have wider contango → Not necessarily a bearish signal — just reflects higher carrying costs.
Don’t confuse normal yield-driven contango with oversupply or weak sentiment.
📚 Use cases
Treat OI as a thermometer for market engagement: You want it in a “healthy” range – not excessively hot (crowded) or cold (abandoned).
Extreme OI highs → Watch for exhaustion, crowding risk
Ideal time to tighten stops or take partial profits
Extreme OI lows → Possible contrarian opportunity after a washout
Market may be "clean" and ready for a fresh trend
OI changes around key technical levels offer powerful confirmation:
Breakout above resistance + ⬆ OI = Bullish – new buyers entering
Breakout + ⬇ OI = Caution – likely short-covering only
Breakdown below support + ⬆ OI = Bearish – fresh short positions
Breakdown + ⬇ OI = Possibly just long liquidation – may stabilize
Large OI clustered around specific strike prices can act as price magnets near options expiry. This ventures into gamma dynamics, but in practice:
High OI strikes = potential zones of price gravity
Watch how price behaves as expiry nears — these levels often exert influence.
Signal #8: Gold Lease Rates (GOFO / GLR) – Institutional Supply-Demand
💡 What it is
Gold Lease Rate (GLR) is the annualized interest rate paid to borrow physical Gold → typically used by bullion banks, central banks, or large traders, and reflects the cost of leasing Gold, often collateralized by U.S. dollars.
Gold Forward Offered Rate (GOFO) — the interest rate at which someone is willing to lend Gold in exchange for dollars over a set period.
There’s a core relationship:
Gold Lease Rate ≈ LIBOR (USD rate) – GOFO
If GOFO is high, leasing Gold is cheap.
If GOFO turns negative, leasing becomes expensive — often a sign of physical Gold scarcity or surging demand.
🟢 Why it works
GLR/GOFO is like a “tightness gauge” for the physical Gold market. It captures institutional-level stress or positioning shifts that retail traders can’t see.
When lease rates jump, it means holders of Gold (like central banks or bullion banks) can charge more to lend their metal.
Rising GLR or negative GOFO has historically foreshadowed major upside moves by highlighting stress in the physical market. It's a critical early warning tool that reveals when Gold is truly in demand — before the price explodes.
🔑 How to track it (despite limited public data)
GOFO data was discontinued by the LBMA in 2015, and official lease rate quotes are no longer widely published. Yet, you can still extract valuable signals from a few reliable proxies and market clues:
📊 Futures vs. Spot (implied from pricing)
Compare Gold’s spot price to near-month futures
If spot > futures → Gold is in backwardation
This implies GOFO is negative, and lease rates are elevated
Rule of thumb: The price difference ≈ implied lease rate.
💡 Example:
Spot = $3,000, 1-month future = $2,996. This implies a backwardation of $4. Adjusted for interest/storage, it signals tightness in the physical market
Bloomberg terminal & Pro Systems (if available)
Bloomberg offers functions to view:
Gold forward curves
Implied lease rates from swaps
Tickers for Gold 1-month forward rates (e.g., XAU1M)
Other platforms (e.g. Refinitiv, FactSet) may also offer derived GLR indicators
📰 Market commentary & reputable Gold market sources
Look for language like:
“GOFO turned negative”
“Gold lease rates spiked”
“Gold entered backwardation”
Historical benchmarks for context
In calm markets:
Lease rates typically <1% (e.g. 0.1% to 0.5%)
GOFO usually positive
In stressed conditions:
Lease rates spike >1.5–2%+
GOFO can go negative, indicating backwardation
🔔 If you see or hear:
“1M GOFO at -0.5%” → bullish signal
“GLR at 1.5% (vs normal 0.2%)” → physical market tightness
Even without precise lease data:
Regularly check the spread between spot and front-month futures
If spot > front-month → backwardation warning
Combine with news flow and positioning data to assess if a physical crunch or delivery stress is underway.
Keep in mind that:
Short-term GLR spikes (1-month): often tied to month-end delivery stress
Longer-term rises (3–12 months): could reflect structural tightness or rising credit risk in Gold lending
❌ Typical mistakes
Misreading the cause of a spike
In late 2008, 1-month GLR spiked, GOFO dropped → looked like surging Gold demand. But in reality, USD Libor spiked during the credit crisis, artificially inflating GLR.
Gold initially fell in the liquidity crunch, even though the signal was flashing.
🔍 Lesson: A rising GLR must be Gold-driven, not just an artifact of USD rate volatility. Confirm with other signs: backwardation, physical tightness, or demand pressure.
Expecting immediate price reaction
GLR and GOFO are leading indicators.
For example, in mid-2013, GOFO turned negative several times → hinting at physical tightness. But Gold price stayed depressed for weeks after its big crash. Eventually, those signals marked the bottoming process.
Signal #9: Treasury Auction Demand + Treasury Auction Tails
Signals #9–#12 are are exclusive to premium subscribers — and for good reason. Each one unlocks a different dimension of the Gold market that most traders completely overlook.
🔒 Not subscribed yet? Upgrade now to unlock:
all 10+ Gold Signals
the most comprehensive Gold market deep dives on Substack and weekly Gold forecasts
real-time XAU/USD trades on Telegram.
Keep reading with a 7-day free trial
Subscribe to The Gold Trader to keep reading this post and get 7 days of free access to the full post archives.