


XAU/USD going bullish

Hello fellow traders!
We can see some very interesting movements in the gold price at the moment.
Let’s look at the technical side and how we can leverage this data.
Heads up traders! This chart shows how gold prices moved over a very short period, specifically looking at one-minute intervals.
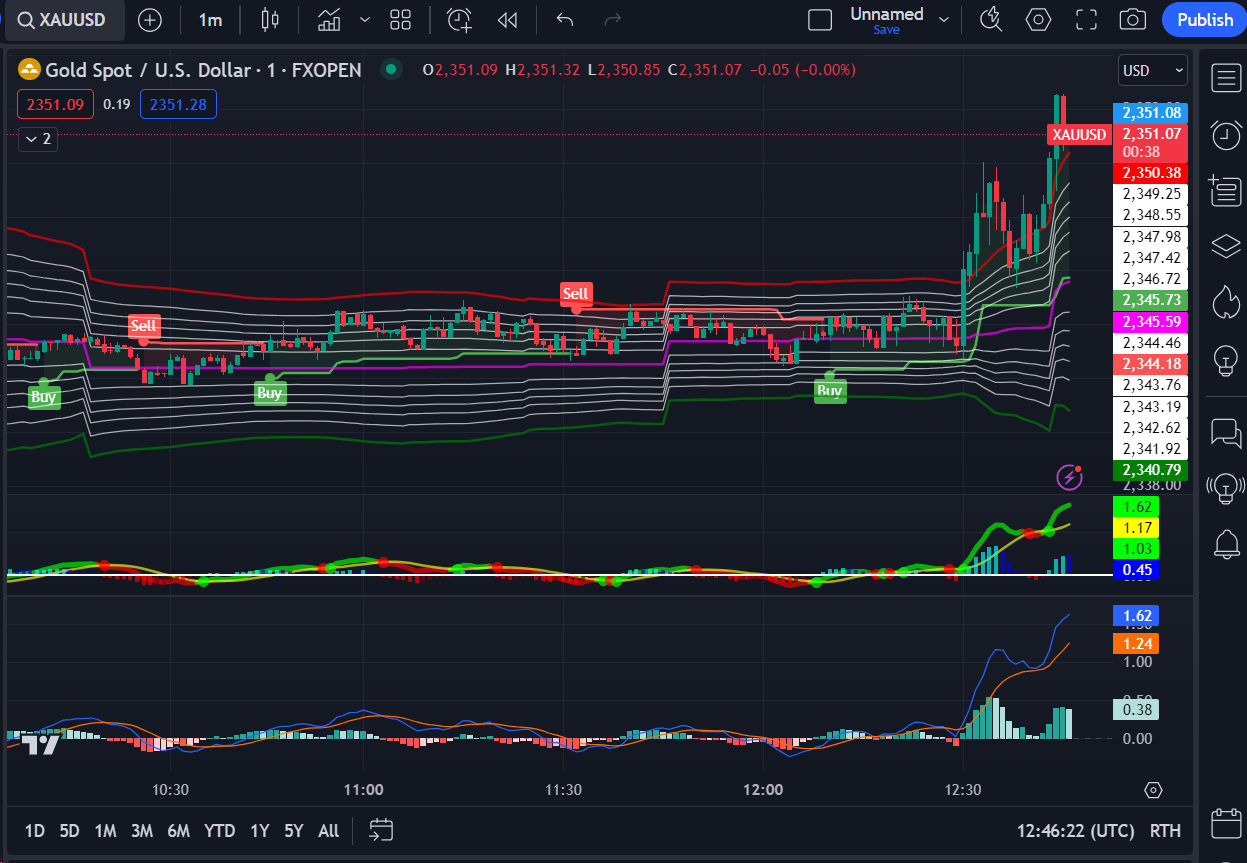
The volume - the number of trades, spiked as prices went up. This usually means more people are interested in buying and potentially validates the bullish trend. The MACD is trending upwards, meaning the price is likely to continue growing.
What will happen next IMO:
Short-term (Next few minutes): With strong volume and bullish indicators, the price will likely keep going up. Watch for resistance around $2,352 - $2,353.
Mid-term (Next few hours): If the price keeps rising, it might reach $2,355 - $2,360. But if it hits resistance and falls back, it could drop to $2,345 - $2,347.
How I will trade
Entry Points:
Long Position: Buy around the current price ($2,351) since indicators are positive. A good sign to buy would be if the price goes above $2,352.
Pullback Entry: If the price drops, look for entry opportunities around $2,347 - $2,348, near the middle Keltner Channel band, which could act as support.
Exit Points:
Take Profit: Set your first goal at $2,355. If it keeps going up, aim for $2,360.
Stop Loss: Set a stop loss below $2,345 to limit losses if the price drops.
Monitoring:
Continuously monitor the volume and MACD indicators. If volume drops or MACD shows a negative trend, the price might fall..
Watch the Keltner Channels for any "Sell" signals that might suggest it's time to adjust or close your position.
Safe trading,
and remember: All that glitters is not gold,
Joe