
XAUUSD analysis: short-term bounce possible

Let’s break down gold price movements over the past few days.
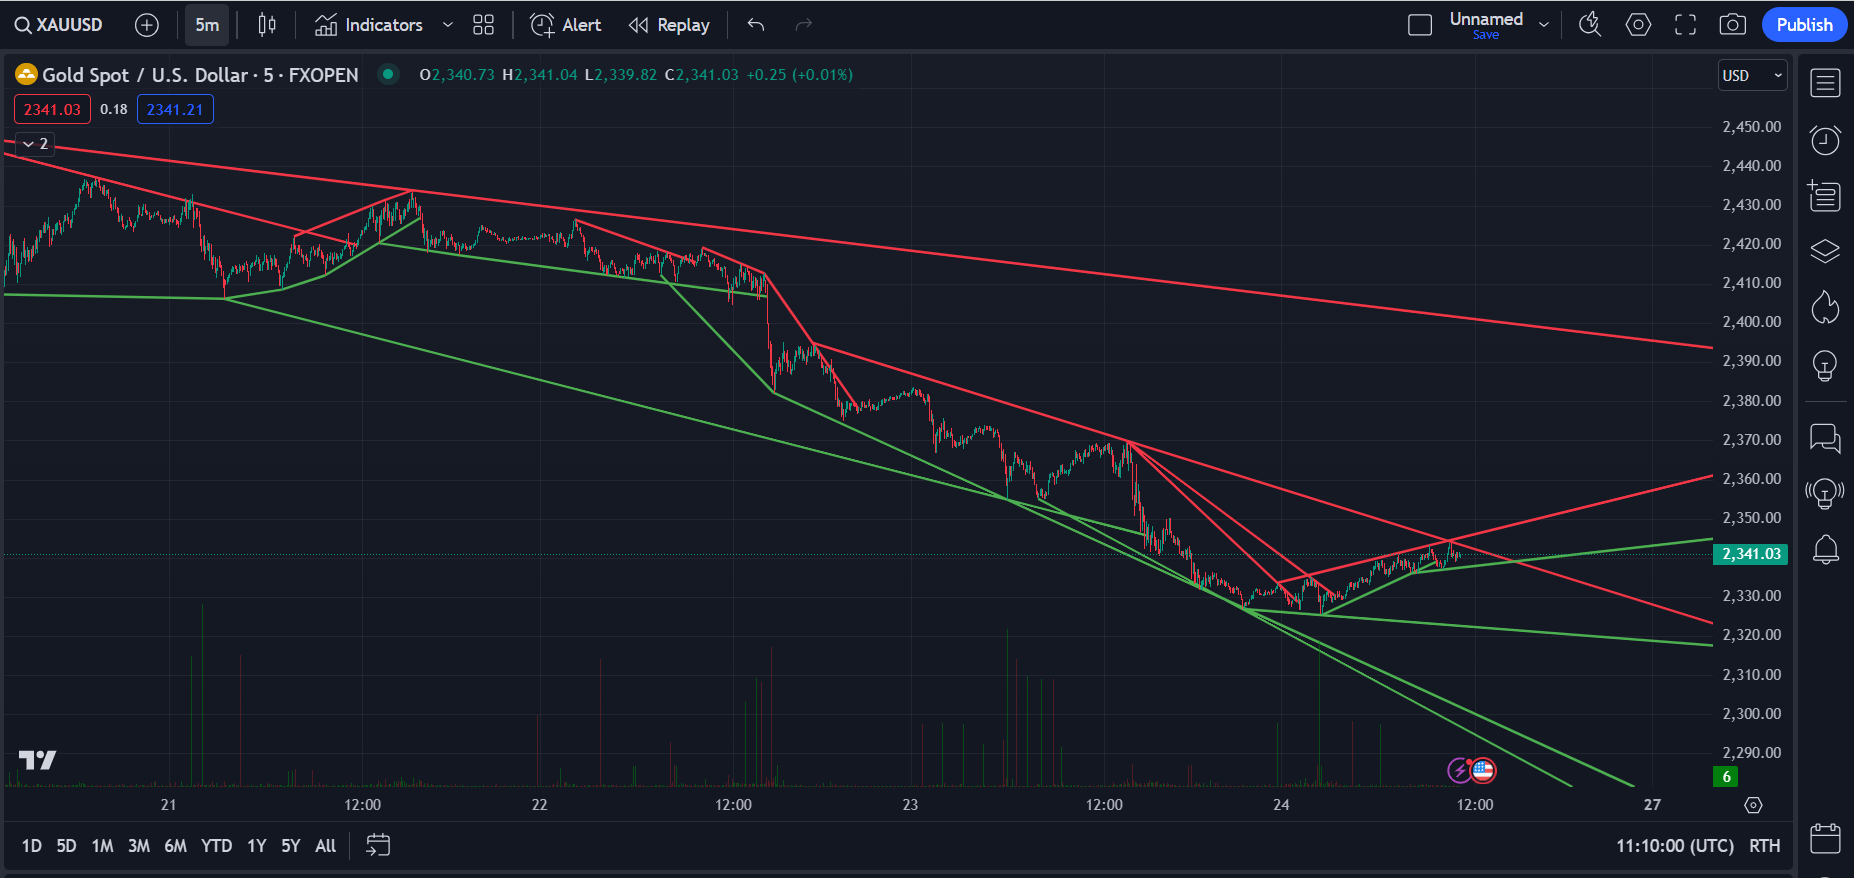
Trend Overview
Downtrend:
We see prominent downward trend channels, indicated by the red lines - a strong bearish movement.
Gold tried to break this trend several times but couldn't, showing strong selling pressure.
Support and Resistance:
The gold price appears to have found some support around the 2315 to 2320 levels.
Resistance is around 2345-2350, where the price has struggled to break above.
Volume
We can see notable spikes in trading volume near key price levels.
Volume increases significantly around the support levels, suggesting accumulation by buyers.
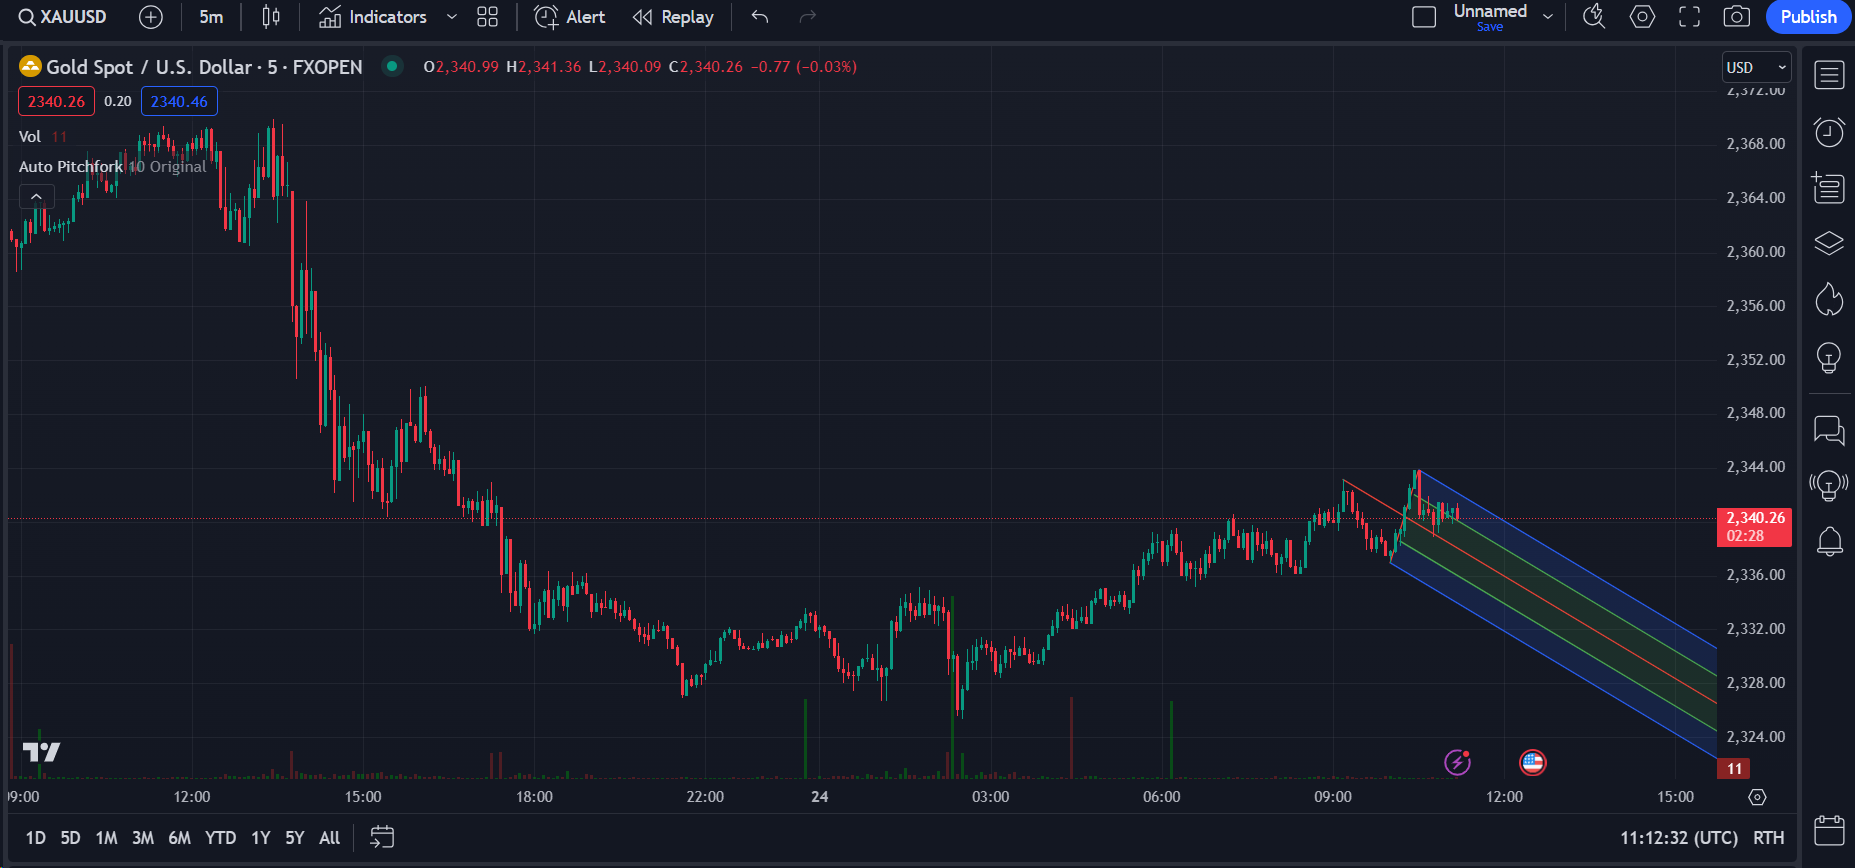
Trend Reversal
While the chart does not explicitly show moving averages, the trend channels and recent price behavior suggest we might witness a short-term trend reversal.
The price has stabilized and is showing a slight upward movement from the bottom of the trend channel.
Seasonal & Historical Performance
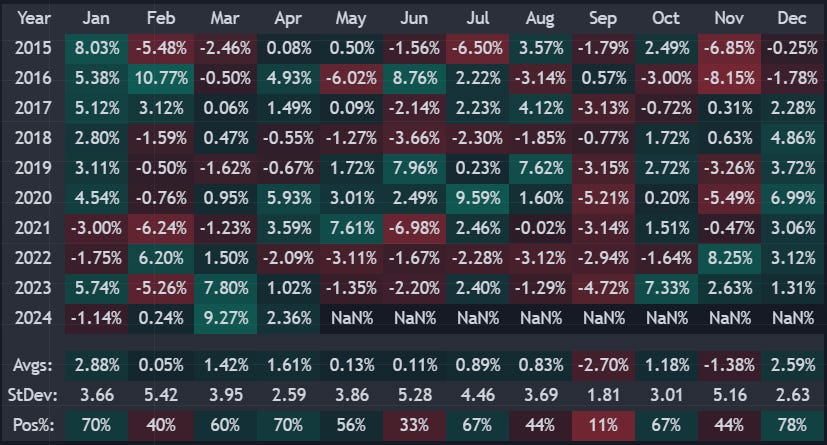
January usually has positive returns, averaging 2.88%.
May and September are typically volatile months.
Recent years show mixed performance with notable gains in certain months (e.g., January 2023 +5.74%, February 2023 +7.80%).
Prediction
Short-Term:
Given the current stabilization around the 2315 support level and a slight upward trajectory, there is potential for a minor bullish correction in the short term.
The immediate target could be around 2345 to 2350.
Mid-Term Outlook:
Considering the historical performance and seasonal trends, if the price breaks through the 2345 resistance, the next target could be around 2370 to 2380.
If the price falls below 2315, it could drop to 2290-2300.
Trading Strategy
For Bulls: Consider buying near 2315 support with a target of 2345. Use stop losses below 2300 to manage risk.
For Bears: If the price fails to break 2345 resistance, consider selling with a target around 2290-2300.
Safe trading,
and remember: All that glitters is not gold,
Joe