Hello, fellow traders!
Gold started this week on a positive note after a correction last week. The price fell over 4% because the US economic data dampened hopes for rate cuts from the Federal Reserve. Last week, several FOMC members indicated that a restrictive policy would continue for a while, at least until we see significant progress in lowering inflation.
The recent pullback showed that support at the 23.6% Fibonacci level ($2,326) is holding strong, just like it has in the past. There's not much interest in selling gold right now because people expect prices to go up once the Fed eventually cuts rates. Plus, worries about geopolitical tensions keep the downside limited.
That said, the strong bullish momentum we saw earlier this year is starting to fade. While the trend is still upward, it's facing more frequent and tougher resistance levels.
XAU/USD is likely to stay volatile in the coming weeks as traders look for more clues on interest rates. The US PCE index release this week could shake things up, especially if the data surprises. Fed comments will also play a big role in where gold goes next.
Let’s see how the technical side looks like for today and how we can leverage it in our trading 👇🏼
Volume Delta → buying vs selling pressure
The price action has been relatively flat with little change for most of the month. There are occasional spikes both upwards and downwards (May 1st, May 13-15, May 25-27) - probably caused by short-term news events or sudden changes in the market.
Today, there’s been a significant upward spike in price around 03:00, reaching over 3K in volume delta.
Nonetheless, the overall movement remains relatively subdued. This might mean the market is waiting for something big to happen.
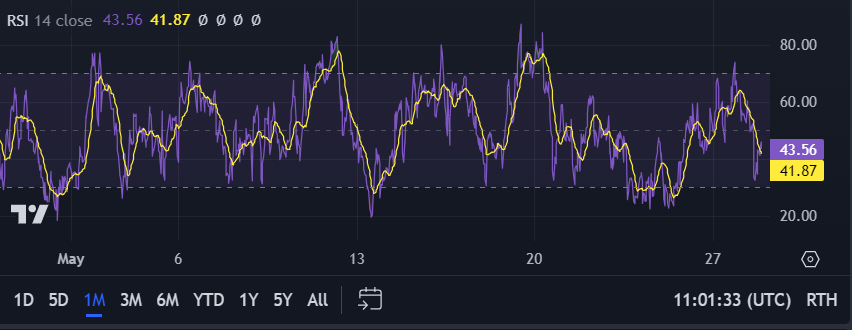
RSI → overbought vs oversold market conditions

RSI Values: The RSI goes up and down between 20 and 80 throughout the month. Today, on May 28th, it moves between 30 and 70.
Overbought/Oversold Levels: The key levels to watch are 70 (overbought) and 30 (oversold). The chart shows the RSI hitting these levels several times:
Overbought: The RSI goes above 70 around May 7th, May 14th, and May 20th, meaning the market might be too high. On May 28h, it almost hits 70 around 03:00 and 09:00.
Oversold: The RSI dips below 30 around May 6th, May 13th, and May 23rd, meaning the market might be too low. It almost hits 30 around 06:00 on May 28th.
MACD → entry points for buying vs selling
The gold price dropped significantly but is now stabilizing. The bearish momentum seems to be decreasing, which could suggest a recovery or at least a stabilization in the short term.
What To Expect:
Short-Term (Next Few Days): Given the price stabilization and the MACD converging towards the zero line, we can expect some sideways movement with potential minor recoveries.
Mid-Term (Next Few Weeks): The 1-month RSI chart's frequent ups and downs, we might keep seeing alternating periods of bullish and bearish trends.
Watch for Support Levels: Monitor the price around the current levels (2,342 - 2,346) to see if it forms a stable support.
Monitor inflation data, Federal Reserve policies and geopolitical events: Since gold is a hedge against inflation, changes in inflation rates can affect its price. Same goes for news on interest rates or monetary policy - both can affect price movements.
Trading Strategy:
Entry Points:
RSI: Enter a buy position when the RSI dips below 30 (oversold) and starts to rise. Enter a sell position when the RSI exceeds 70 (overbought) and starts to fall.
MACD: Enter a buy position when the MACD line crosses above the signal line from below. Enter a sell position when the MACD line crosses below the signal line from above.
Exit Points:
RSI: Exit the buy position when RSI approaches 50 from below, and exit the sell position when RSI approaches 50 from above.
MACD: Exit positions when the MACD line crosses back over the signal line in the opposite direction of the entry.
Risk Management:
Stop Loss: Set a stop loss at 1% below the entry price for buy positions and 1% above the entry price for sell positions.
Take Profit: Set a take profit at 2% above the entry price for buy positions and 2% below the entry price for sell positions.
Example Trade Setup:
Current Situation: Based on the latest 1-day chart and RSI levels around 45-54, and MACD lines close to neutral, we are in a wait-and-see mode.
Potential Buy Signal: If the RSI drops below 30 and the MACD shows a bullish crossover, enter a buy position.
Entry: Assume entry at 2,344.00.
Stop Loss: 1% below entry at 2,320.56.
Take Profit: 2% above entry at 2,390.88.
Potential Sell Signal: If the RSI exceeds 70 and the MACD shows a bearish crossover, sell.
Entry: Assume entry at 2,352.00.
Stop Loss: 1% above entry at 2,375.52.
Take Profit: 2% below entry at 2,305.96.
Safe trading,
and remember: All that glitters is not gold,
Joe


