


Why the $3,250 Zone Could Trigger a Sharp Sell-Off If Support Fails [Weekly XAU/USD Analysis + Forecast + Trading Playbook]

Hello, fellow traders!
Gold started the week strong, extending its safe-haven rally from late March. Investors flocked to bullion amid escalating U.S.-China trade risks and doubts over Fed policy credibility. In fact, Gold peaked at a record $3,500/oz early Tuesday when President Trump’s sustained attacks on Fed Chair Powell and new import levies spooked markets.
Sentiment flipped mid-week: The White House signaled trade de-escalation. And Trump walked back threats to fire Powell.
The result? A broad rotation out of safe havens – Gold swiftly fell ~3% Wednesday from its highs as traders piled back into stocks.
Major U.S. indices jumped and the dollar bounced off its lows while Gold underperformed risk assets as optimism returned – a reminder that its stellar run can pause when macro fears ease.

🔥 In this week’s premium market breakdown:
Interpret hidden TA signals before they hit the headlines: Pro breakdown of charts with key price action, structure, and warning signals.
Exact price zones to act on: Get clear entries, exits, and invalidation zones, so you can trade with structure.
Trade setups that deliver: High-probability scalping and swing trade ideas with clear take-profit and stop-loss levels.
Global macro gist: Spot which headlines matter for Gold, and which are just noise and understand how real-world policy is shaping the charts.
Sentiment shifts: Decode what the biggest traders in the world are doing right now and how their moves will shape next week’s volatility.
Intermarket intelligence: See how Gold is stacking up against Bitcoin, crude oil, equities, and global yields - understand correlations, breakouts, and capital rotations.
📊 Let’s look at the technical data
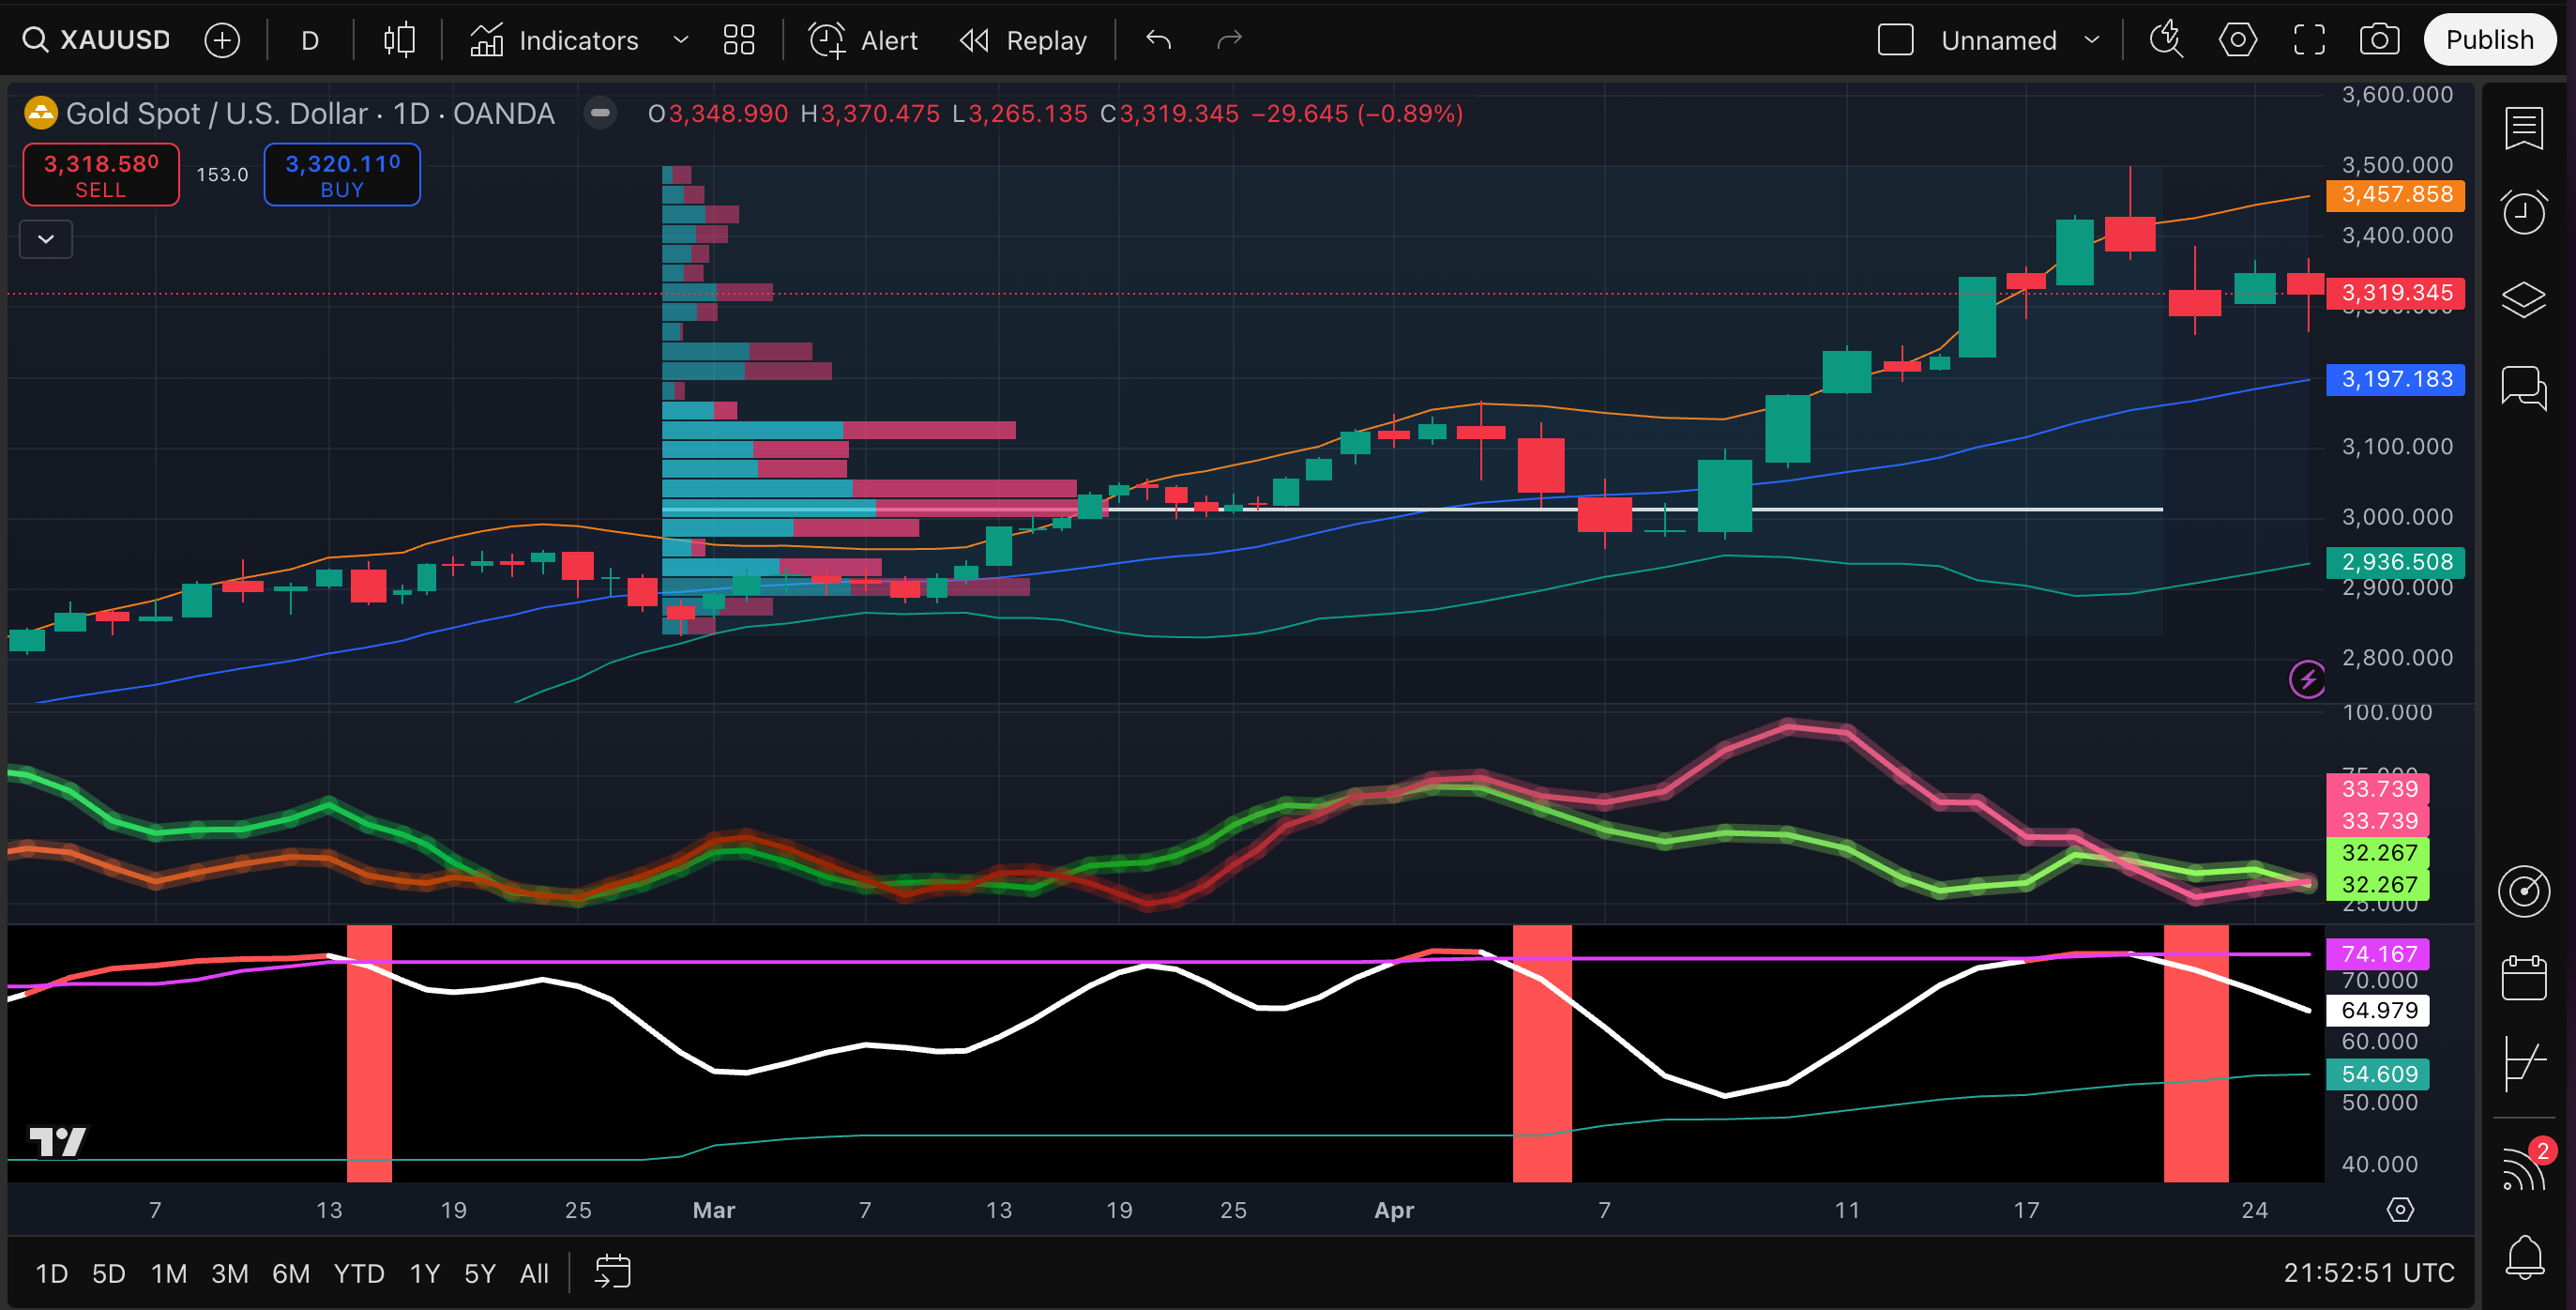


📅 Current Price: 3,319.34
Daily sentiment: 🟠 Mixed to slightly bearish
Long-term structure remains bullish:
20-day, 50-day, and 200-day EMAs are stacked bullishly and rising.
The major trend is healthy despite near-term price wobbling.
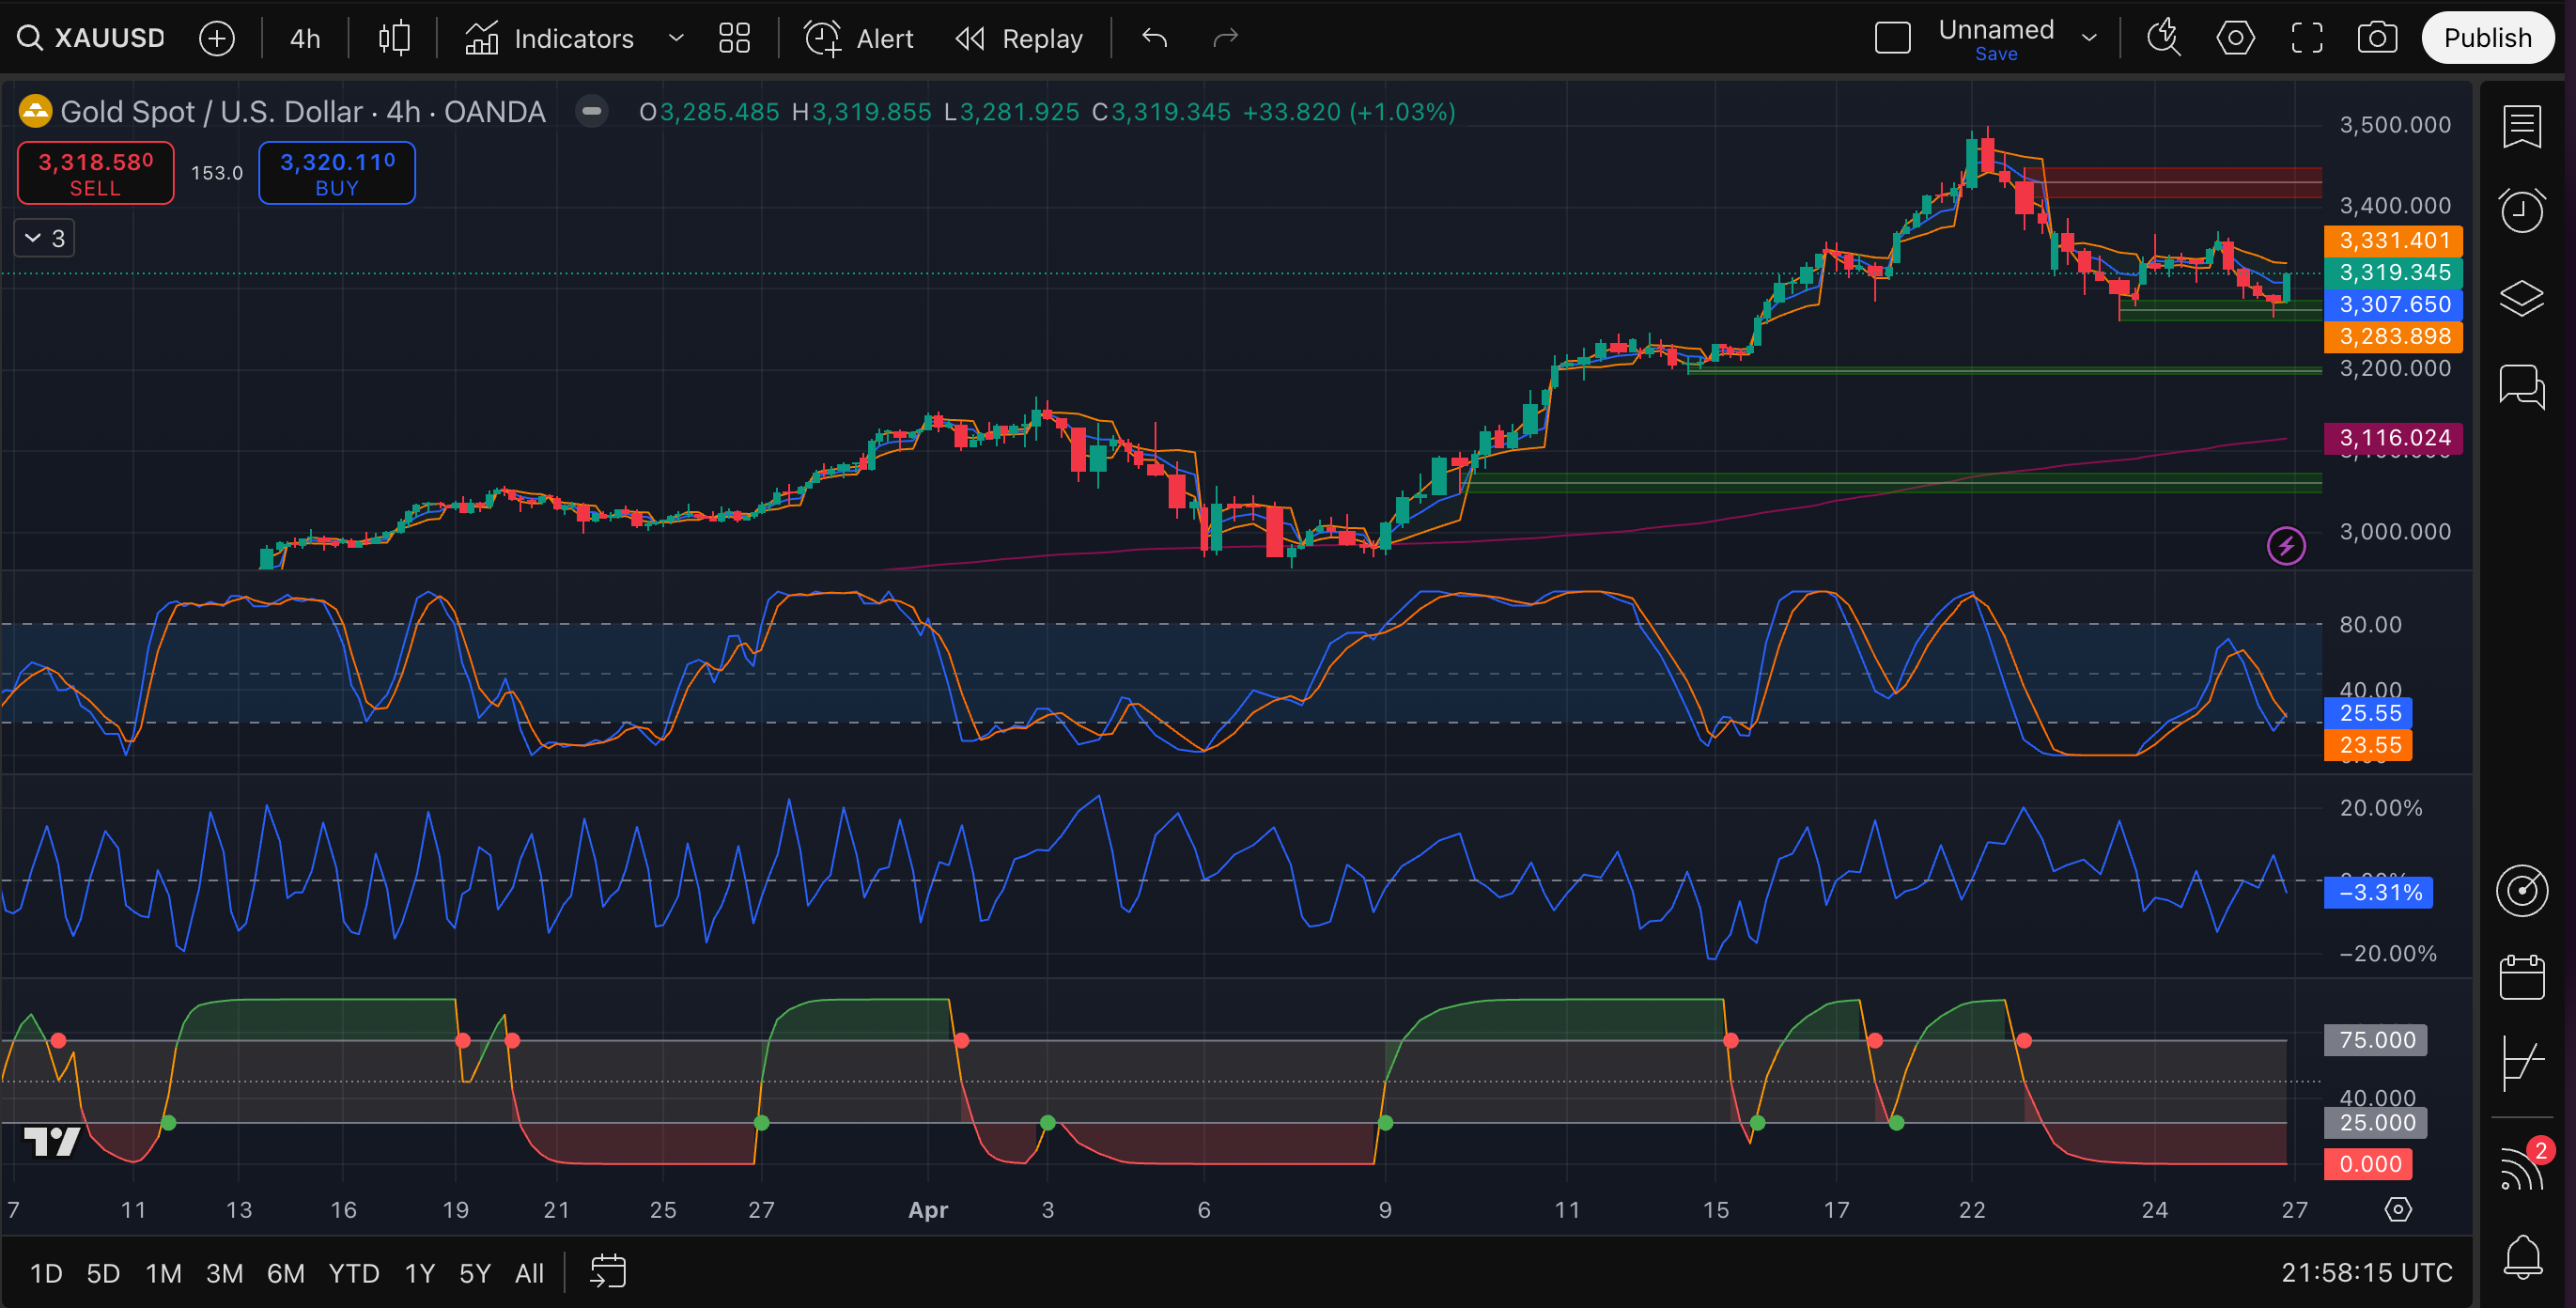
Gold Spotter leaning bearish:
Both lines hovering near 30–35 zone ➔ Historically, this signals momentum drying up and often precedes 3–5 days of downside or heavy consolidation.
Bands starting to pinch — classic decreasing volatility setup ➔ Big move likely coming soon — direction still unclear.
Hull RSI rolling over from overbought levels (~64–65) ➔ Indicates loss of upside momentum.
Massive volume cluster between $2,950–$3,050 ➔ If Gold breaks below
Keep reading with a 7-day free trial
Subscribe to The Gold Trader to keep reading this post and get 7 days of free access to the full post archives.