

Why smart money is betting big on Gold: XAU/USD technicals, fundamentals, and sentiment weekly recap + mid-term predictions
Why smart money is betting big on Gold: XAU/USD technicals, fundamentals, and sentiment weekly recap + mid-term predictions


Hello, fellow traders!
Gold started the week strong but faced mid-week challenges before surging to a new all-time high. Driven by ongoing geopolitical tensions and shifting expectations about the Federal Reserve's monetary policy, the precious metal closed on Friday with explosive upward momentum, smashing through the key psychological barrier of $2,500, and hitting a record.
This wild week shows how tough Gold can be. It also reveals how a mix of economic news, global conflicts, and what traders are thinking all work together to push Gold's price around.
In this week’s update, I’ll:
Break down the factors behind Gold's record-breaking rally through weekly price action recap.
Examine the technical indicators pointing to potential future price movements.
Highlight crucial support and resistance levels.
Analyze key economic data from the US, UK, Germany, and China and how it might affect XAU/USD.
Dive into the latest market sentiment as to the COT report and what it means for Gold's outlook.
Share my mid-term predictions and speculations for XAU/USD.
⚡ Gold hits record high at $2,508 on Friday
Gold started the week strong, fueled by a drop in U.S. Treasury yields and ongoing tensions between Iran and Israel, pushing prices up to $2,470 by the end of the day.
On Tuesday, the price took a breather, consolidating and moving sideways within a range of roughly $2,460 to $2,470.
Wednesday's Consumer Price Index data, which matched expectations, dampened hopes for a larger interest rate cut by the Federal Reserve. This caused XAU/USD to dip, briefly testing support below $2,450 before quickly rebounding.
On Thursday, Gold prices fell further after an unexpectedly strong U.S. retail sales report boosted the U.S. dollar and Treasury yields.
Despite the mid-week pullback, XAU/USD closed the trading week with explosive upward momentum. It broke through several resistance levels, including $2,470, $2,480, and the key psychological level of $2,500. The price ended the session at $2,508, setting a new record high.
📊 Let’s look at the technical data
Last 6 months
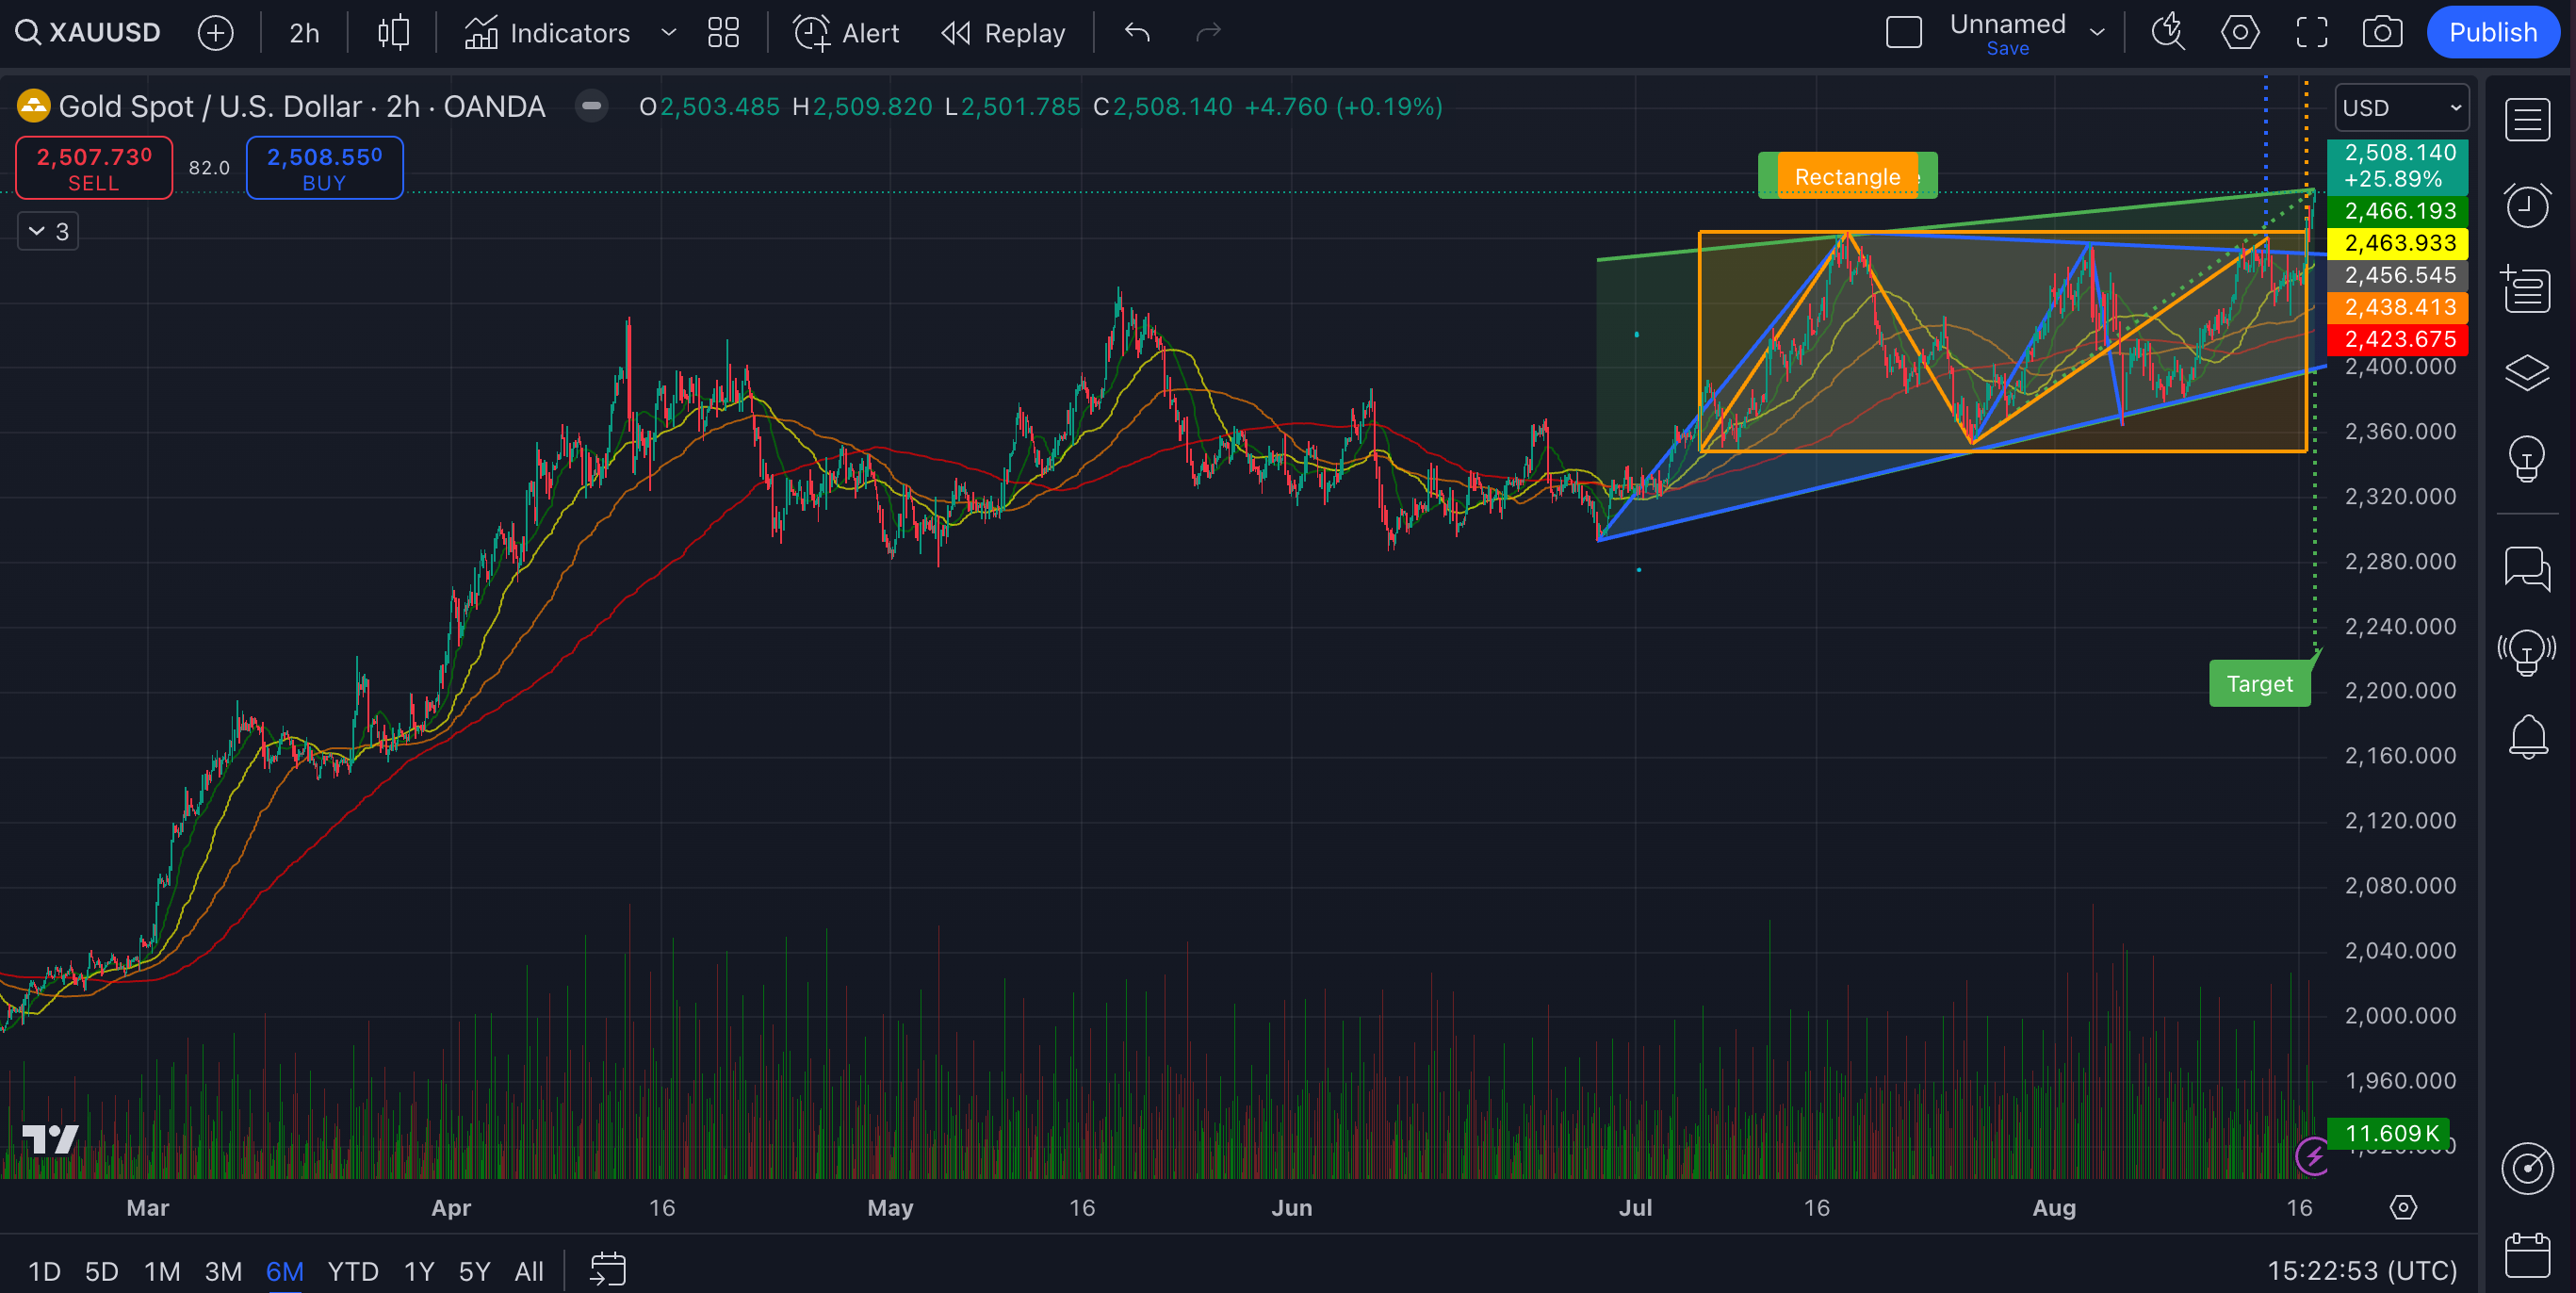
The first thing that catches my eye in these 2-h charts is the overall uptrend since June. We've seen the price climb from around $2,280 to the current level of $2,508. That's a pretty solid gain of about 10% in just a couple of months.
Gold has been hitting higher lows and higher highs, which is typically a bullish sign. The price seems to be respecting an upward trendline, bouncing off it several times. This suggests there's good support for Gold at these levels specifically at $2,320, $2,360 and $2,400.
There’s a clear ascending channel pattern forming since late June. This channel is bounded by two parallel upward-sloping lines. The lower line connects the lows, acting as support, while the upper line connects the highs, serving as resistance.
Within this larger pattern, there’s a series of smaller ascending triangles. These are typically continuation patterns, suggesting the upward trend is likely to persist. The most recent triangle seems to have just broken out to the upside, which could indicate we're at the start of another leg up.
Looking at the moving averages (SMAs), we've got the 20-day SMA (green line) above the 50-day (blue), 100-day (orange), and 200-day (red) SMAs. This "golden cross" formation is often seen as a bullish indicator, suggesting the short-term trend is stronger than the long-term trend.
The RSI is currently in overbought territory. This might suggest a short-term pullback could be coming soon. However, in strong trends, the RSI can remain overbought for extended periods.
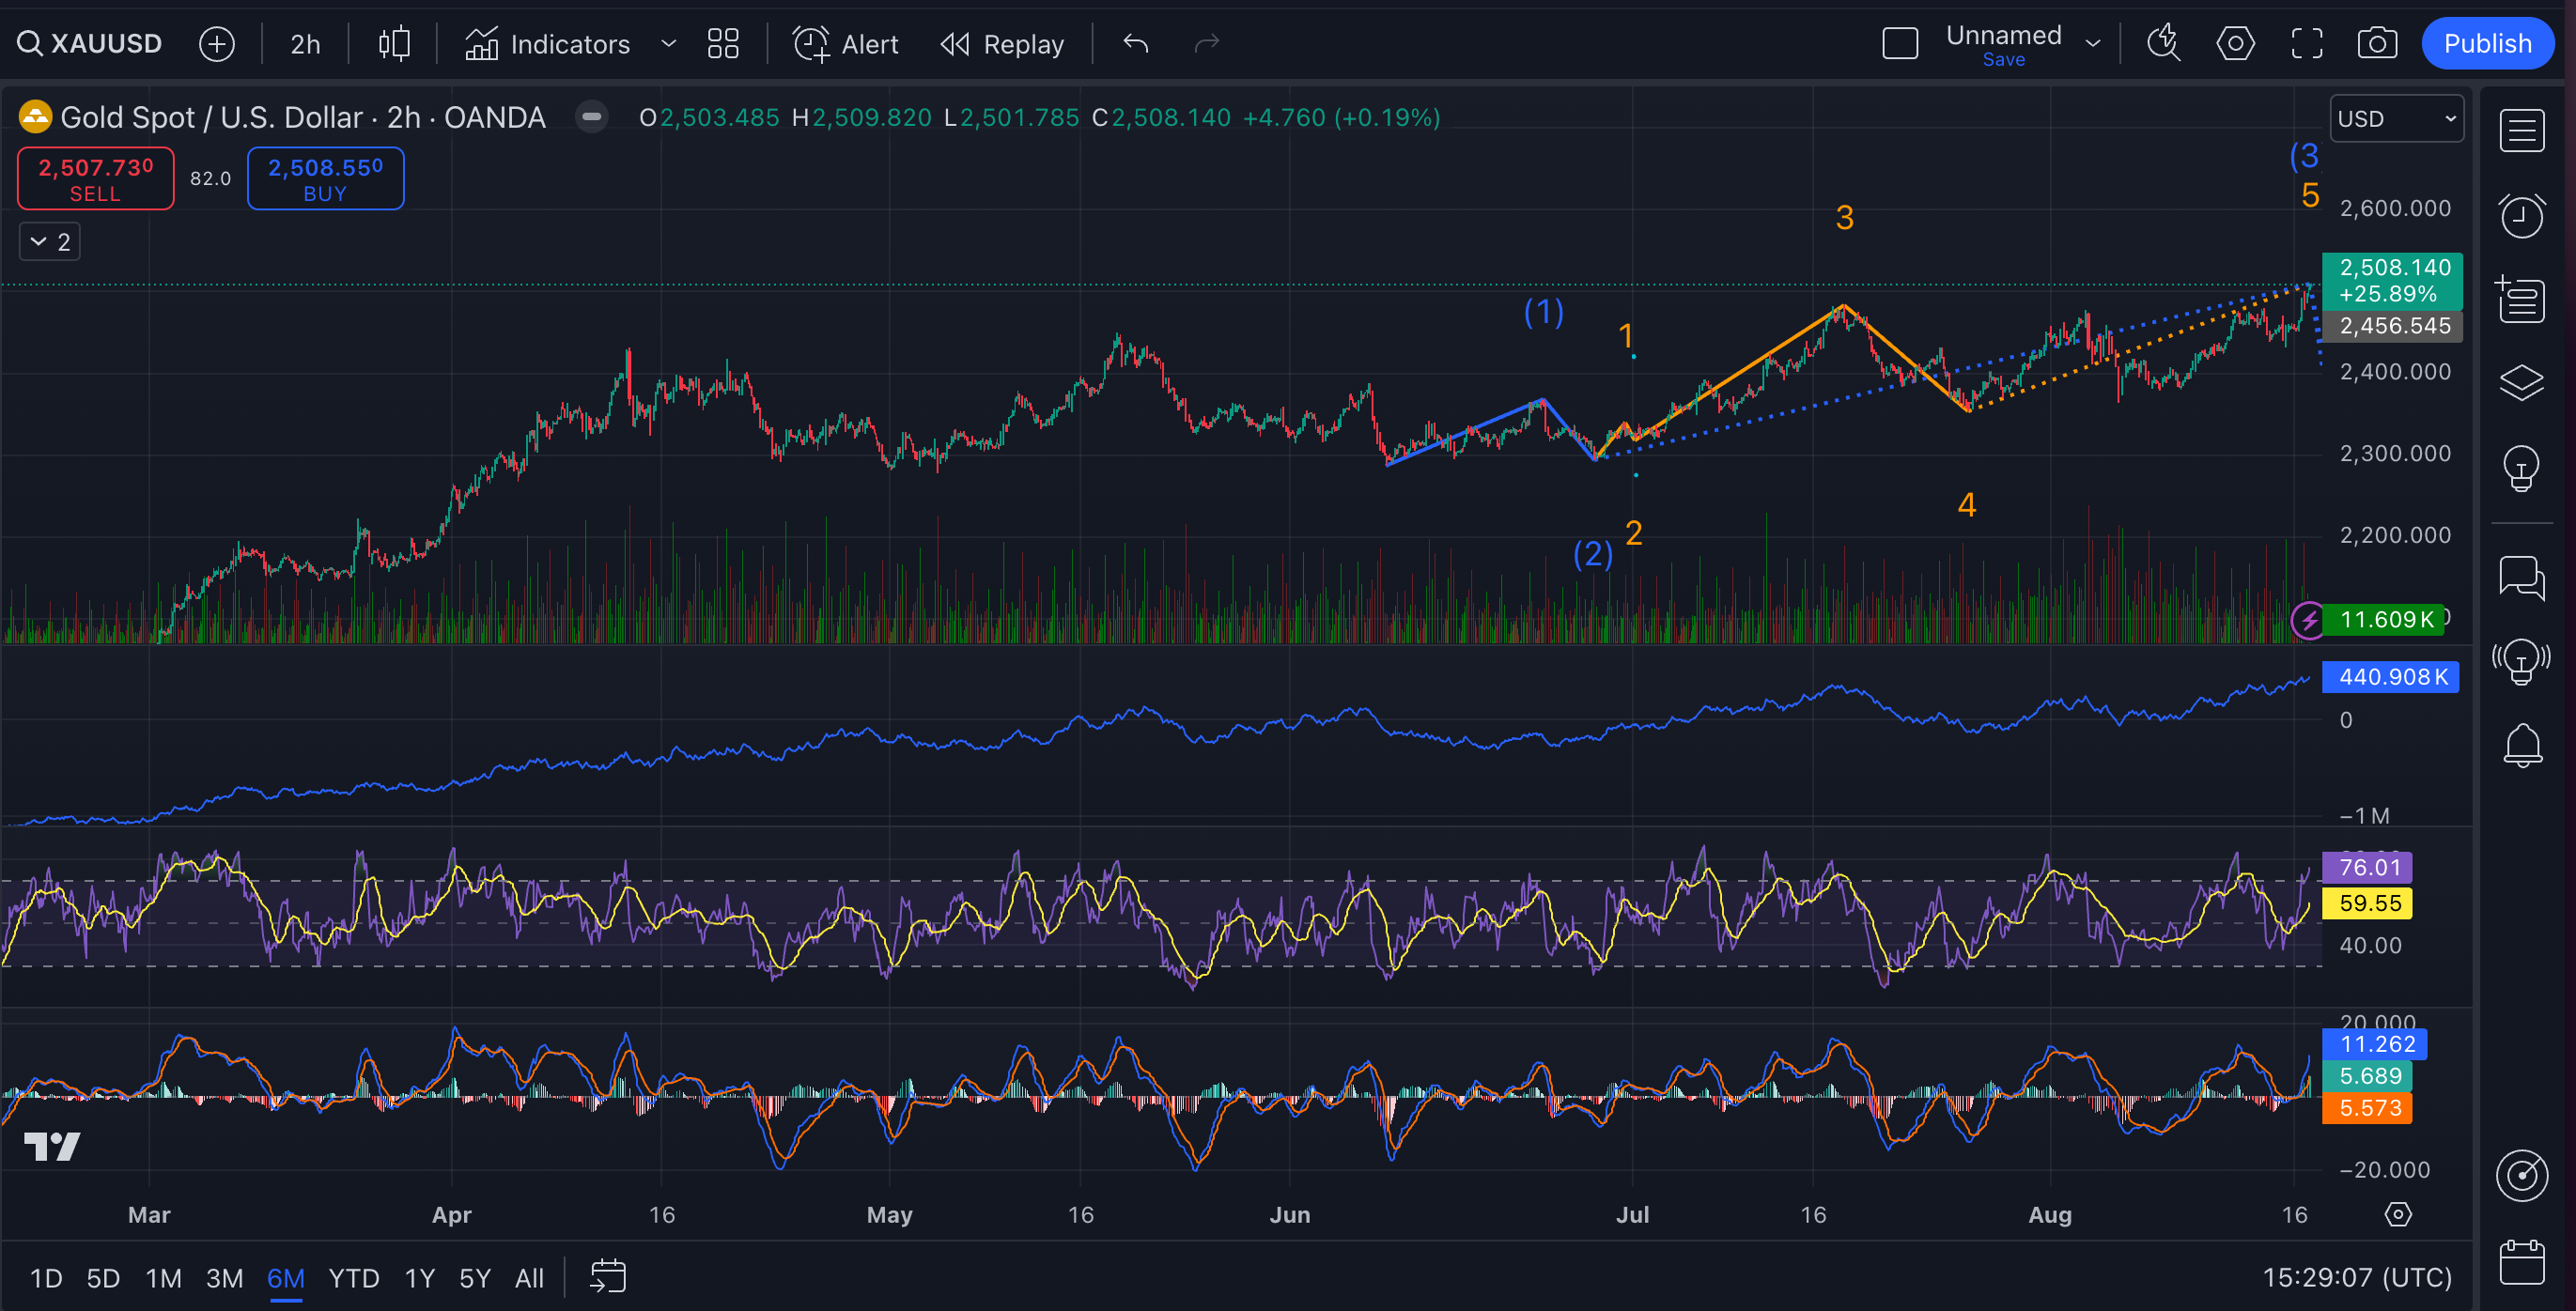
The MACD is showing a positive trend, with the blue line above the orange signal line. This supports the bullish view, indicating upward momentum.
The OBV has been steadily increasing, which is a good sign. It means buying volume is outpacing selling volume, supporting the price rise.
The Elliott Wave analysis shows Gold might be in the fifth wave of an upward movement. Typically, the fifth wave reaches a level equal to the distance traveled in waves 1 through 3, projected from the end of wave 4. Measuring from the start of wave 1 (around $2,280) to the peak of wave 3 (about $2,480), we get a distance of roughly $200. If we project this $200 from the end of wave 4 (approximately $2,420), we could see Gold potentially reaching around $2,620.
Given the strength of the current trend and these patterns, I wouldn't be surprised to see Gold testing the $2,550 level in the near term. If the momentum continues and the Elliott Wave projection plays out fully, we could even see it push towards $2,600 or $2,620.
We might see some short-term volatility or a pullback due to the overbought RSI, but the overall trend seems strong.

Last 90 days
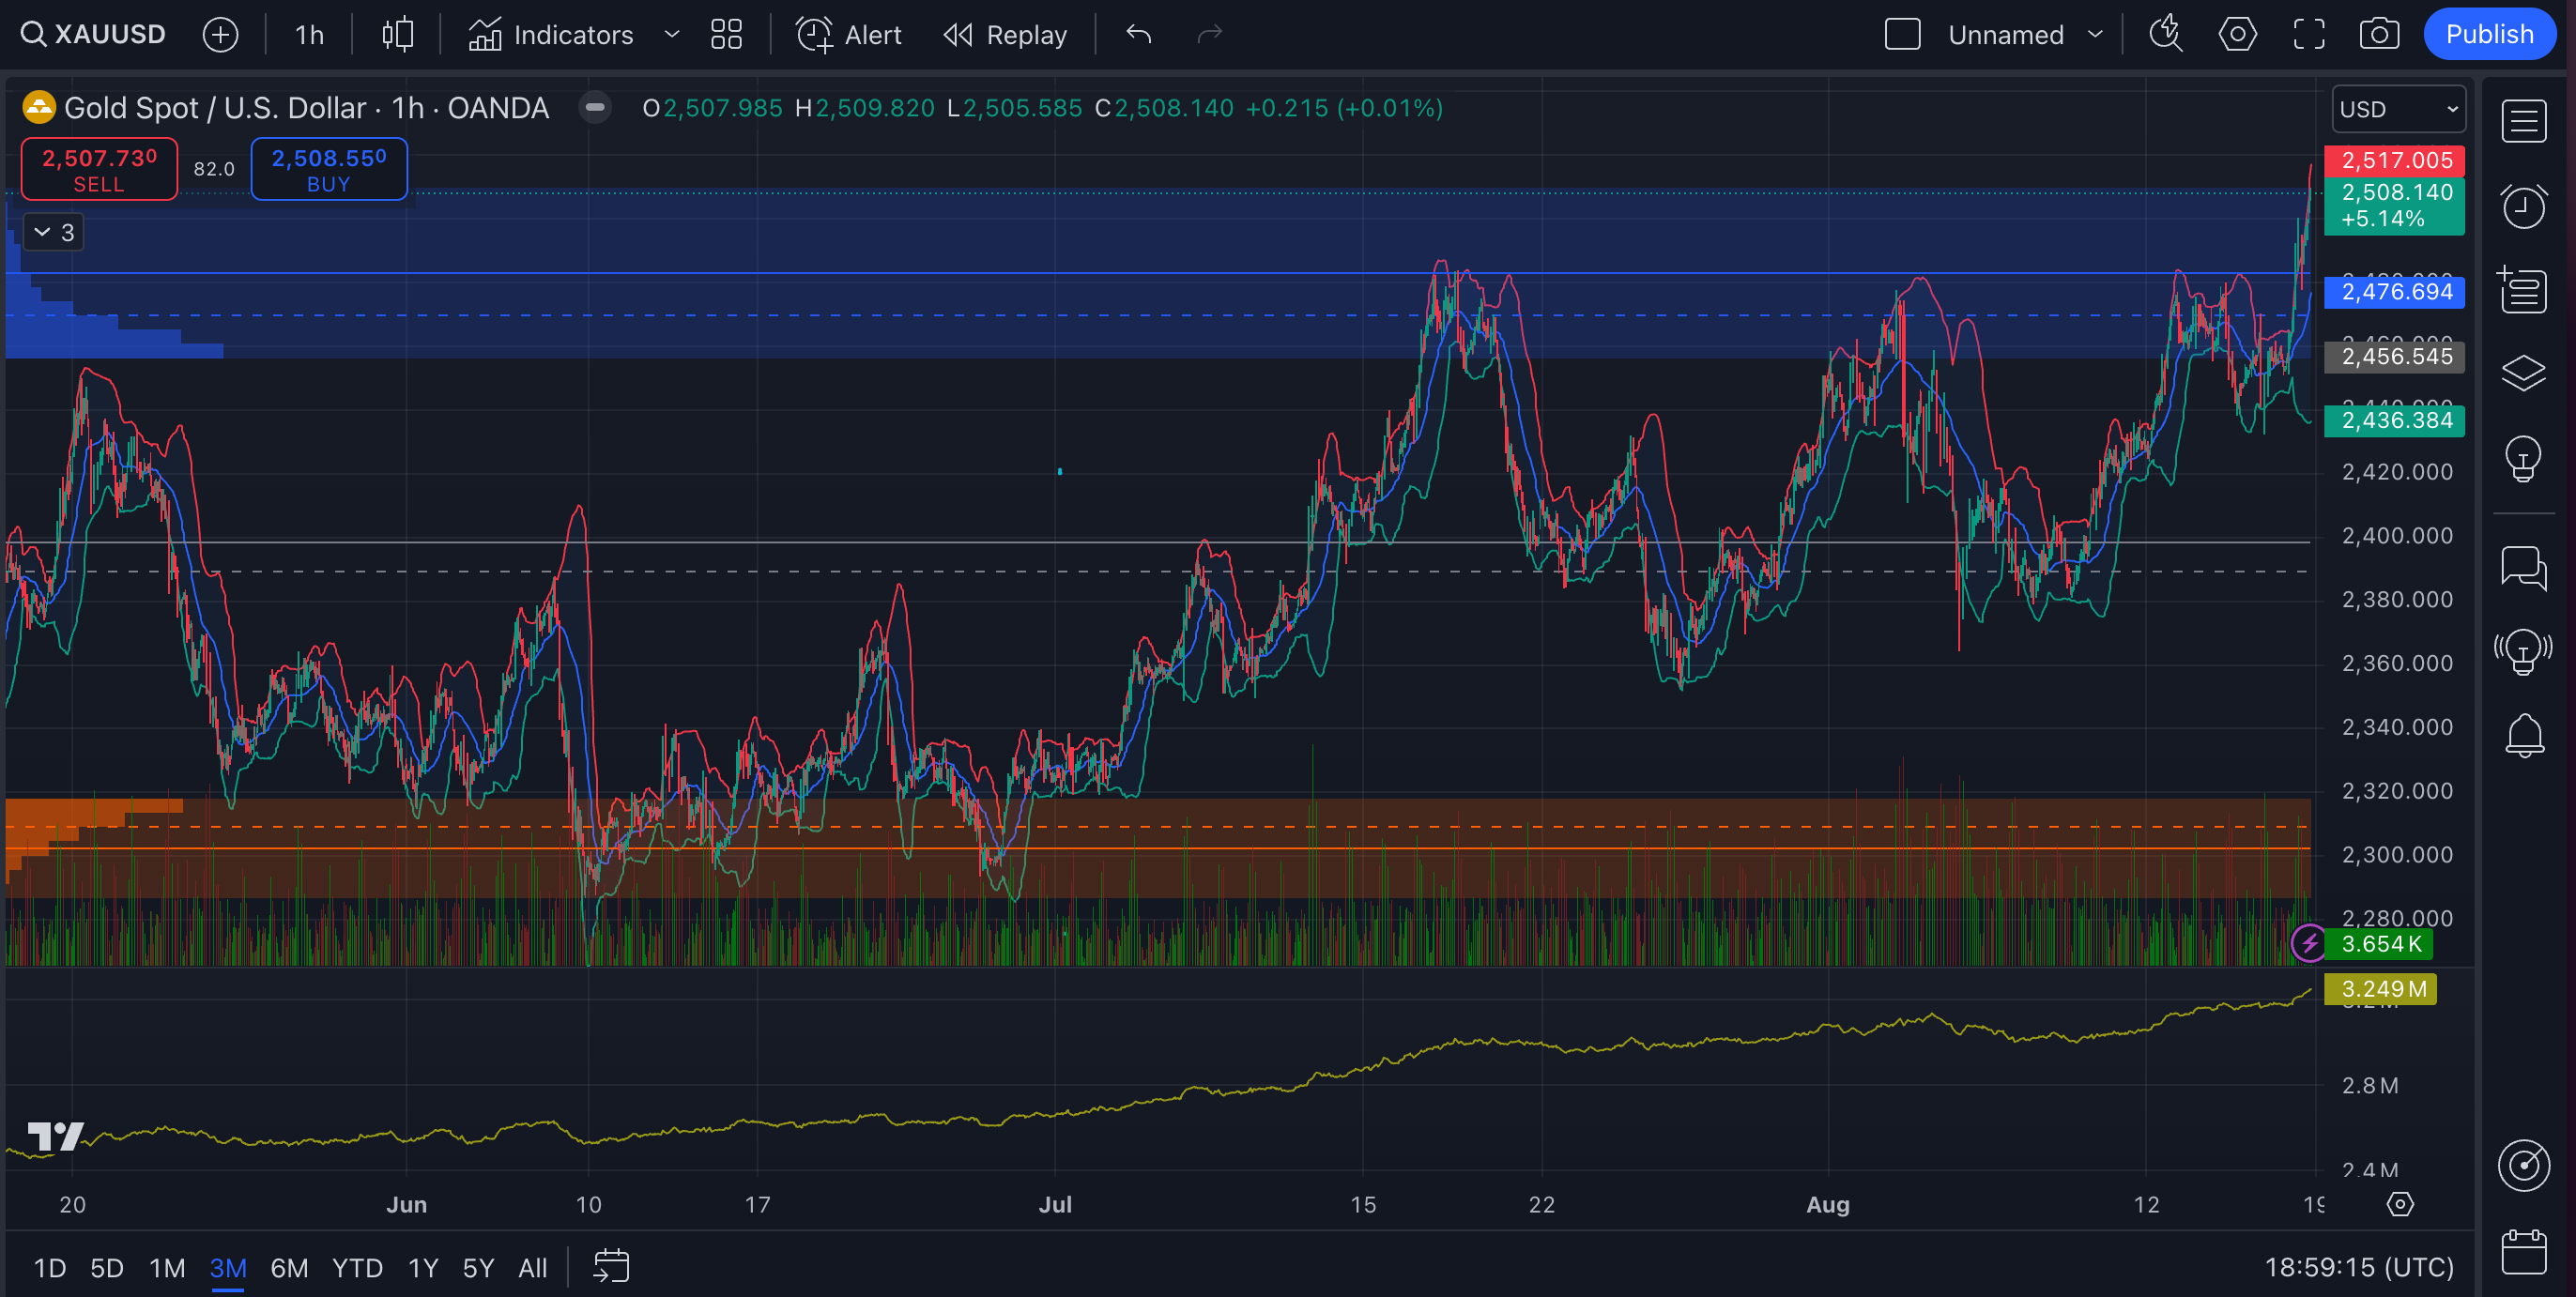
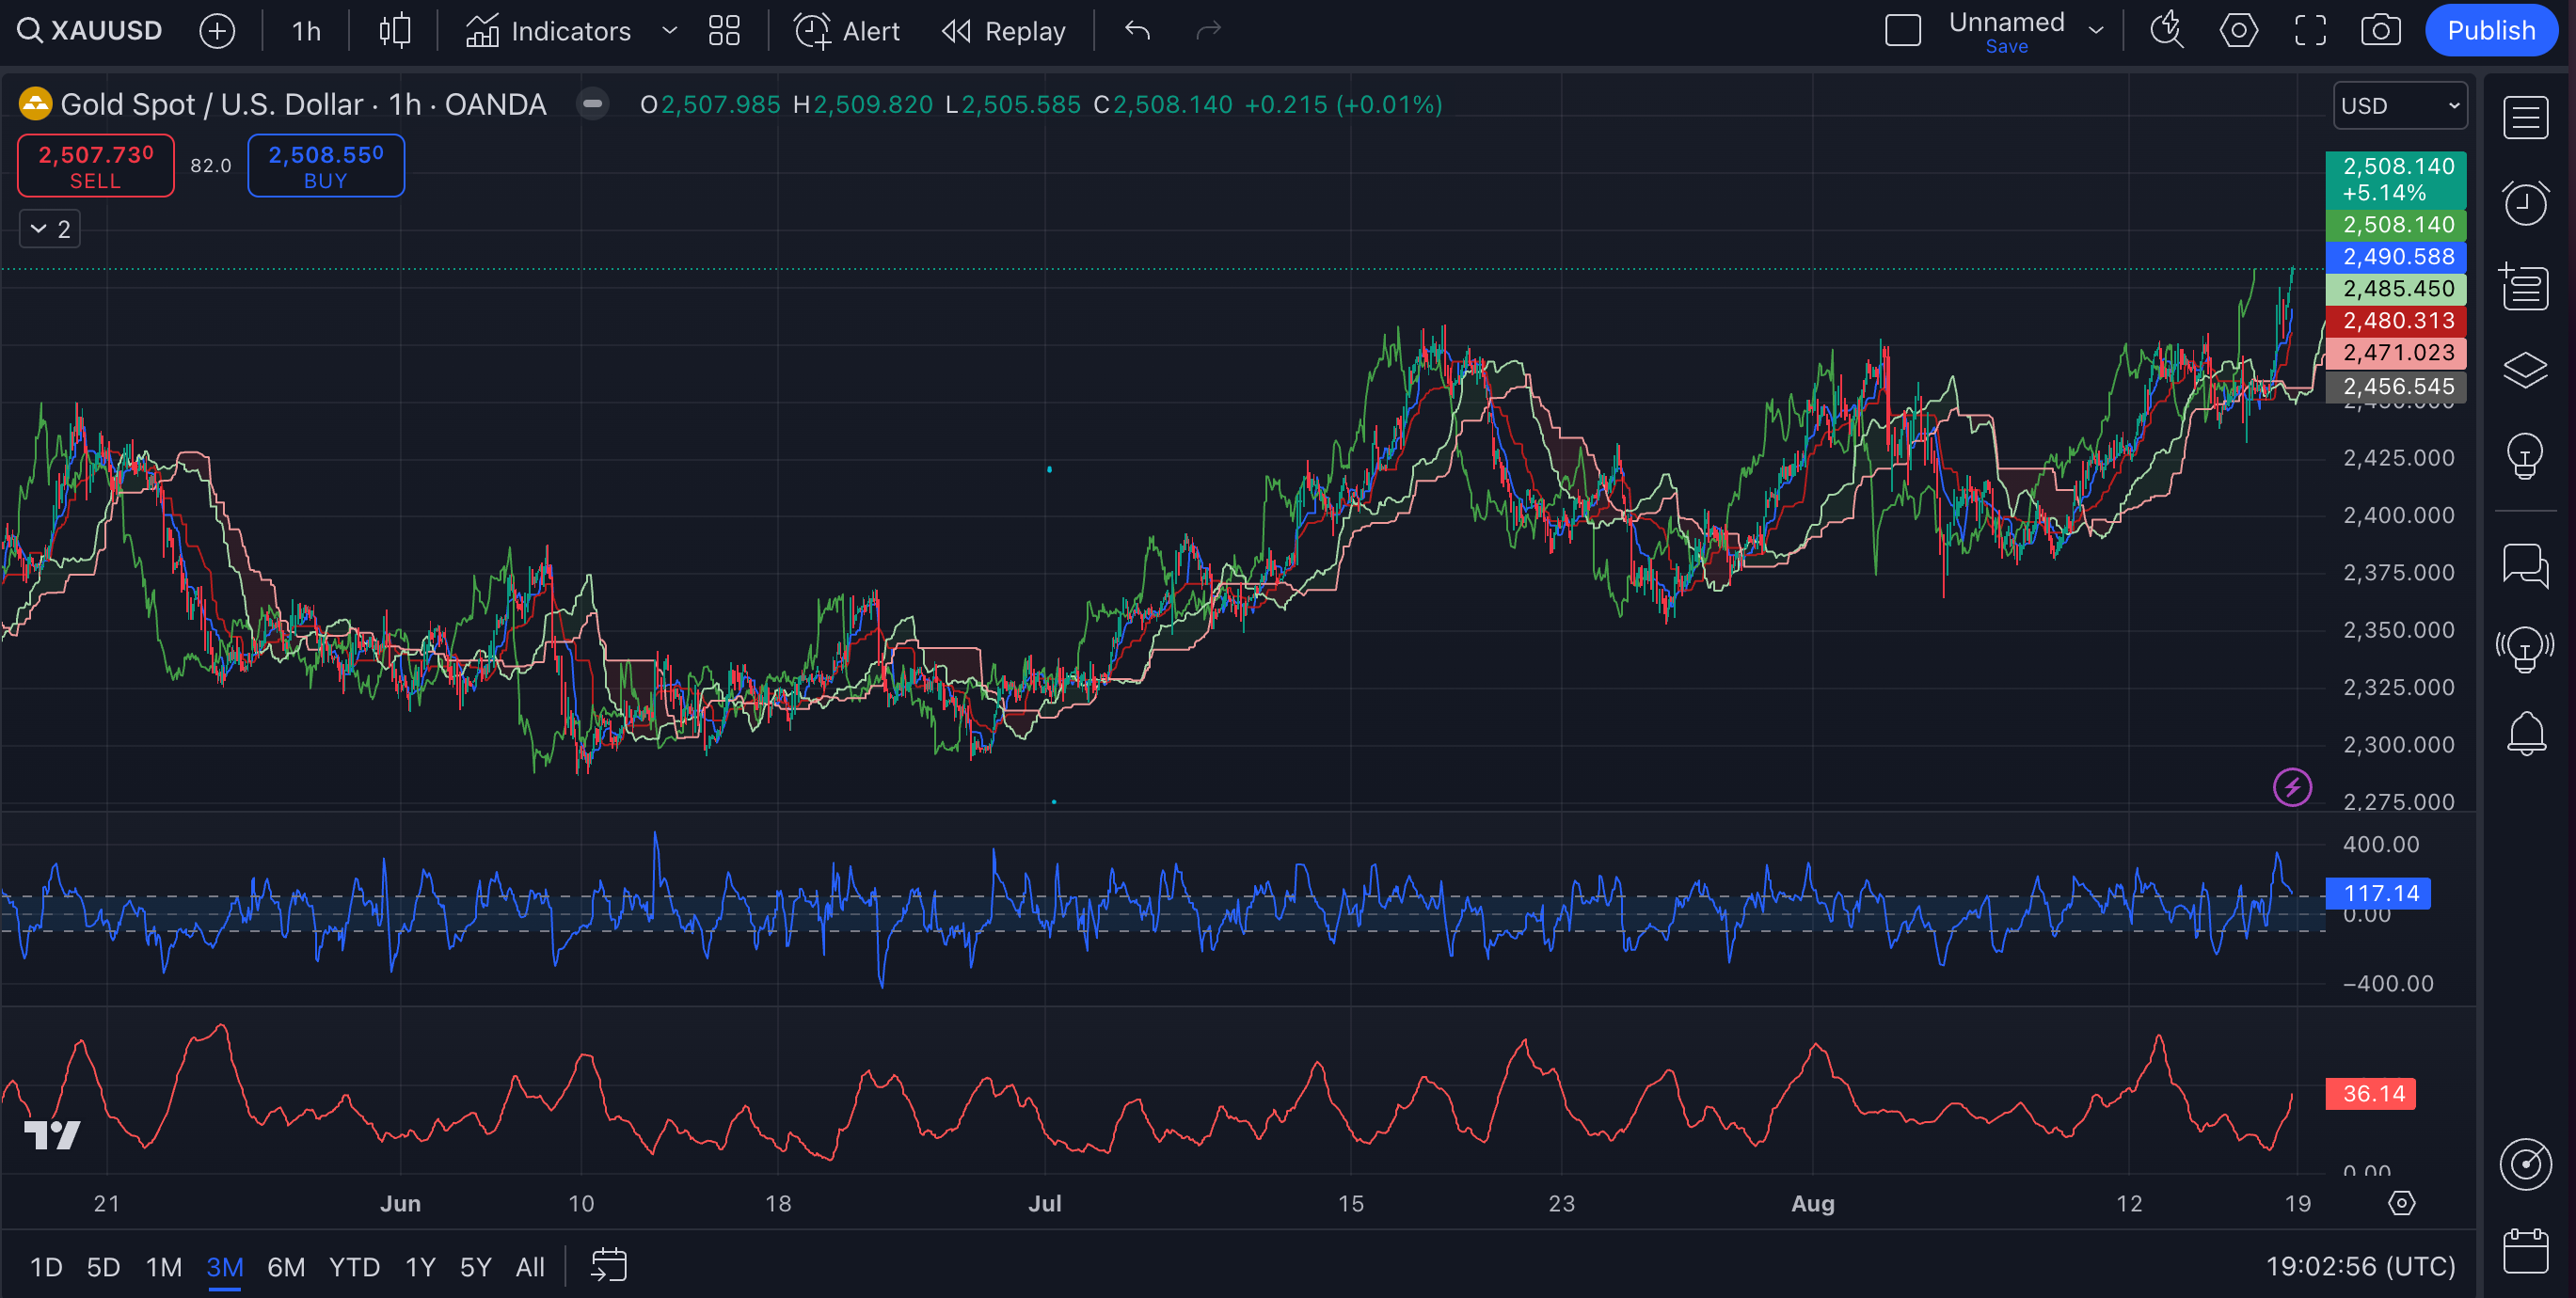
Looking at the 1-hour charts, we see
Keep reading with a 7-day free trial
Subscribe to The Gold Trader to keep reading this post and get 7 days of free access to the full post archives.