


Traders Take Profits as Gold Retreats – Is This a Buying Opportunity? [Weekly XAU/USD Analysis + Forecast]


Hello, fellow traders!
Gold hit a record high above $2,950 early in the week but couldn’t hold its gains, snapping an eight-week winning streak. Trump’s confirmation of tariffs on Canada, Mexico, and China triggered heavy selling, pushing prices below $2,850. Friday’s PCE inflation data didn’t move the market much, leaving Gold struggling to recover.
In this week’s update, I’ll:
Decode the technicals: pinpoint the hidden technical clues that could signal a sudden breakout—or a ruthless selloff.
Unpack the global data: highlight the global economic numbers making waves and where they could push Gold’s price in the mid term.
Identify strategic “make-or-break” price zones.
Spot the sentiment shifts: what’s brewing beneath the surface and why this matters for Gold’s future direction.
Predict what’s next for Gold + trading setups: give away my short-term and mid-term calls for where XAU/USD is headed and offer several trading setups in the current market.


📊 Let’s look at the technical data
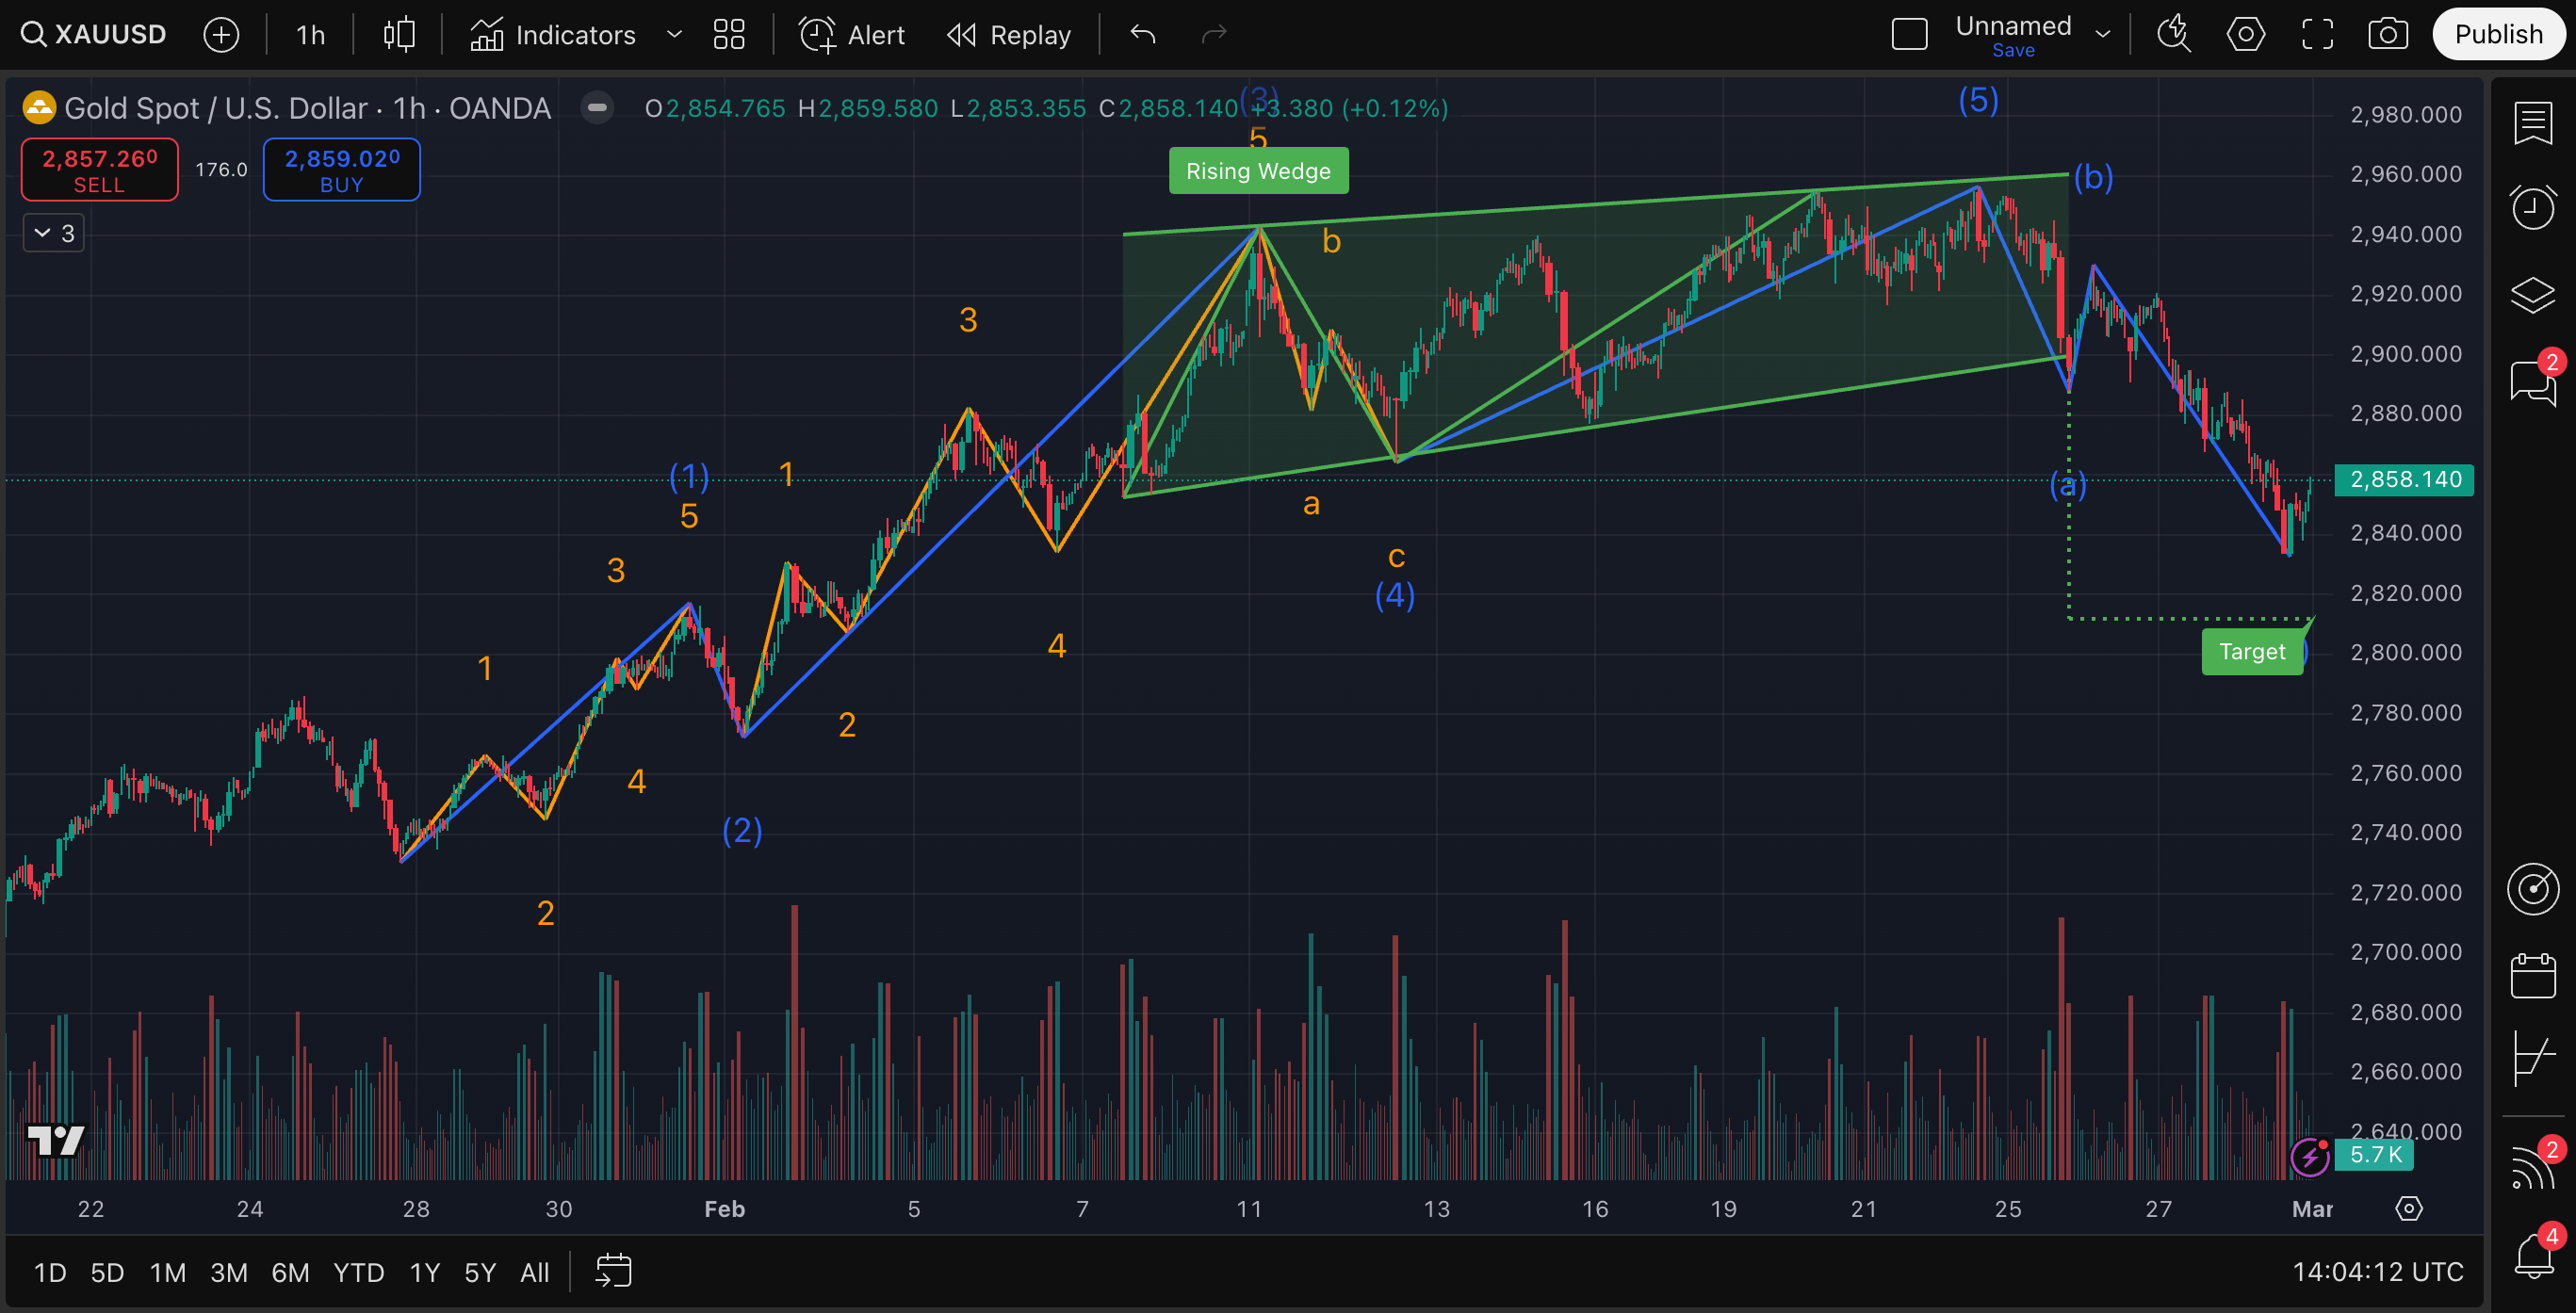
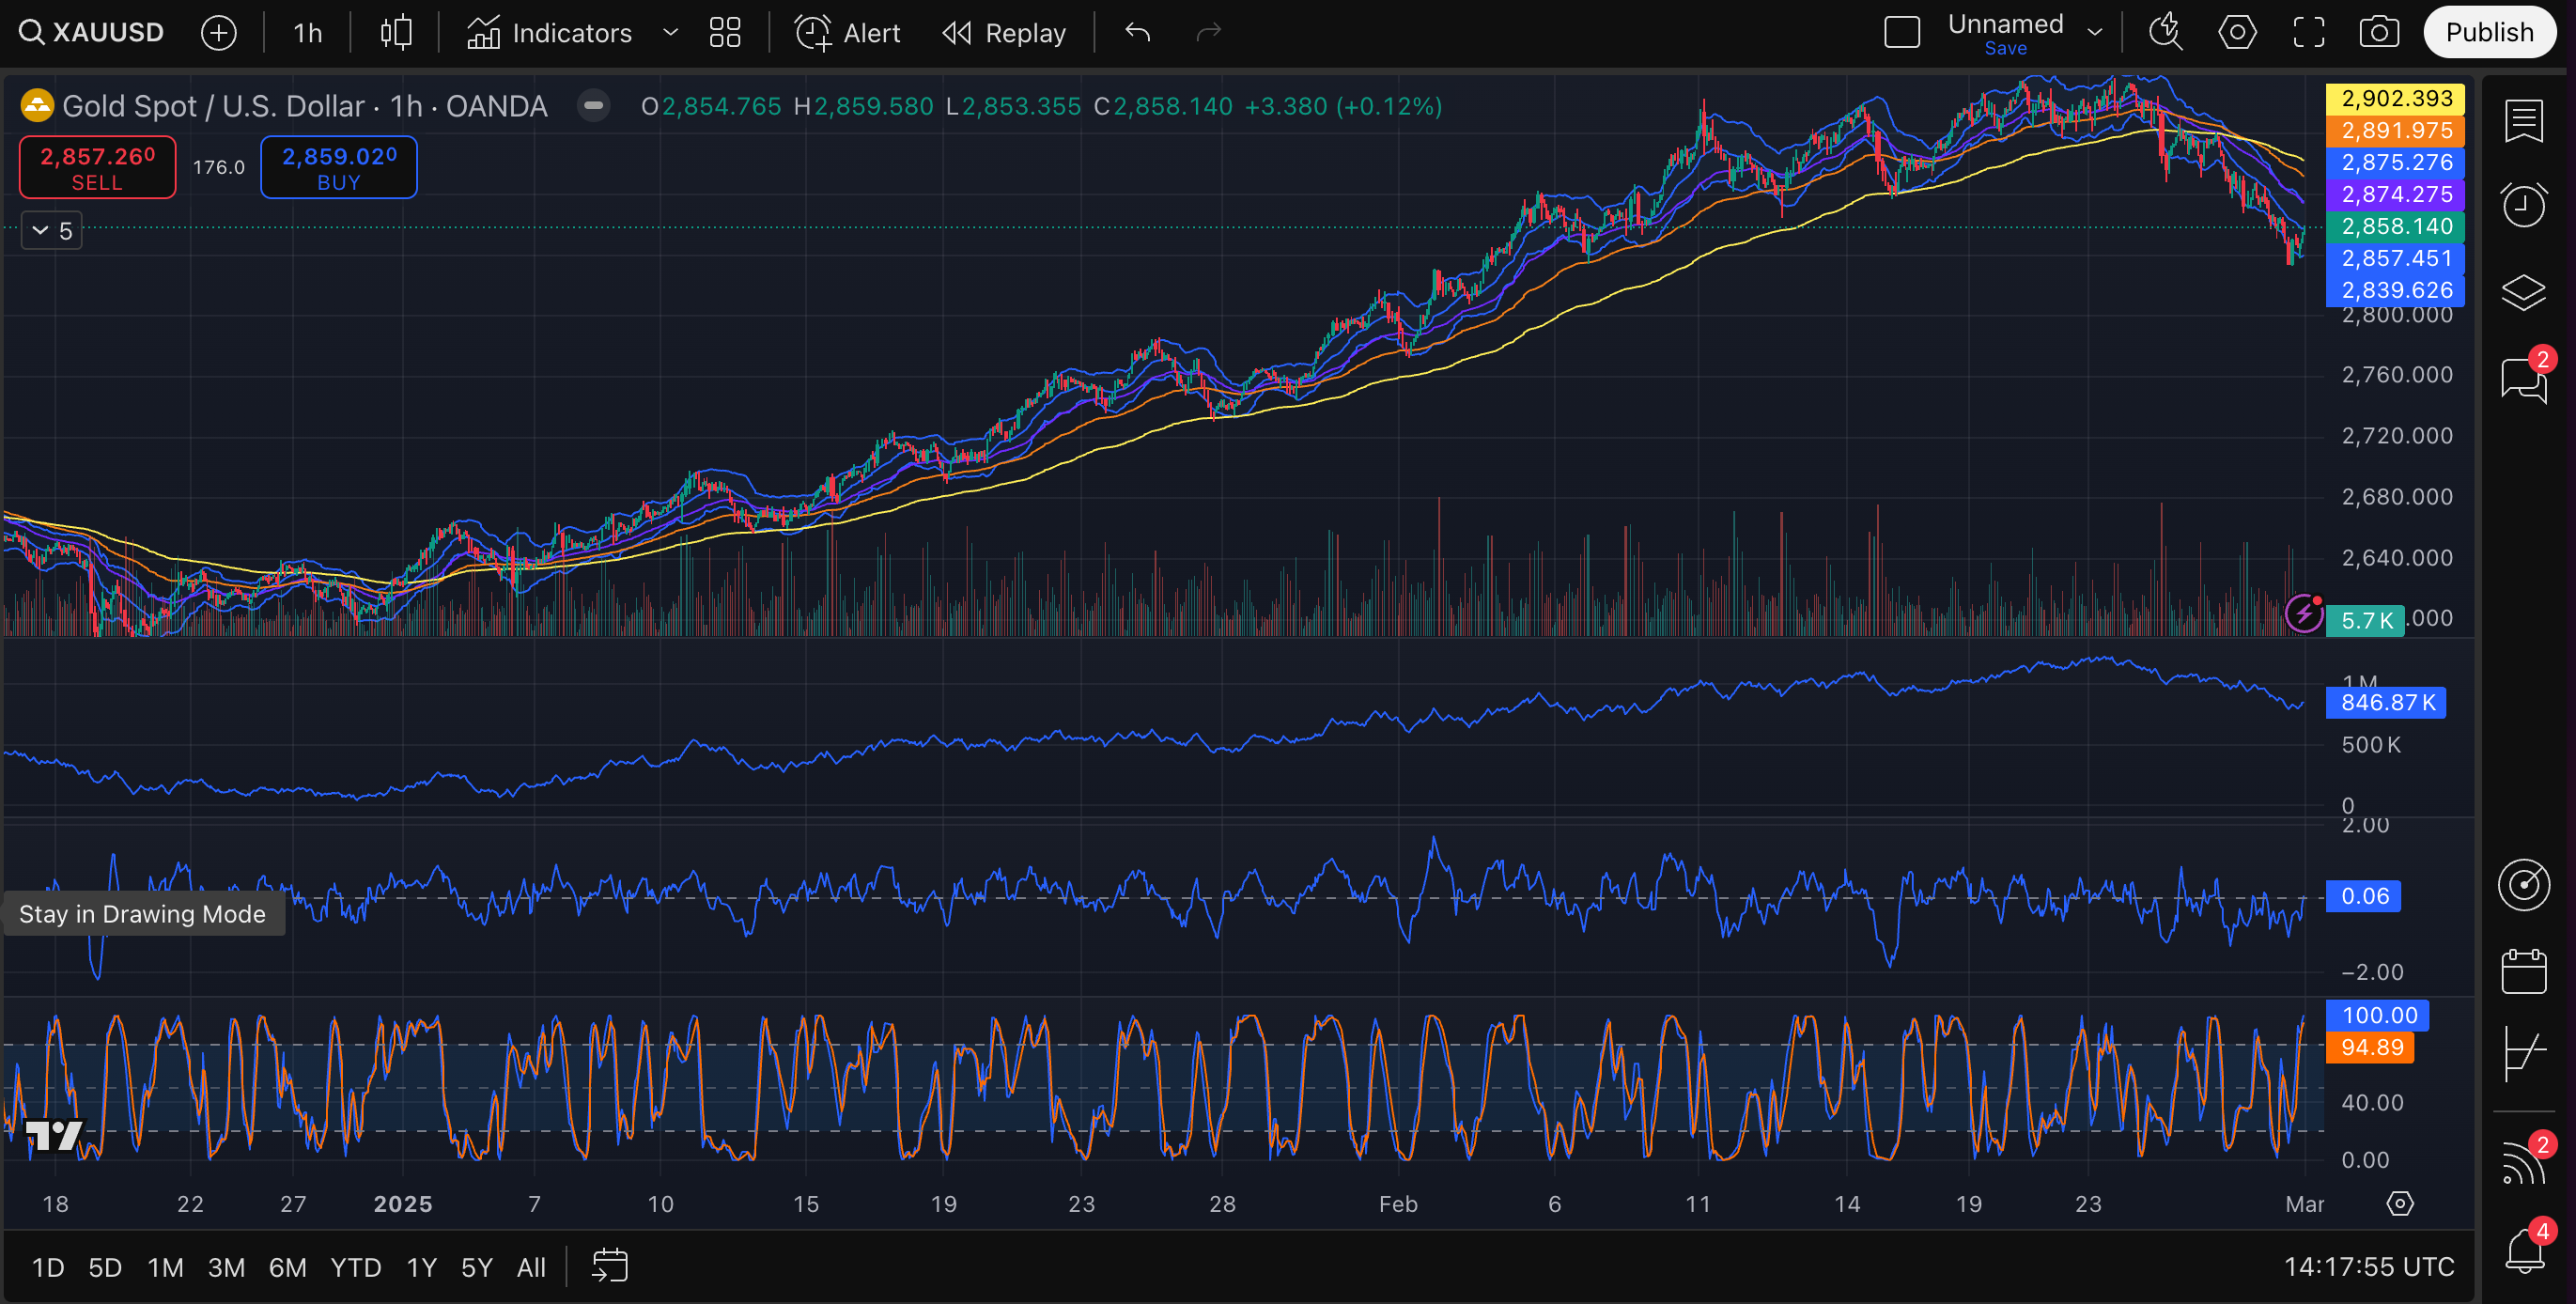
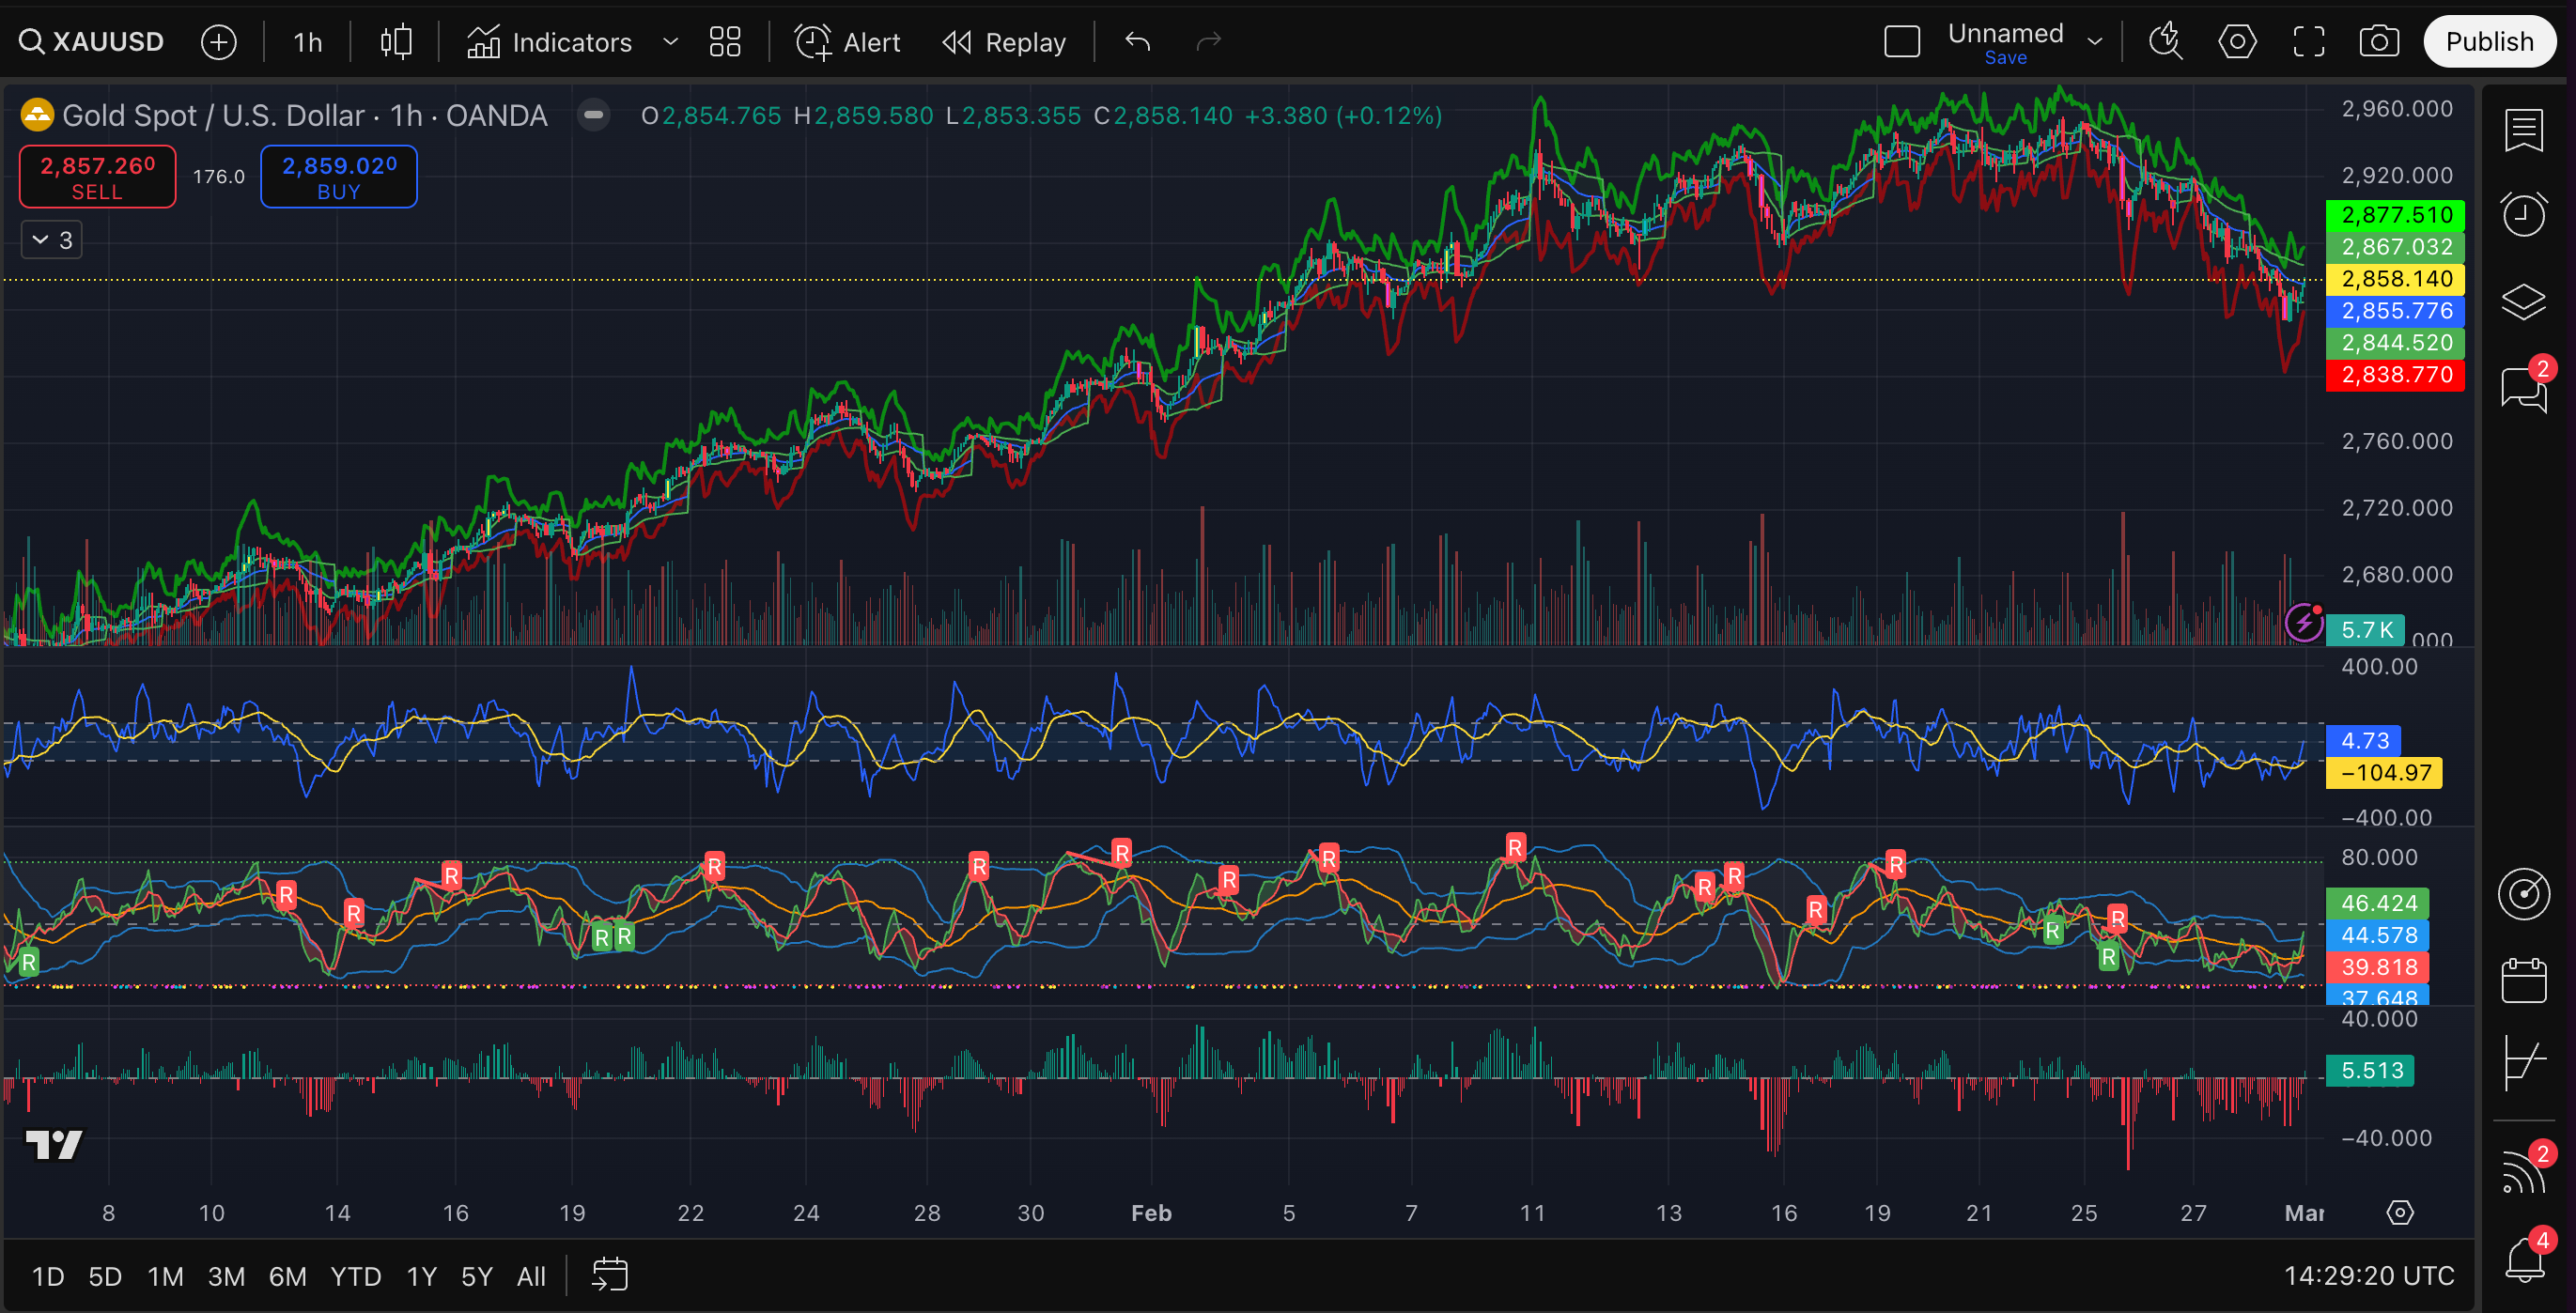
1h charts
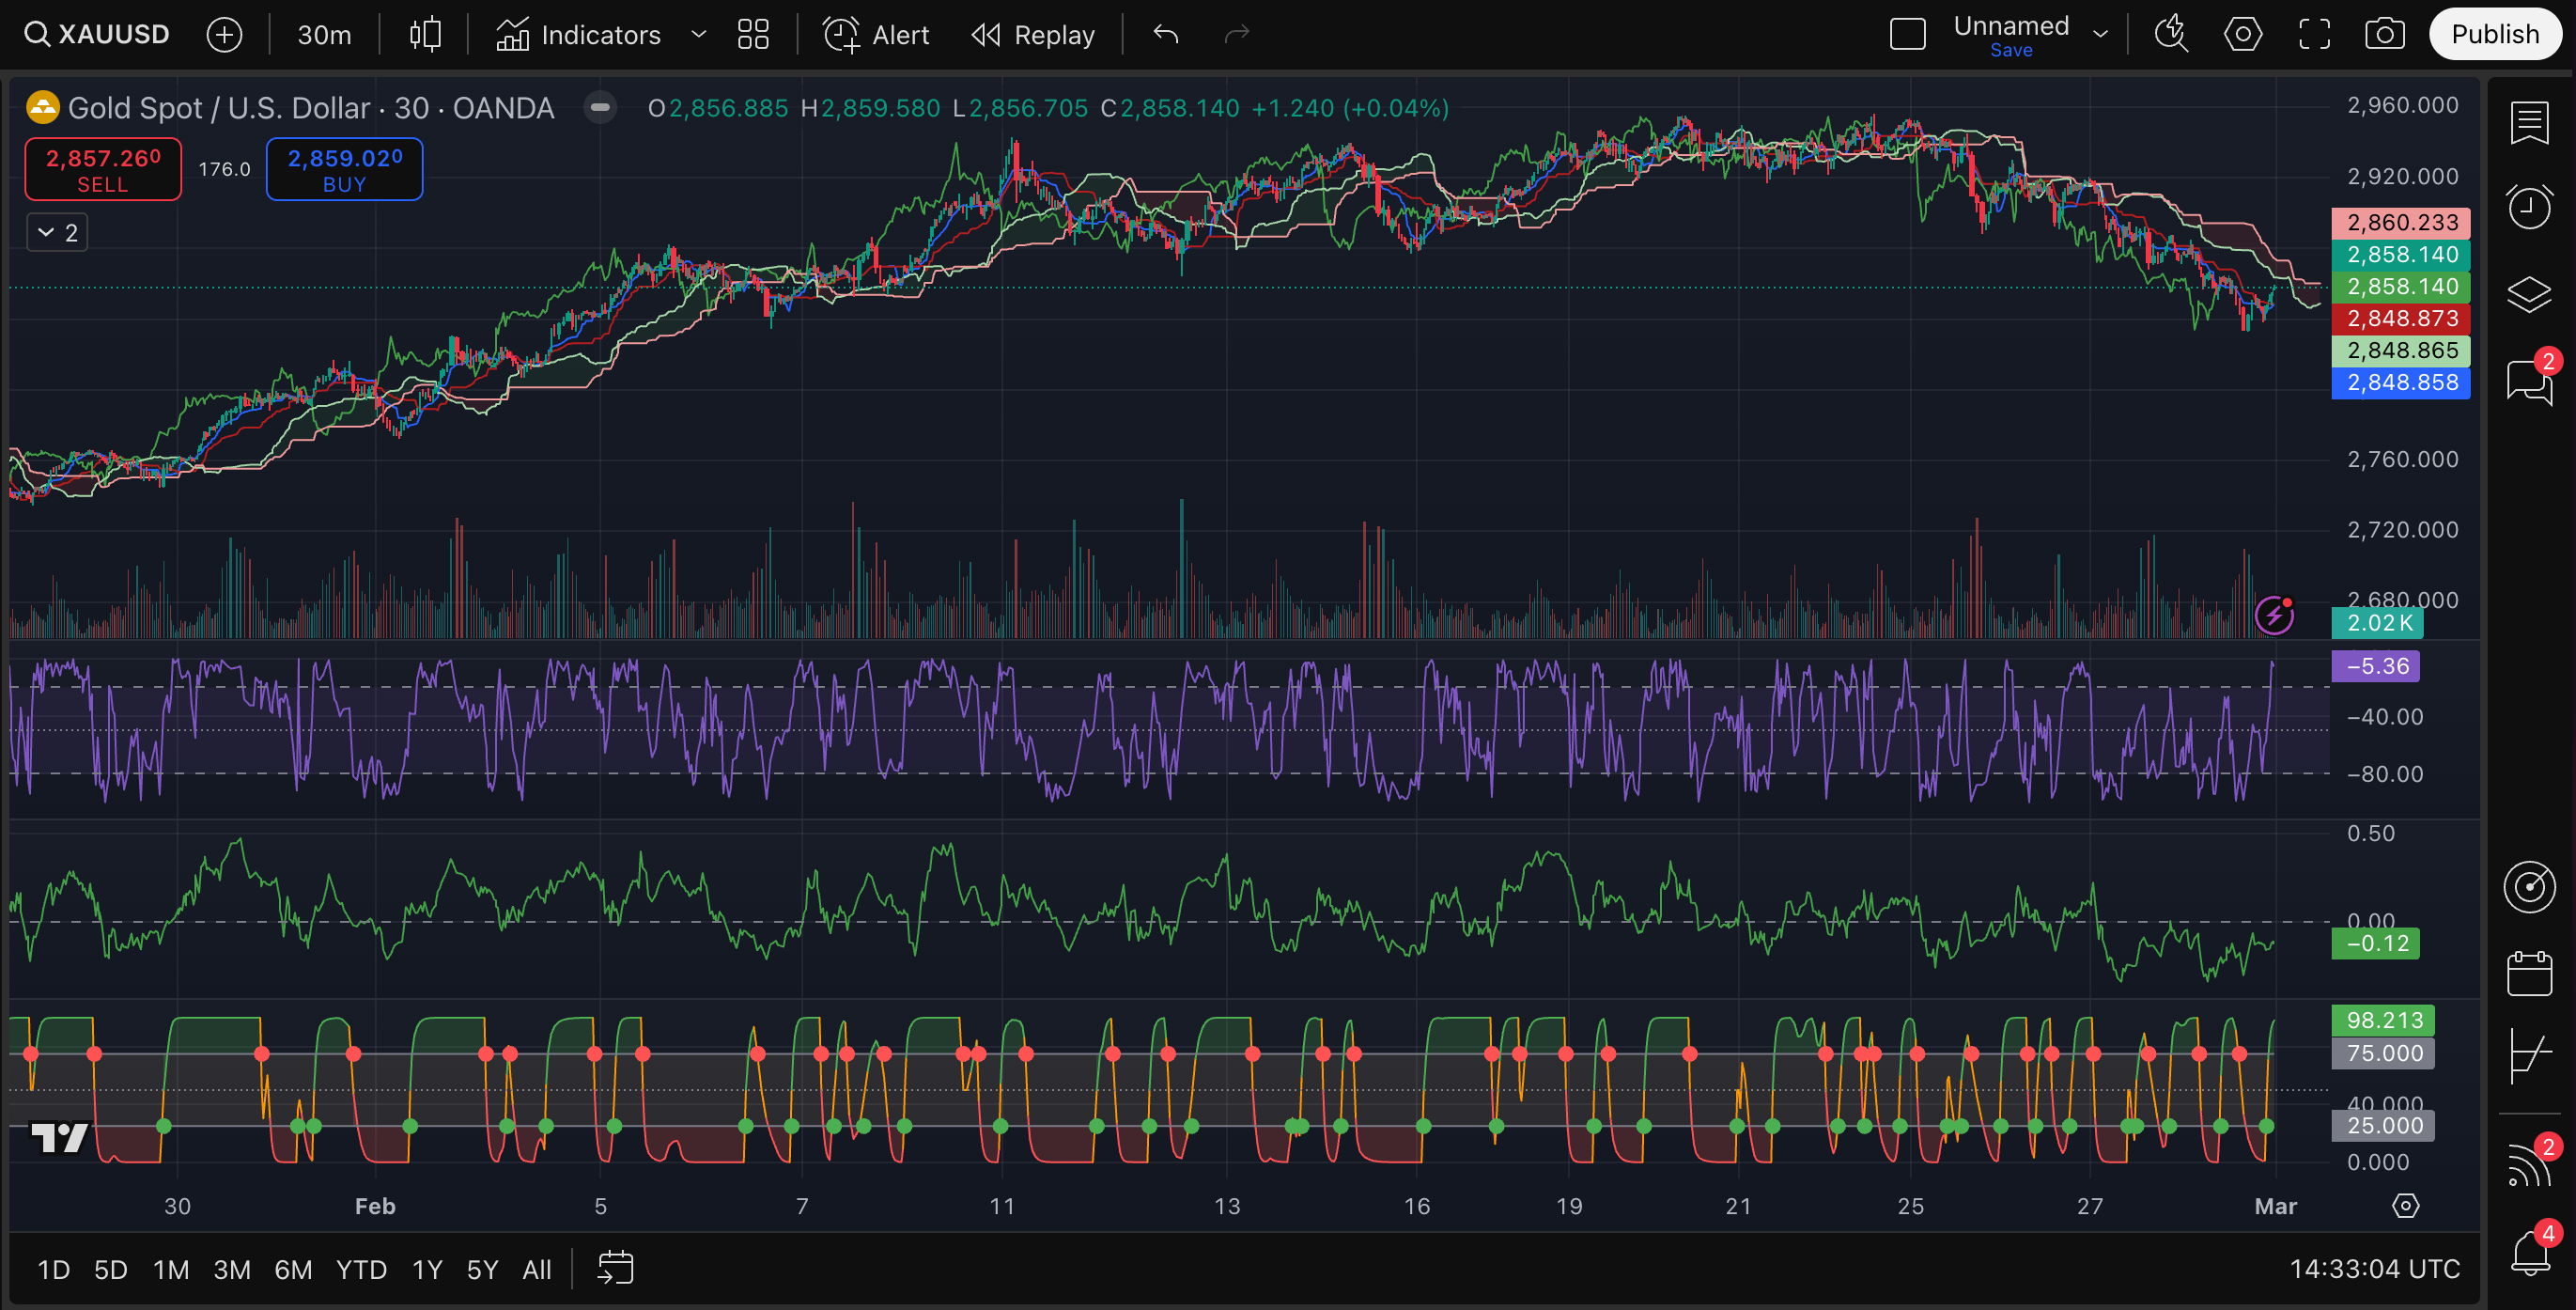
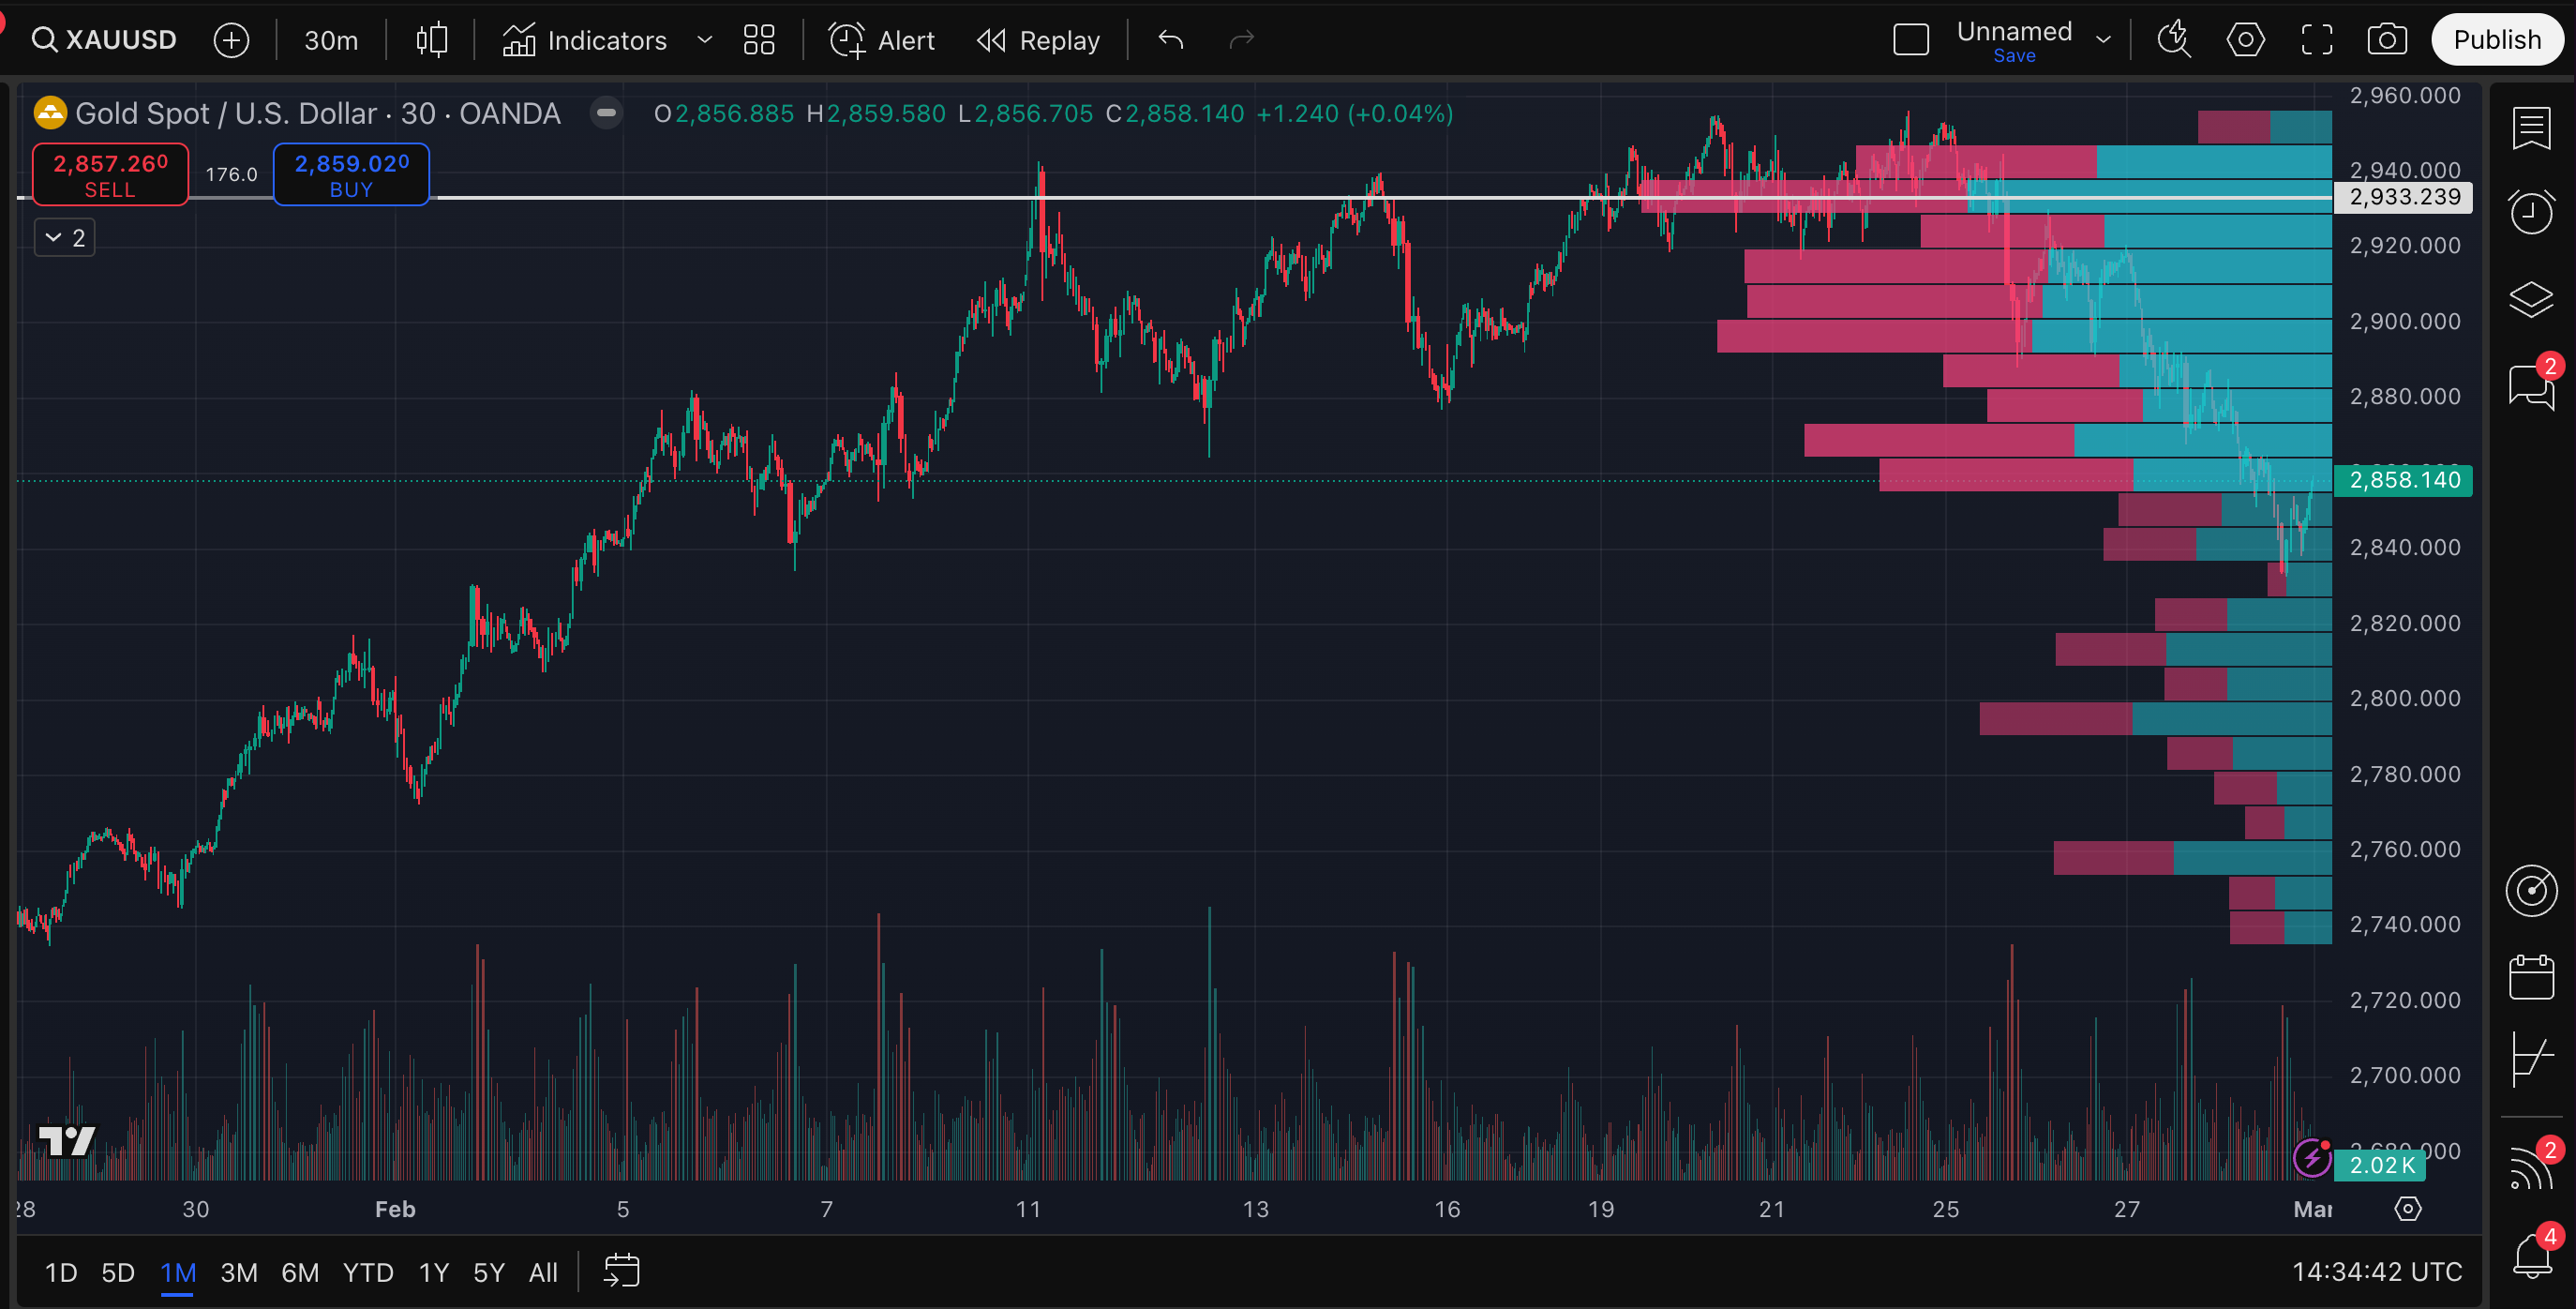
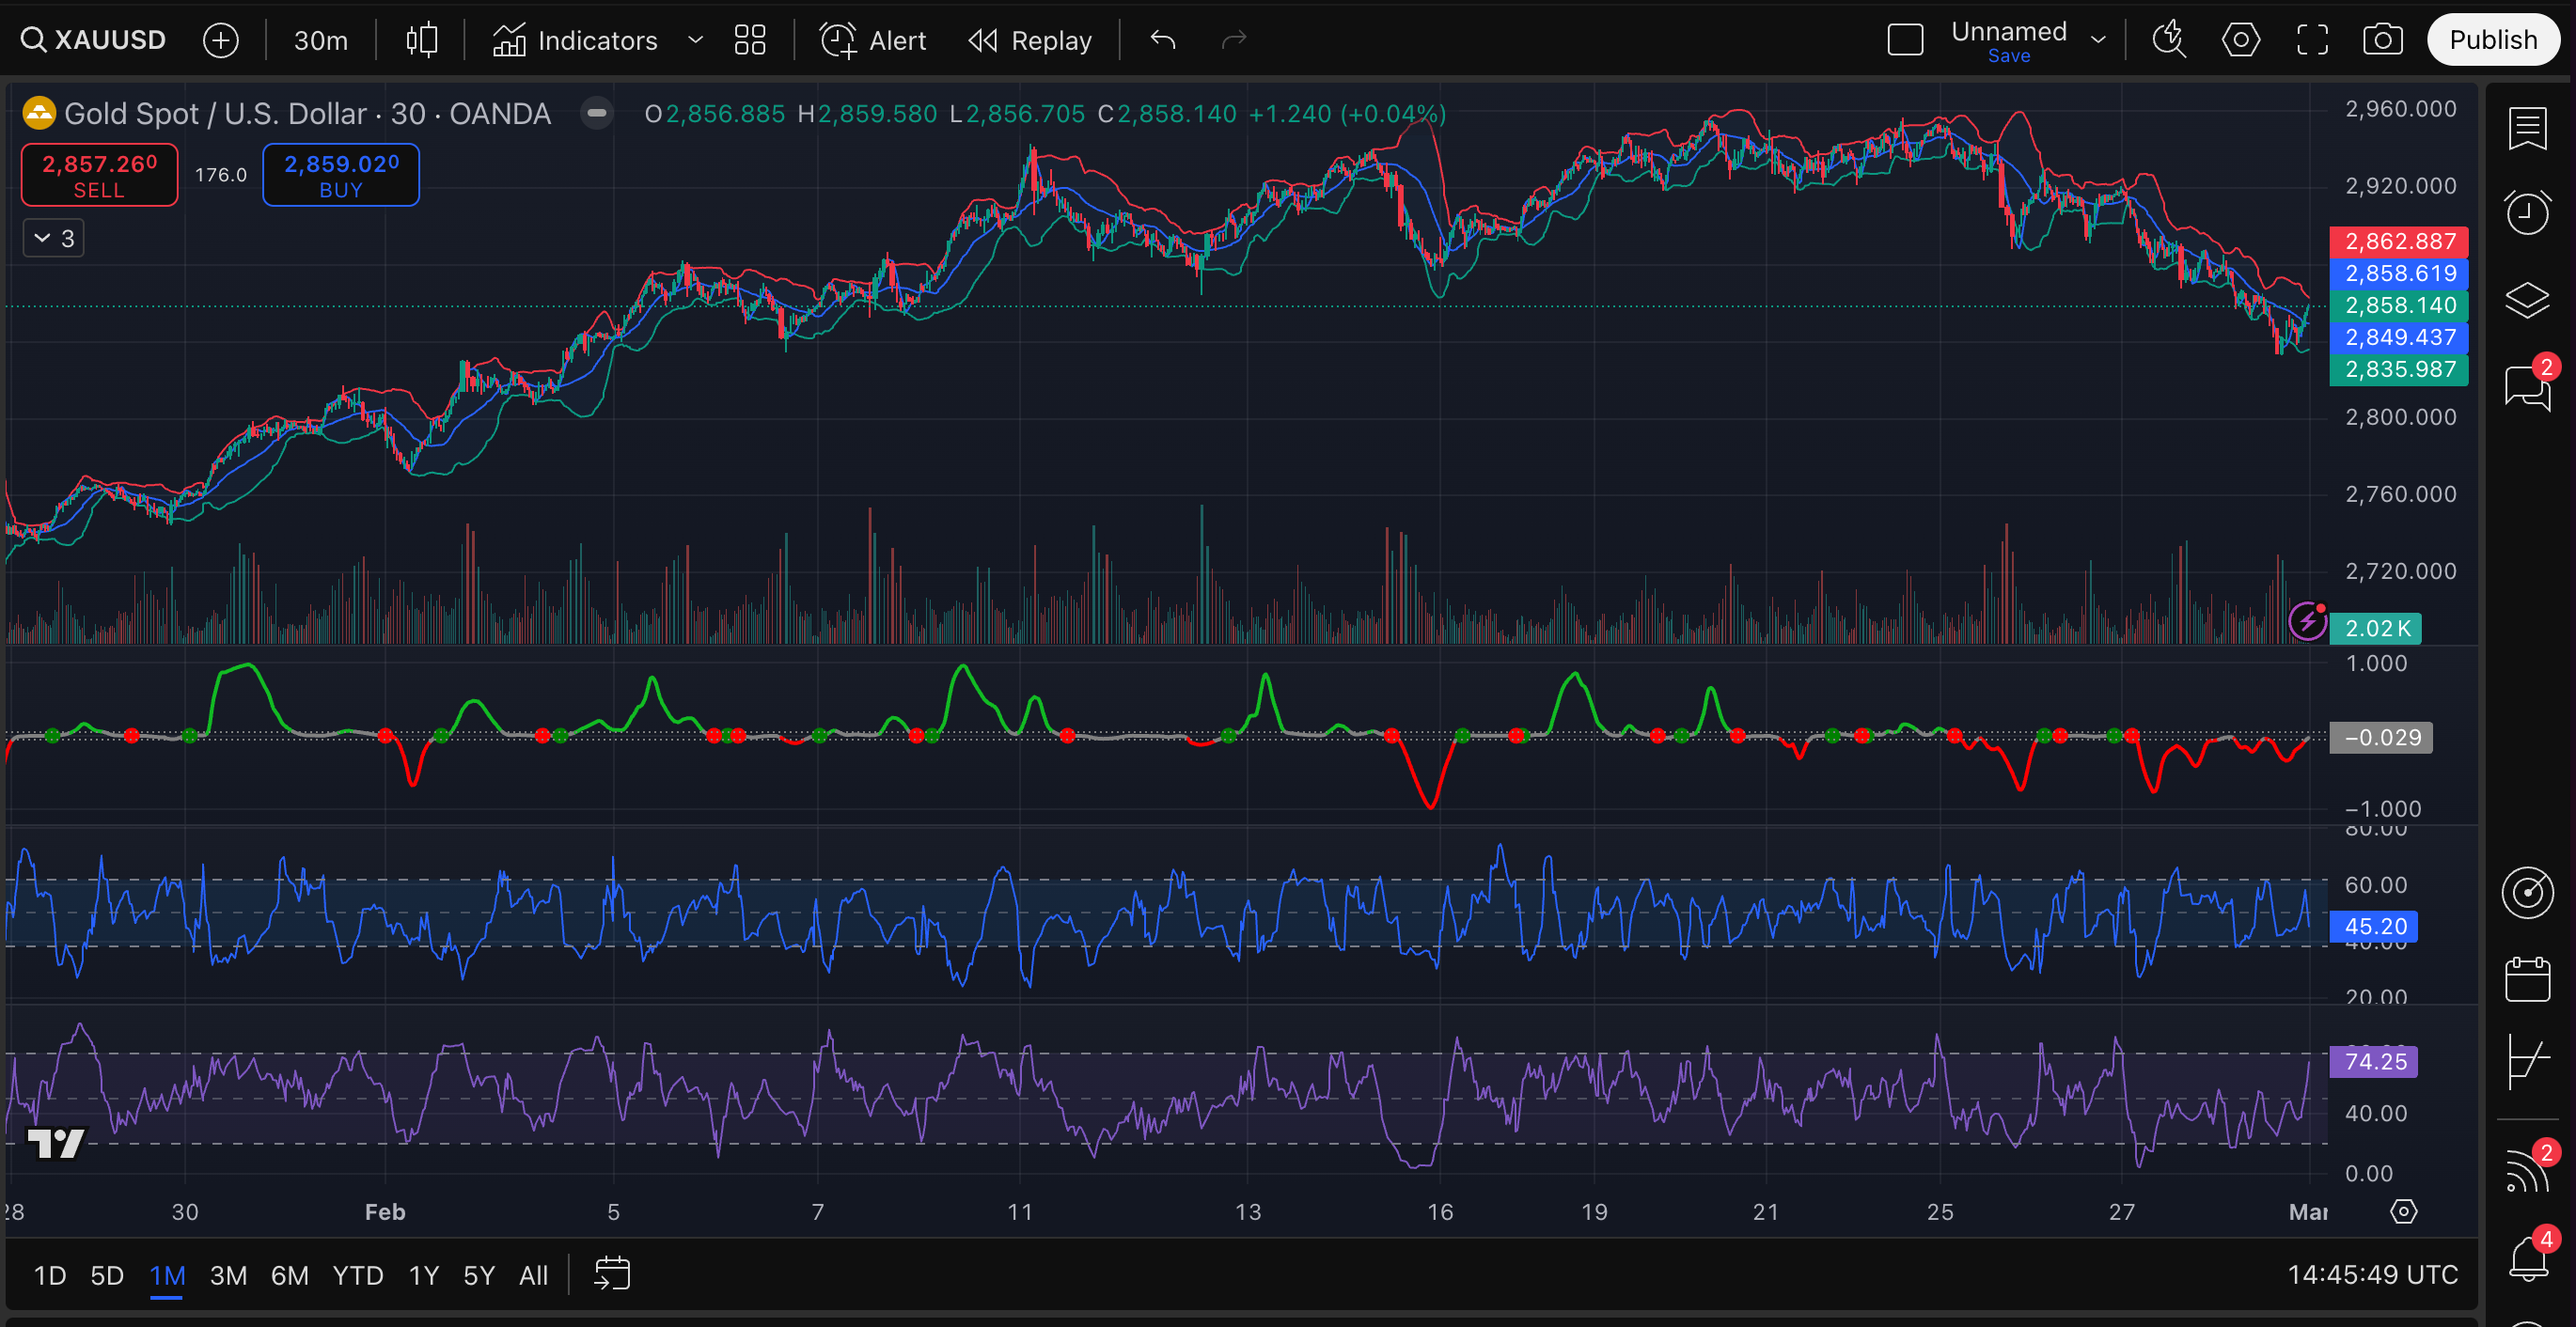
30min charts
Key takeaways:
Short-term trend → bearish (lower highs & lower lows). Price broke 50 EMA ($2,874) and 100 EMA ($2,891) and is trading inside a correction phase.
Price is hovering near high-volume nodes → supply is outweighing demand for now.
Volume & momentum weakening. Falling OBV, negative CMF and a bearish TDI signal low buying pressure right now.
This isn’t a bear market yet. If bulls step in at support, Gold could rally back toward $2,950+.
Some buying interest is appearing → Short-term moving average suggests price is stabilizing.
Stronger bounce possible, but no strong buy signals yet (Stochastic RSI and CCI are low). The price might move
Keep reading with a 7-day free trial
Subscribe to The Gold Trader to keep reading this post and get 7 days of free access to the full post archives.