

The future of Gold: In-depth market analysis, trends, and mid-term outlook
The future of Gold: In-depth market analysis, trends, and mid-term outlook


Hello, fellow traders!
In this week’s update, I’ll:
Dive deep into Gold’s technical performance over the past month, week, and last trading day.
Highlight crucial support and resistance as well as key Fibonacci levels you need to keep an eye on.
Review the shifting market sentiment for XAU/USD from the previous week.
Summarize key economic updates that influenced Gold prices this week.
Preview upcoming economic events for July 15-19 and explain their potential impact on Gold.
Share my mid-term predictions and speculations for XAU/USD movements next week and the coming month.
⚡ Gold hits one-month high
Over the last week, Gold XAU/USD has demonstrated significant volatility marked by significant upward momentum and intermittent corrections.
Gold opened the trading week with a drop to around $2,350, followed by a strong recovery. On Thursday, prices spiked to around $2,425 - the highest level over the last month, boosted by soft CPI data and weakened DXY dollar.
Currently, price is approaching the resistance level of 2,420.00 USD. If the price breaks above 2,420.00 USD with strong volume, it could target the next resistance level around 2,440.00 USD. This would be supported by the weakening DXY since Gold and dollar often show pattern of inverse movement.
📊 Let’s look at the technical data:
Last 30 days
The price of XAU/USD has shown a clear upward trend over the past month climbing from around $2,320.00 to $2,410.92. Every time the price touched the support, it tended to bounce back up.

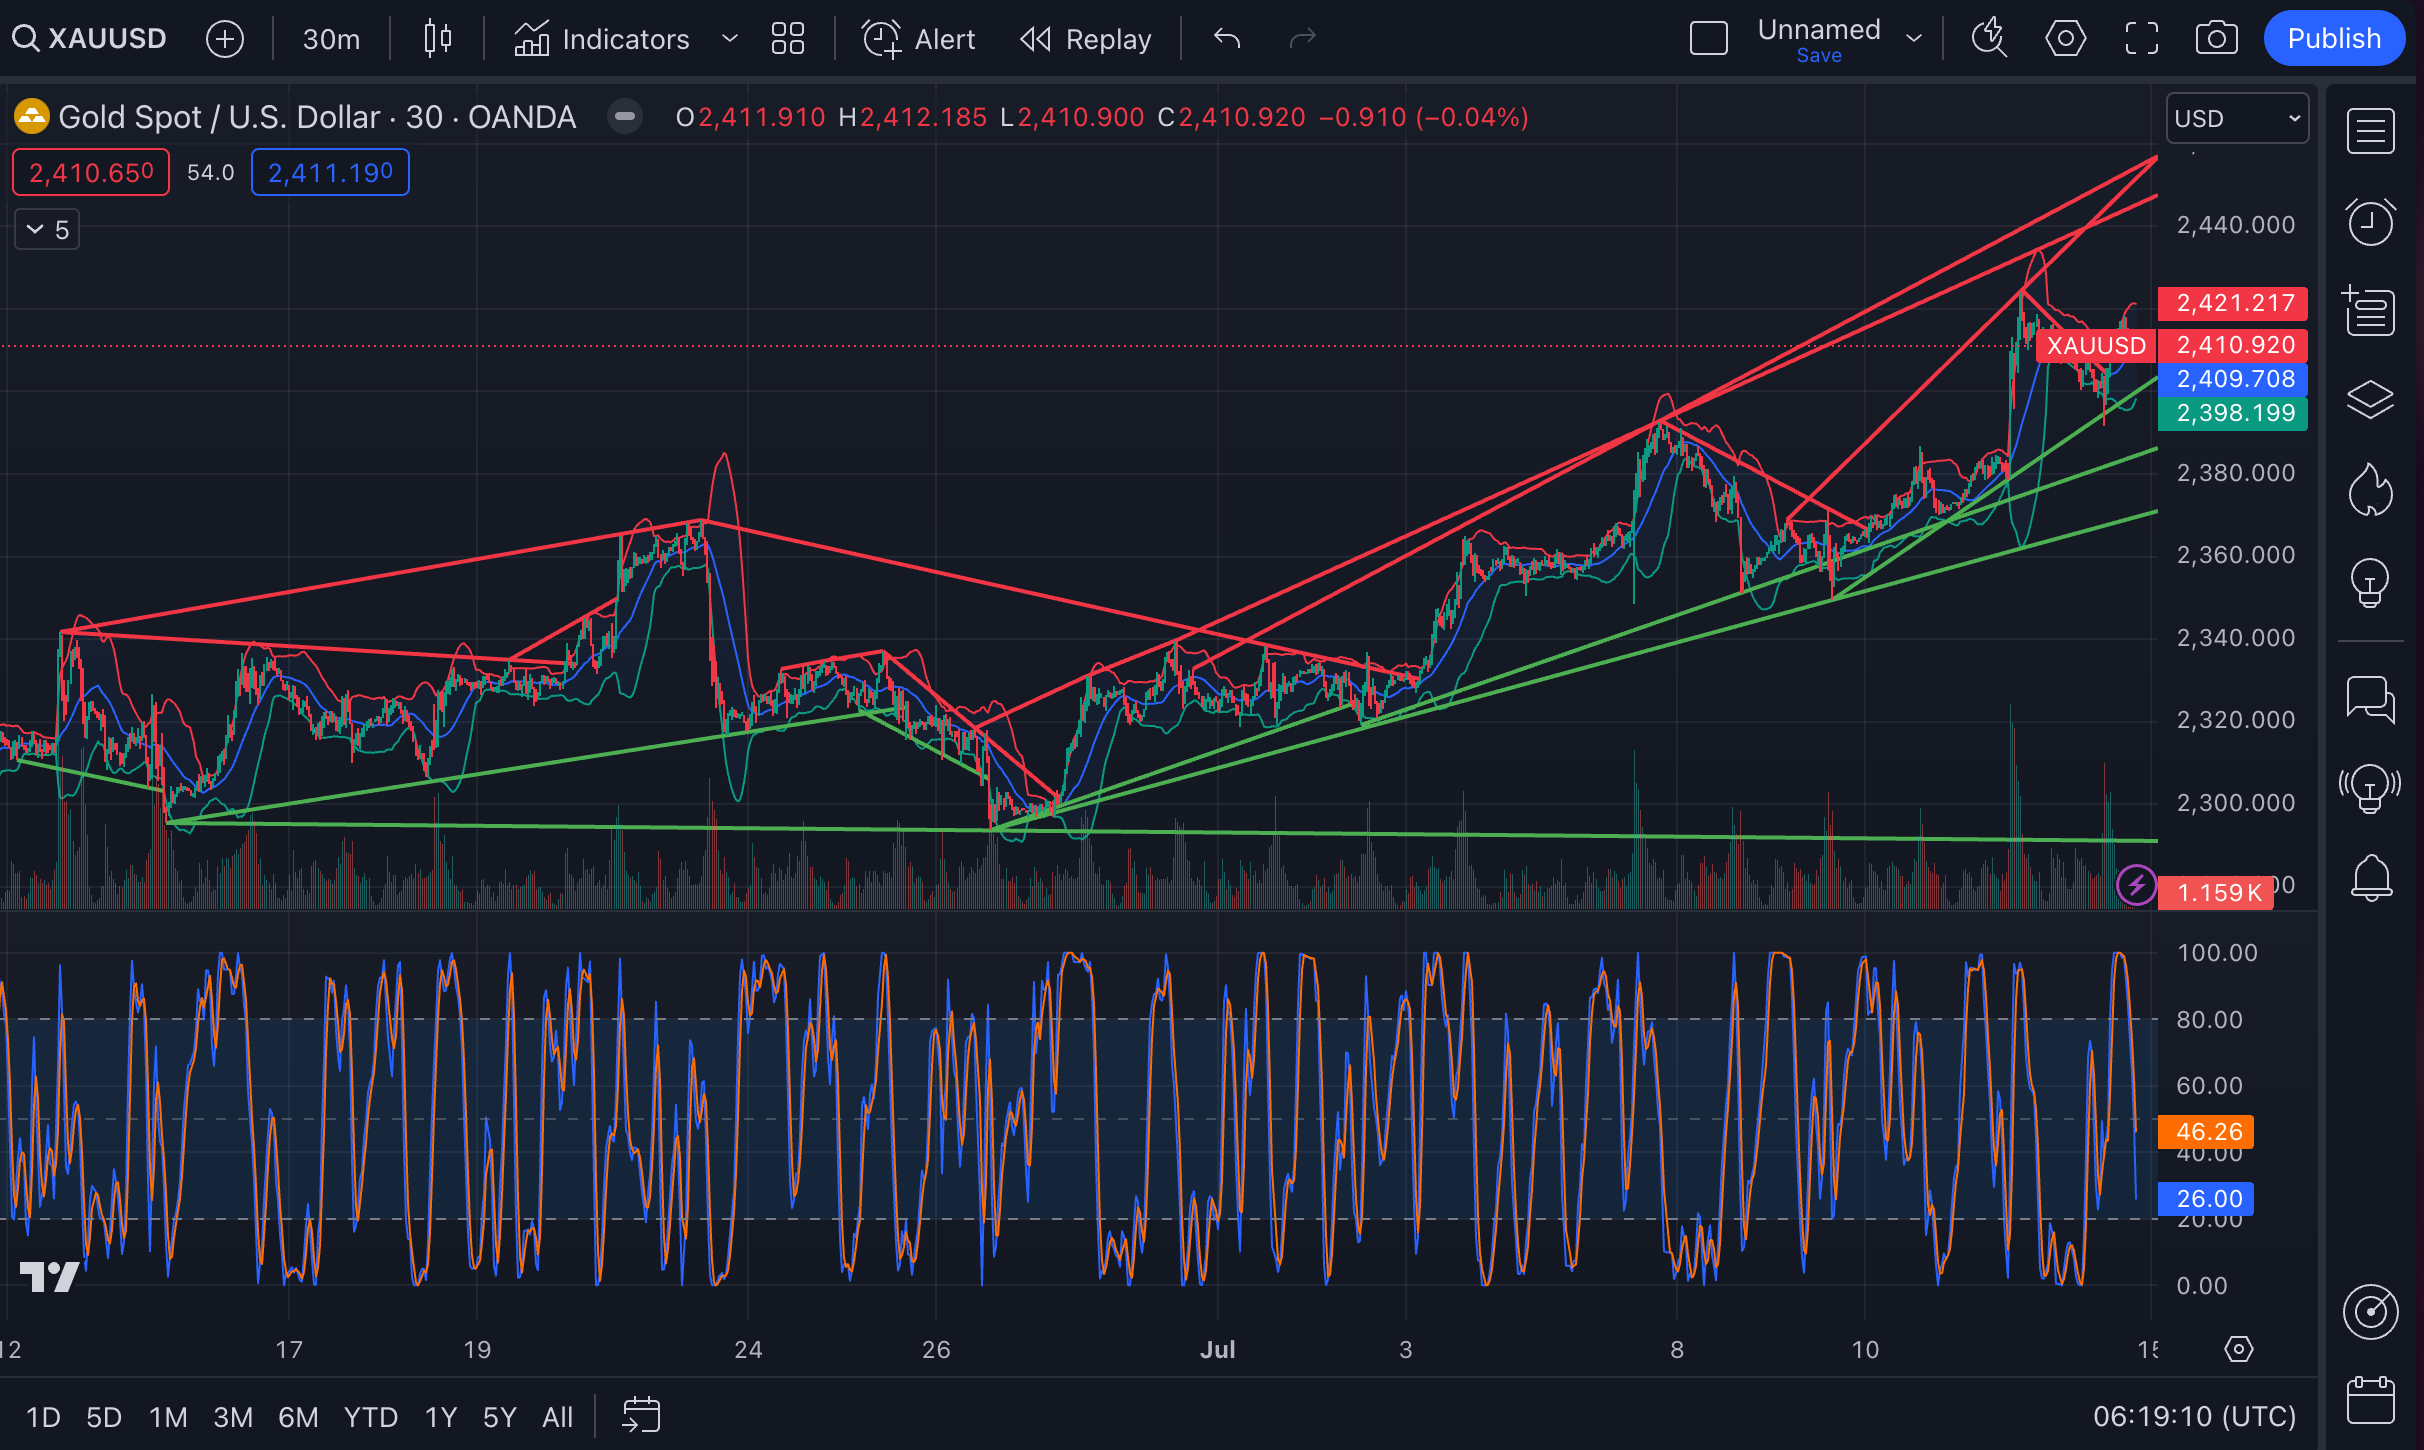
The price is currently slightly above the 20 SMA. This along with the steady climb and the support levels holding firm suggest a bullish momentum in the short term.
The Stoch RSI is relatively neutral but trending upwards from a low of 26.00. There's still some room for upward movement before hitting overbought levels.
However, the price is near the upper Bollinger Band, suggesting it might correct downwards soon.
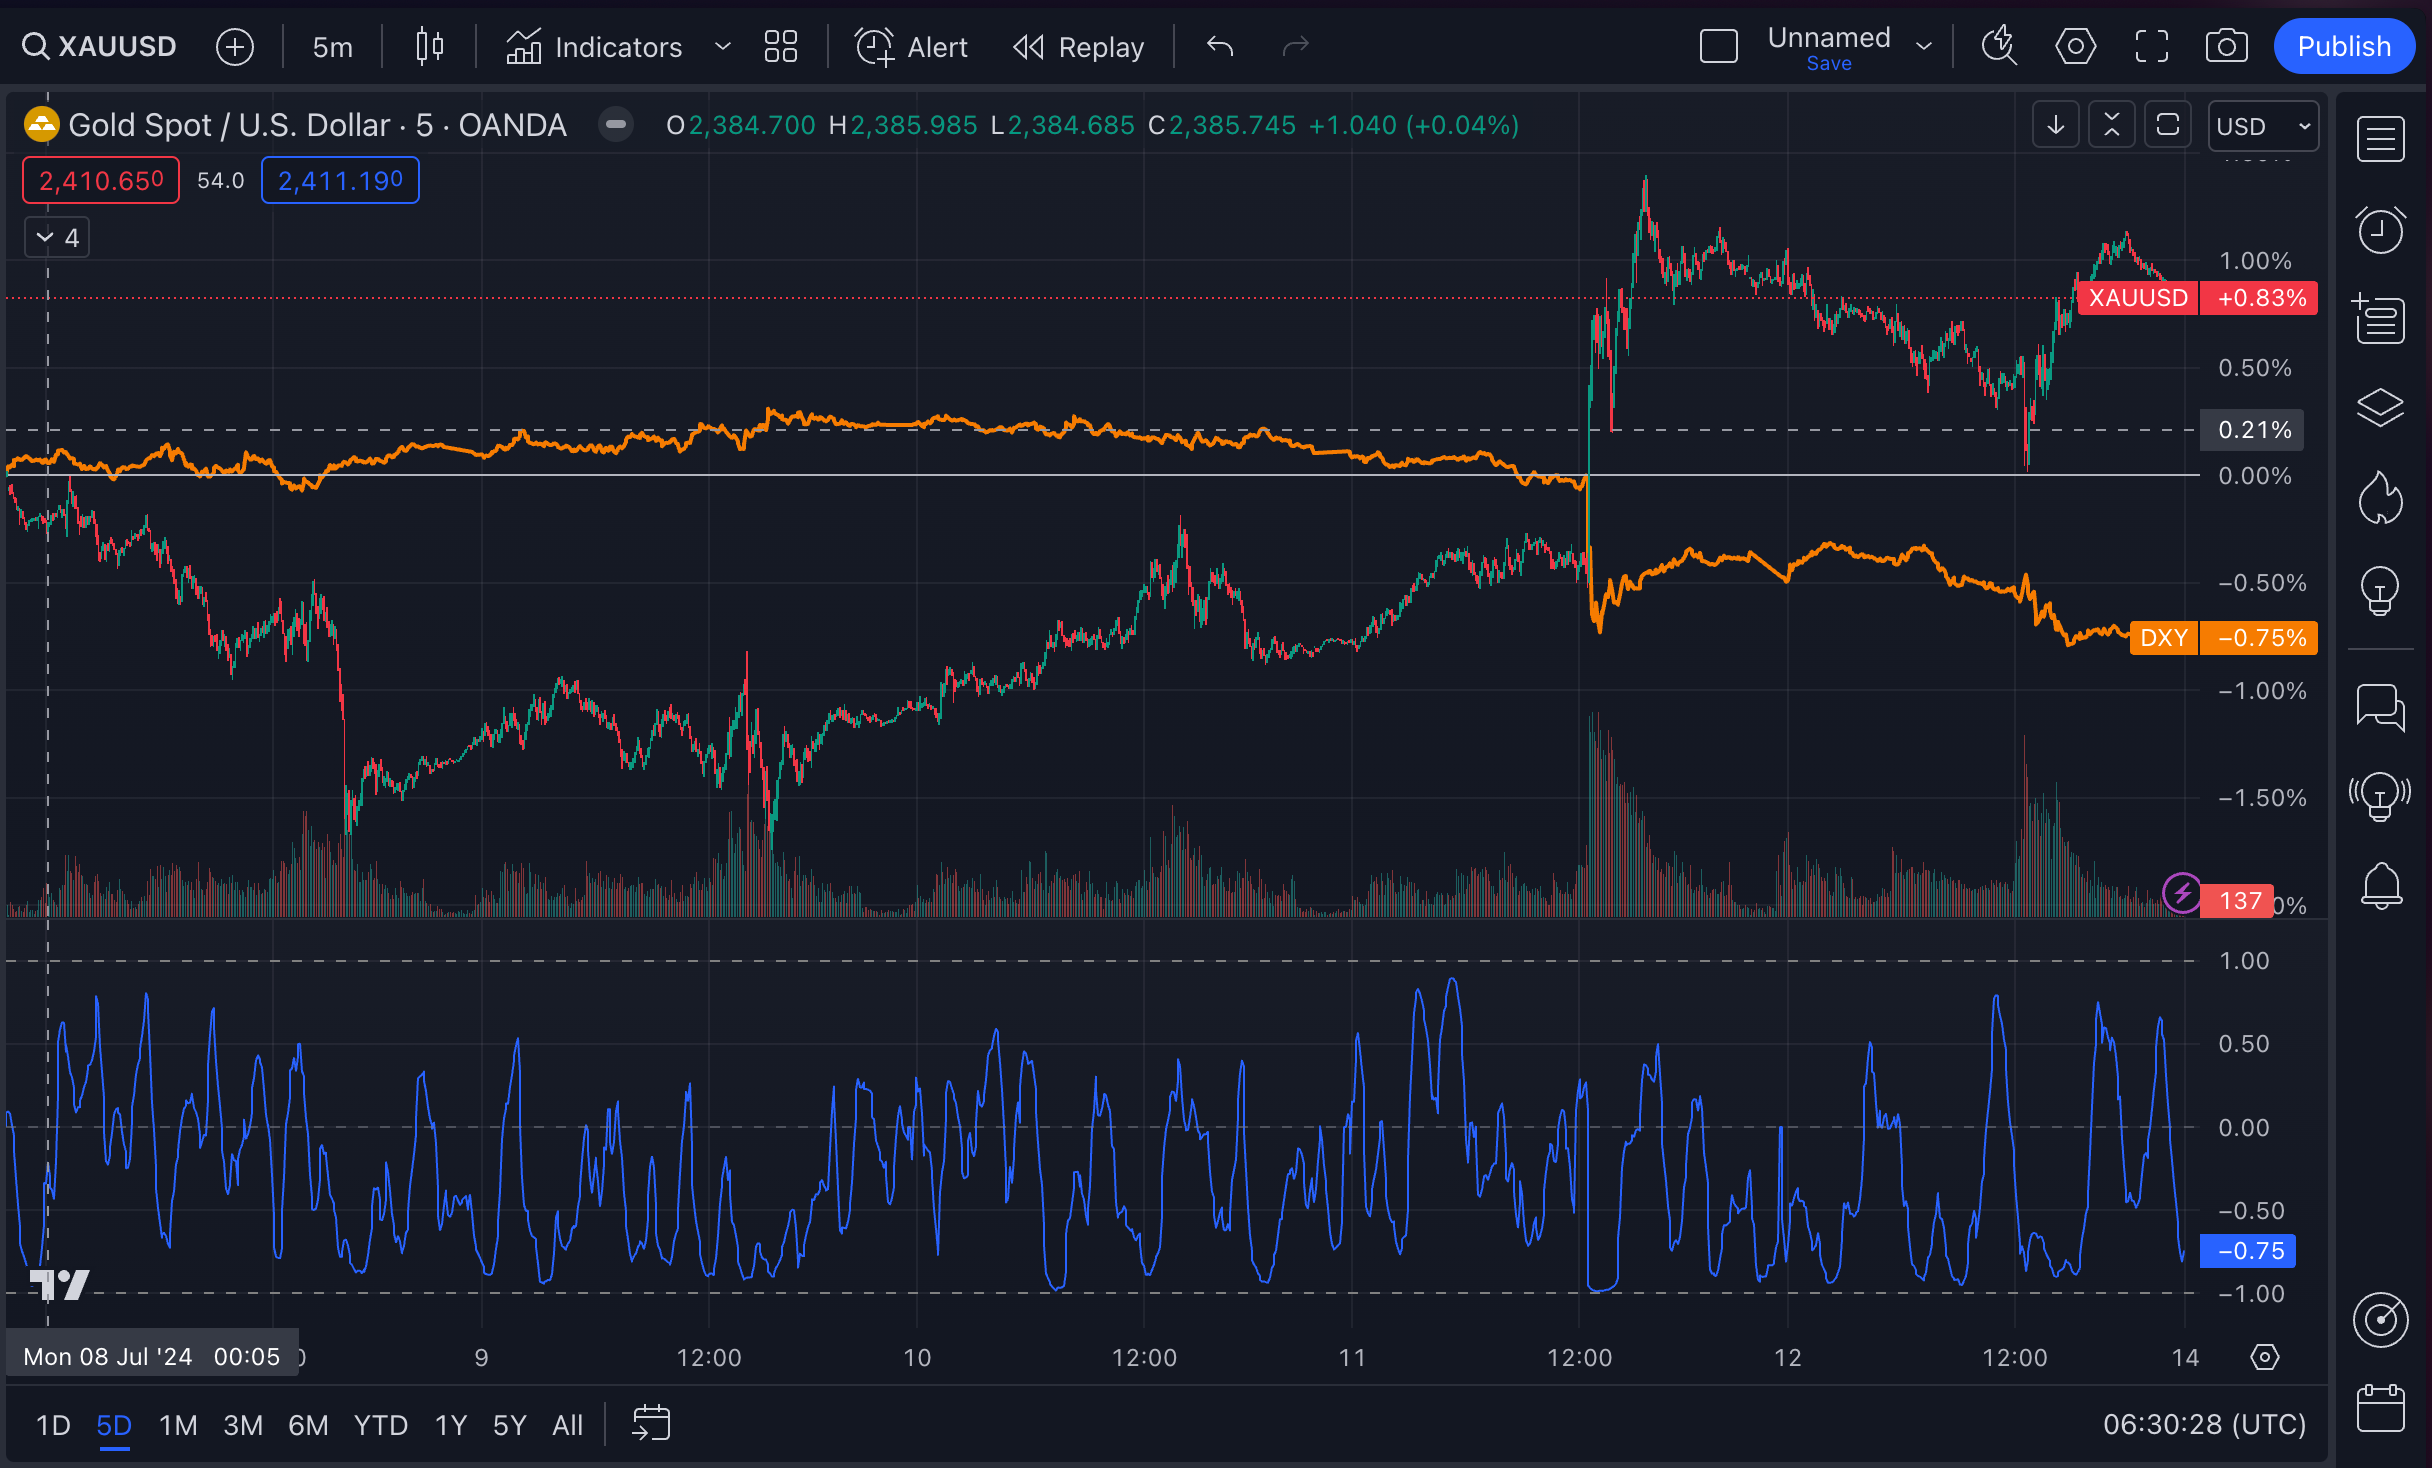
Last 5 days
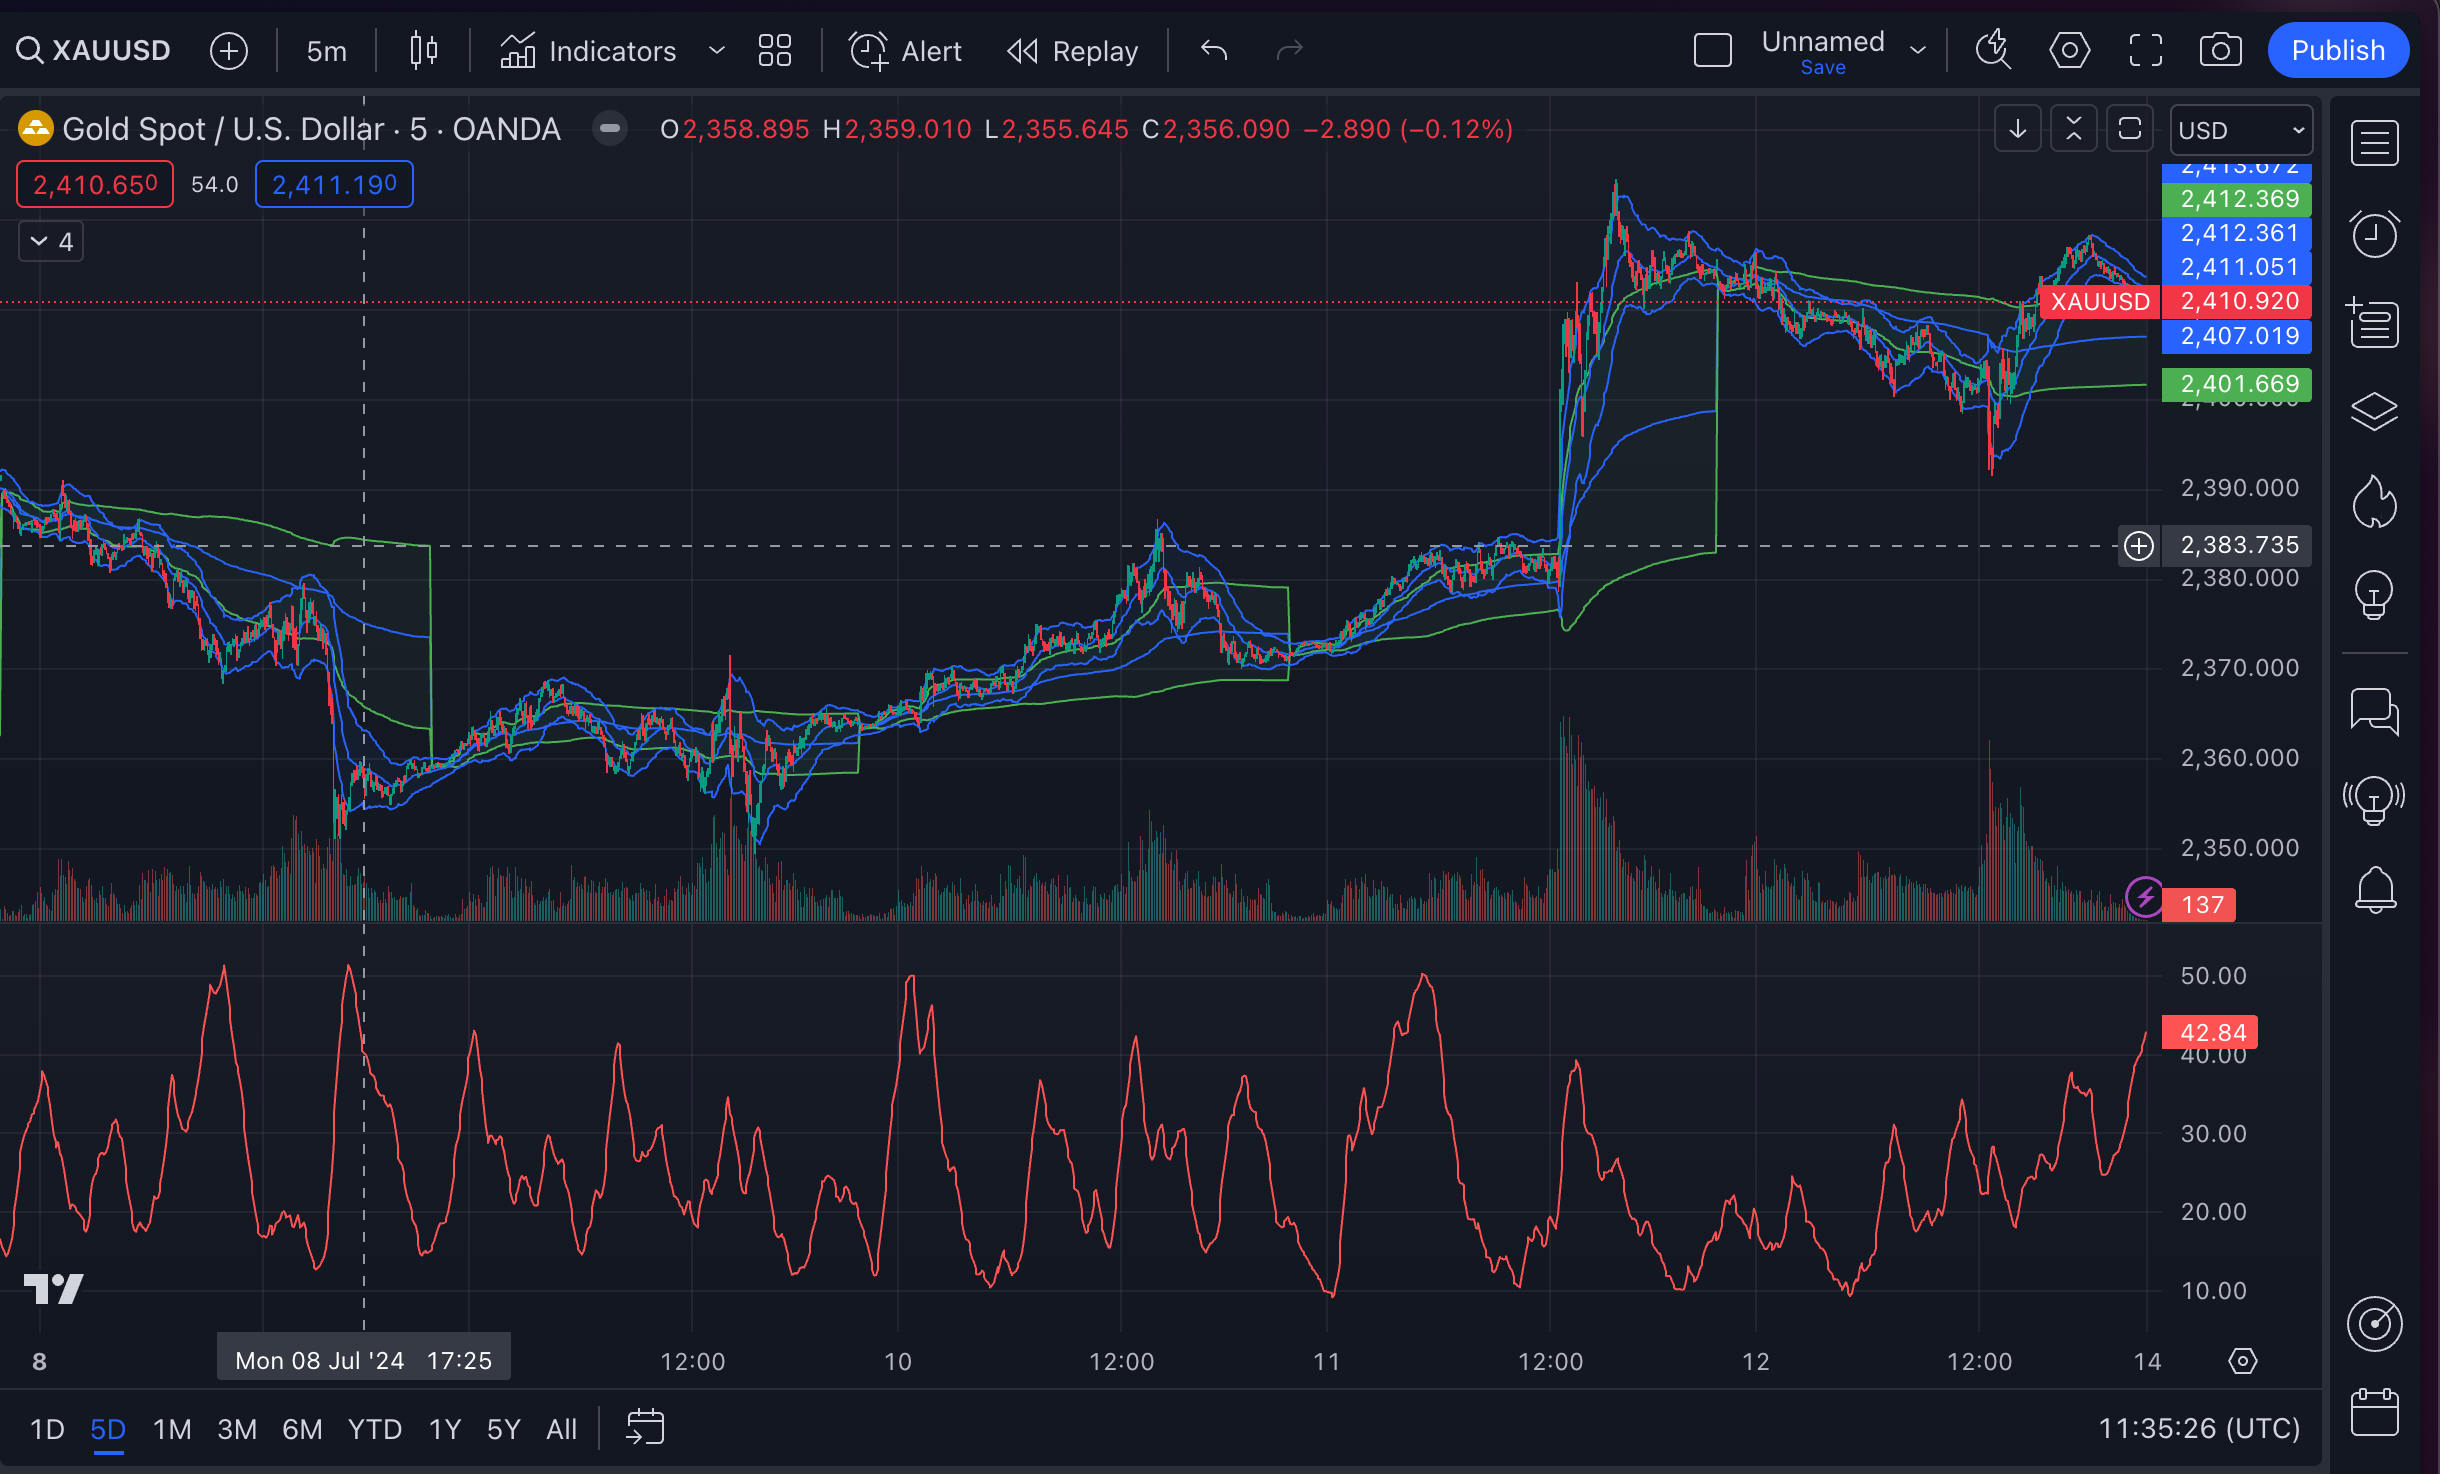
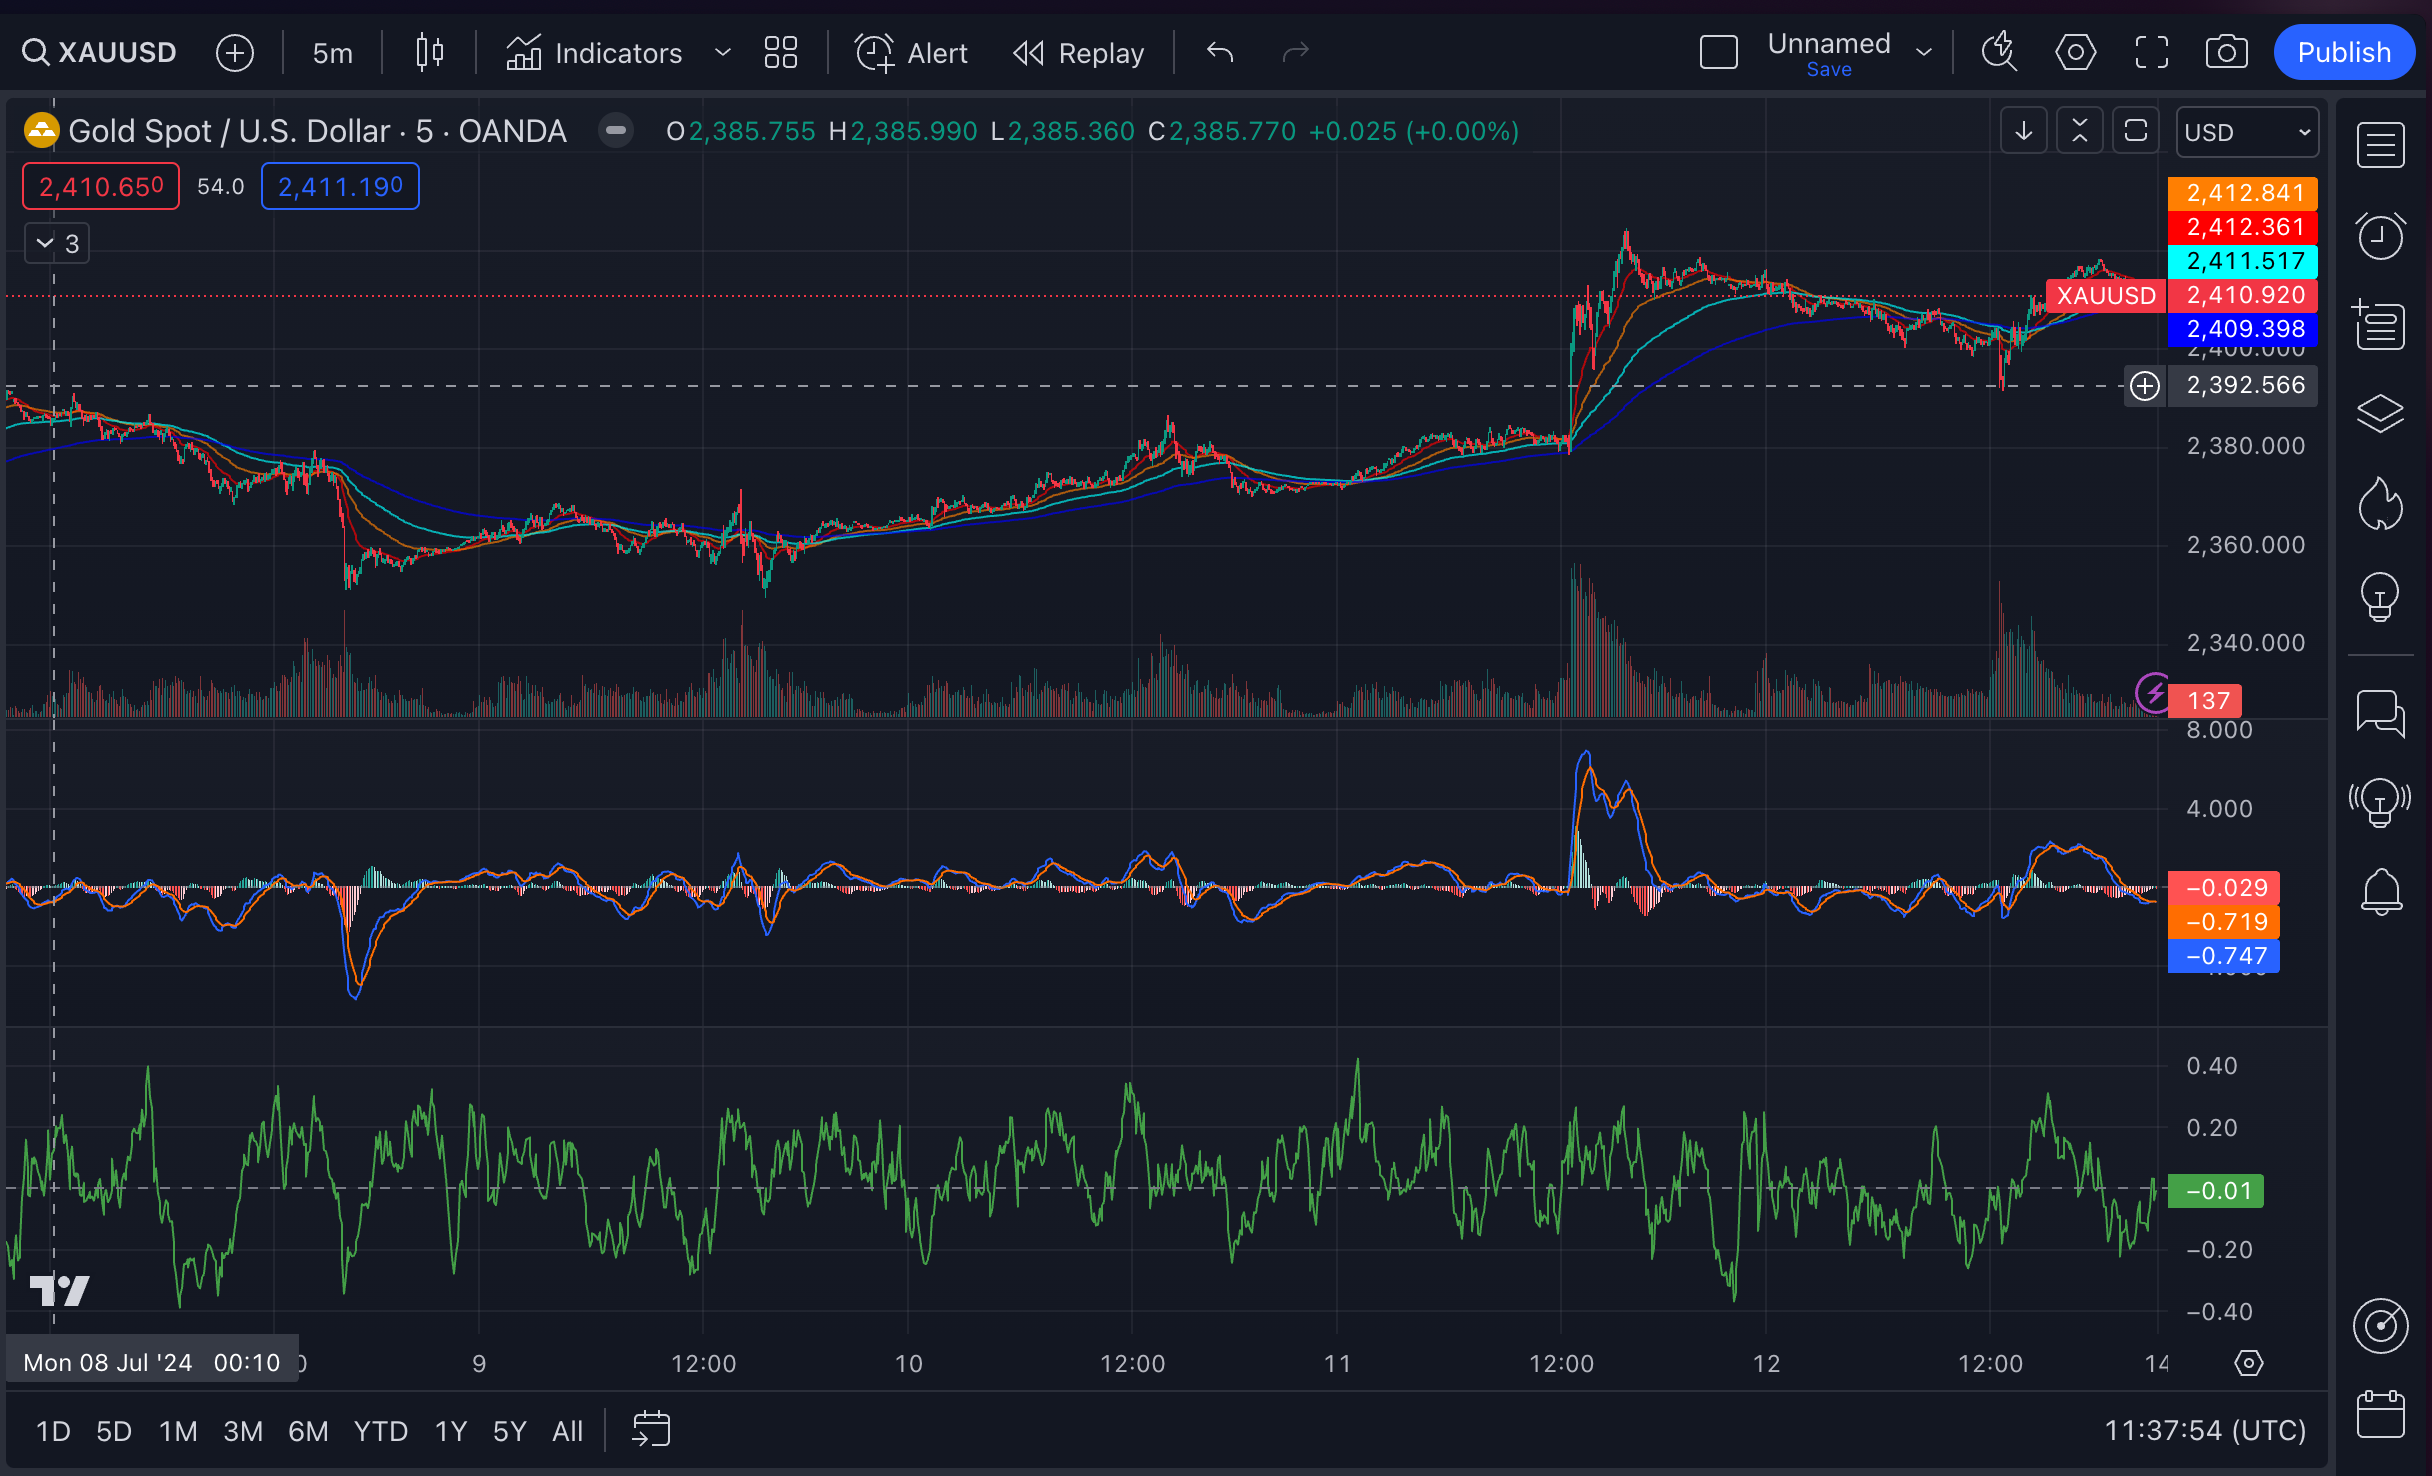
Since the low on July 8, Gold has been trending upwards, supported by increasing volumes.
The price being above the EMAs, VWAP and within the upper Keltner Channel suggests a short-term bullish trend. Strong ADX confirms the upward trend is solid.
Nonetheless, the MACD and CMF show mixed signals.
Keep reading with a 7-day free trial
Subscribe to The Gold Trader to keep reading this post and get 7 days of free access to the full post archives.