
Technical Analysis Course #9: Mastering the MACD + a simple MACD strategy that works [83% win rate]

Hello, fellow traders and welcome to the lesson #9 of the Technical Analysis course.
Today we’re diving into one of the most powerful and easy-to-use tools in technical analysis: the MACD - Moving Average Convergence Divergence.
If you’ve been looking for a reliable strategy to predict market trends and make consistent profits, the MACD could be your new best friend.
It’s simple, effective, and, most importantly, it works in almost any market - Gold, stocks, forex, or even crypto.
By the end of this lesson, you'll be able to:
easily interpret MACD signals to identify market trends
spot bullish and bearish crossovers to predict potential trend reversals and strengthen your trade entry points.
use advanced techniques like spotting divergence to filter out false signals and avoid bad trades
learn a simple yet effective 83% win rate MACD strategy I use for Gold trading.
If you like my writing, please leave a like and/or a comment and share it with your trader friends!
As always, I’ll be using the XAU/USD chart, tons of visuals, and the TradingView platform to illustrate all the concepts.
What is the MACD
The MACD is a trend-following indicator that shows us when a trend is likely to start, end, or reverse.
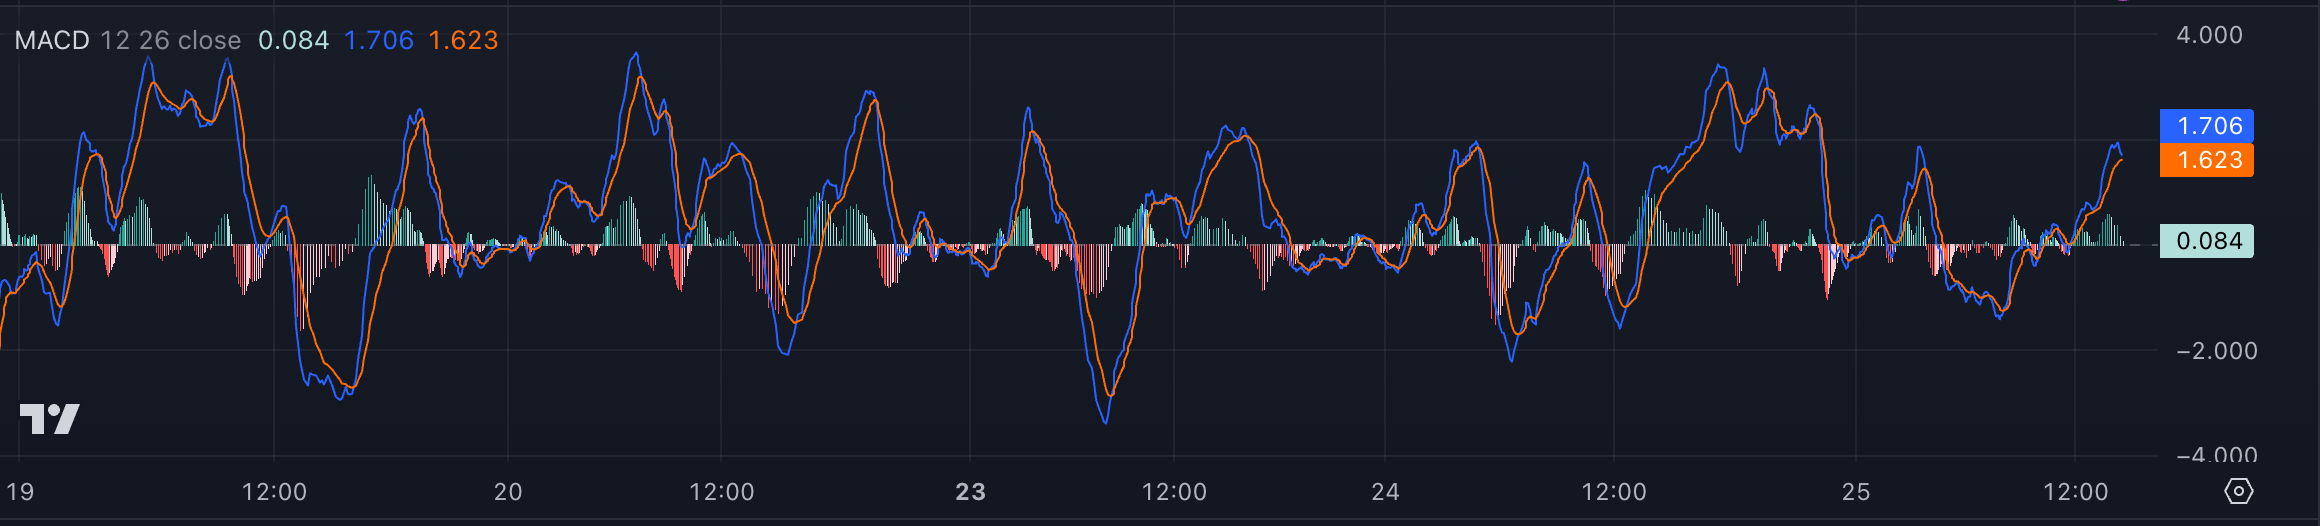
The MACD is made up of four key components:
MACD Line: Typically a 12-day exponential moving average (EMA) minus the 26-day EMA → shows the difference between short-term and long-term price movements.
Signal Line: Usually a 9-day EMA of the MACD line → helps smooth out the MACD line to give clearer signals.
Histogram: The histogram visualizes the difference between the MACD line and the signal line. This helps traders see how strong a trend might be.
Zero Line: The central line of the MACD. When the MACD and signal lines cross the zero line, it indicates the start of a potential new trend.
Understanding MACD crossovers
The MACD line and signal line are key to spotting trends. The indicator works on crossovers between these lines:
Bullish Crossover: When the MACD line crosses above the signal line, this suggests an upward trend ("bullish momentum").
Bearish Crossover: When the MACD line crosses below the signal line, this indicates a potential downward trend ("bearish momentum").
But here's where it gets even more useful.
You can also use the histogram to measure the strength of the trend.
When the bars in the histogram are growing and dark-colored, the momentum of the trend is increasing. If the bars are shrinking and their color is getting bleaker, the trend is losing strength.
The MACD alone isn’t enough
A lot of traders use the MACD on its own, which can work—especially when a market is trending.
But here's a tip that will significantly boost your success rate:
Keep reading with a 7-day free trial
Subscribe to The Gold Trader to keep reading this post and get 7 days of free access to the full post archives.