Technical Analysis Course #8: Using moving averages (MA) to spot trends and time entries -> step-by-step trend trading strategy with 50 EMA
Hello, fellow traders and welcome to the lesson #8 of the Technical Analysis course. Today we’re talking about Moving Averages.
By the end of this lesson, you'll be able to:
understand how to use moving averages (MA) to spot uptrends, downtrends, and sideways markets.
recognize key signals like bullish and bearish crossovers.
learn how to deal with MA false signals and false breakouts.
know when to apply each type of MAs based on market conditions and your trading strategy.
learn my widely used trend trading strategy with 50 EMA, step-by-step.
If you like my writing, please leave a like and/or a comment and share it with your trader colleagues!
As always, I’ll be using the XAU/USD chart, tons of visuals, the TradingView platform (and it’s awesome autocharting function) to illustrate all the concepts.
Moving averages
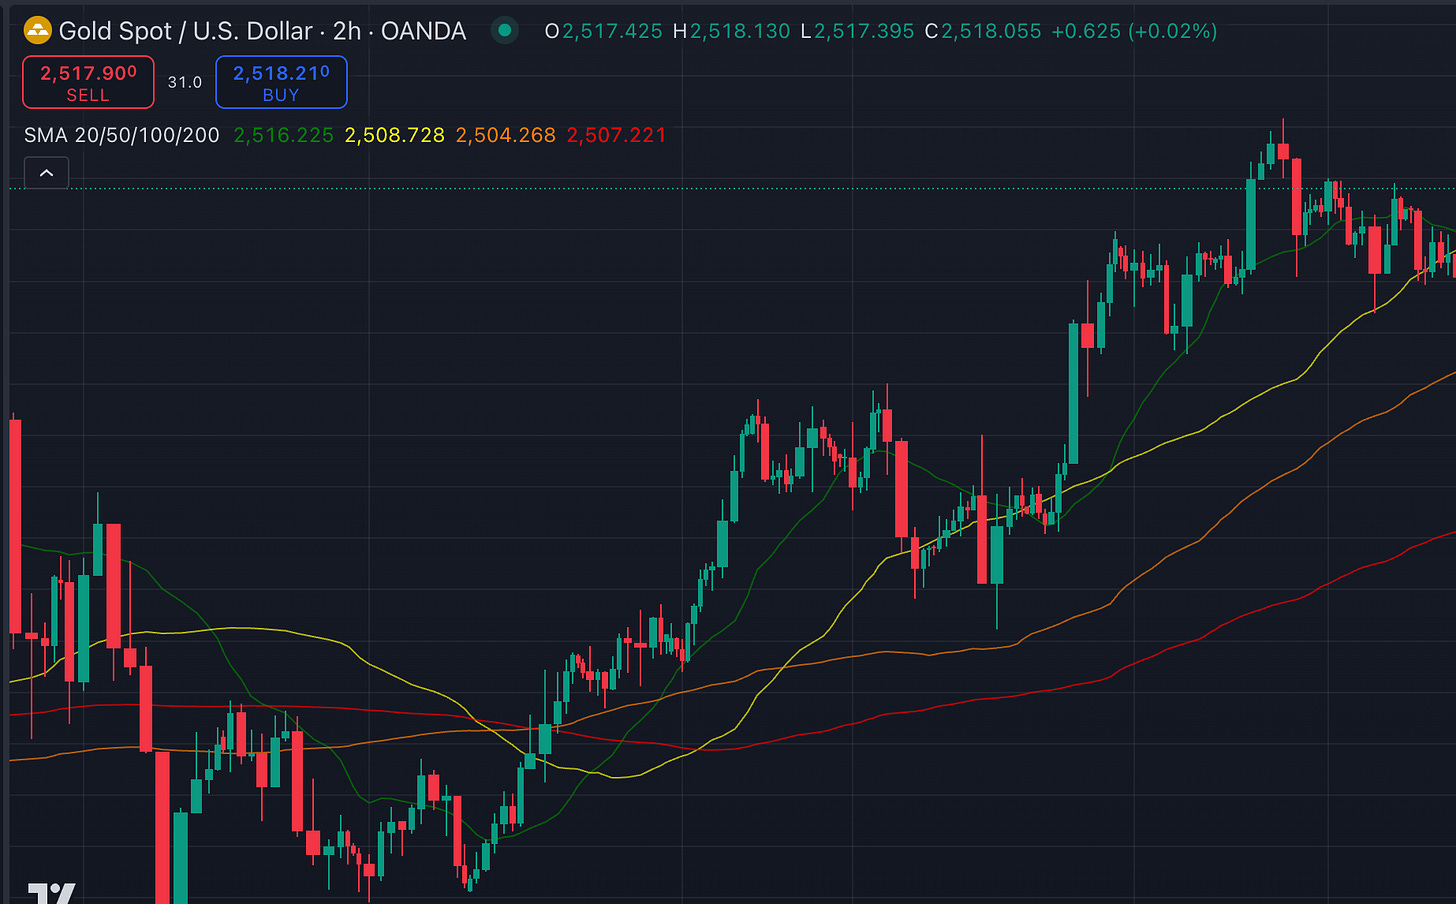
Moving averages (MA) help smooth out price data to create a single flowing line, making it easier to identify the overall trend.
They're calculated by taking the average of a certain number of past price points. For example, a 10-day simple moving average adds up the closing prices from the last 10 days and divides by 10.
MA is a trader's best friend
In practice, you might use moving averages in a few different ways:
Spot a trend/trend reversal: MAs helps distinguish between bullish, bearish, and sideways markets:
prices are consistently above a moving average → uptrend.
prices below the moving average → downtrend.
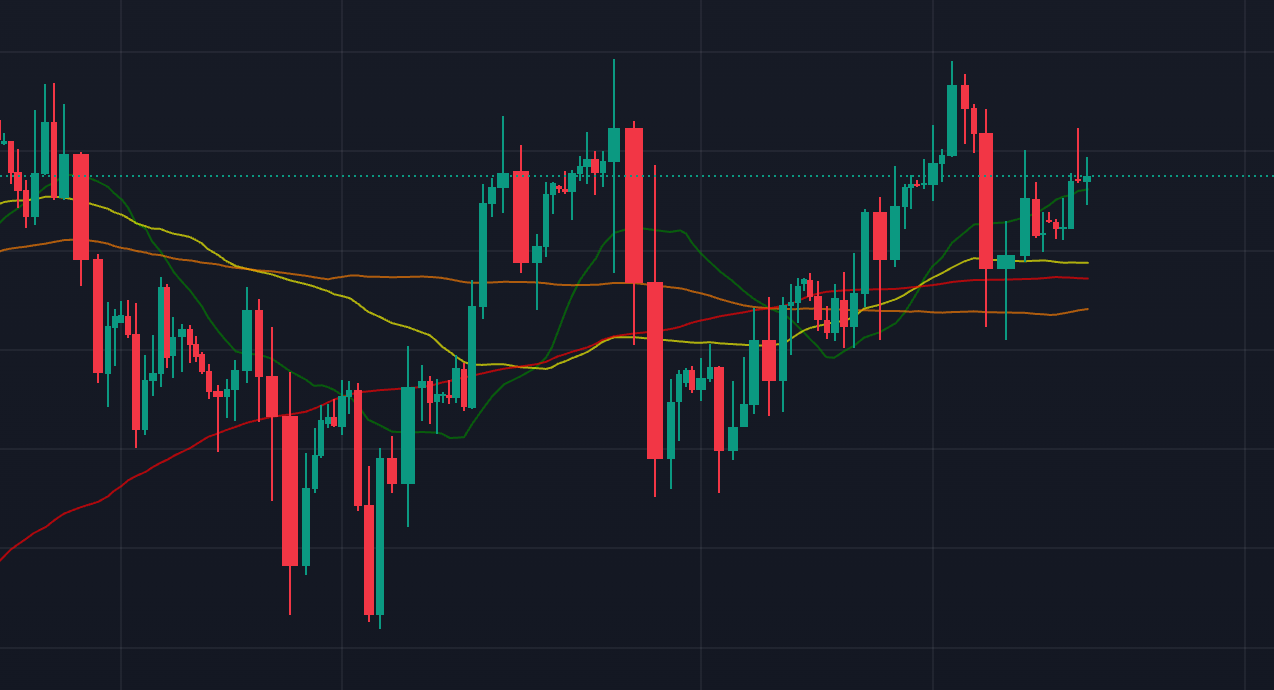
prices cut though the moving average → sideways.
When the shorter MA crosses above the slower MA → bullish signal (and vice versa).

Support and resistance: MAs often act as dynamic support or resistance levels. In an uptrend, a rising moving average might act as support, with prices bouncing off it. In a downtrend, it might act as resistance.
Moving averages are lagging and can show false signals
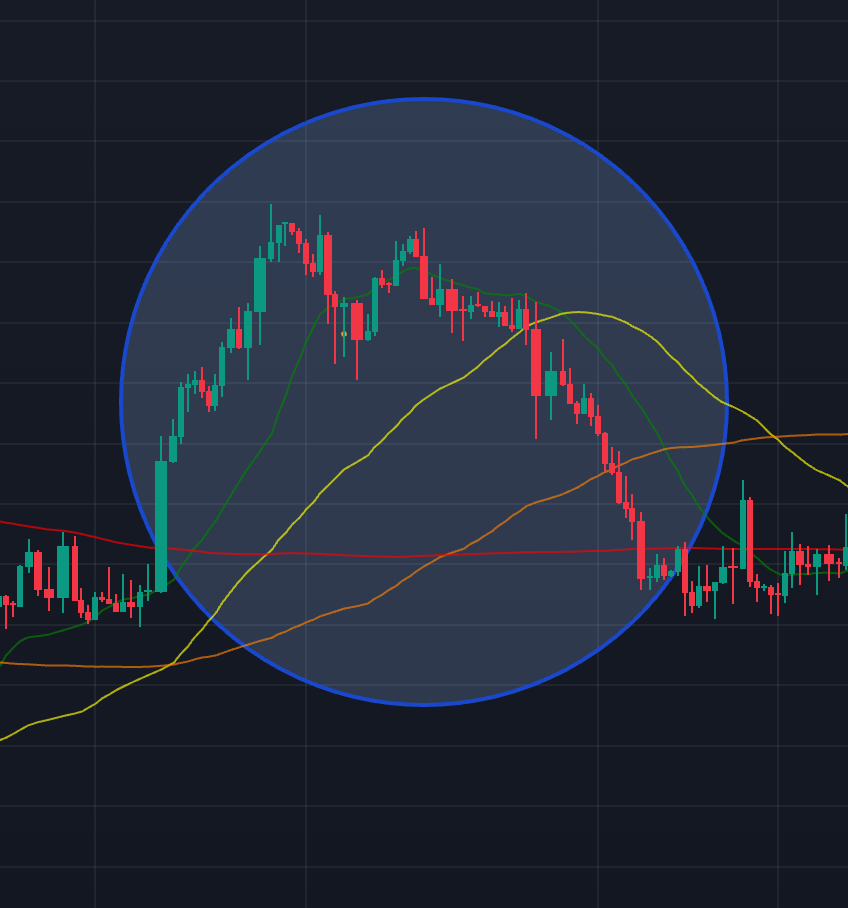
MAs are based on past prices, so they don't predict future movements. They can still be rising after prices have hit a peak and started to decline.
Also, be aware of potential false signals, especially in choppy or sideways markets. These false signals can occur when price briefly crosses the moving average but doesn't follow through with a sustained move.
Here’s how to deal with false signals:
Keep reading with a 7-day free trial
Subscribe to The Gold Trader to keep reading this post and get 7 days of free access to the full post archives.


