Technical Analysis Course #7: Understanding technical indicators and their signals -> confirm trends and spot reversals
Hello, fellow traders and welcome to the lesson #7 of the Technical Analysis course.
This is a free lesson available to read for everyone and today we’re going to talk about technical indicators.
By the end of this lesson, you'll be able to:
confirm market trends by understanding the signals technical indicators are giving you
understand divergences and spot reversals quickly
distinguish between different types of indicators and learn to combine them.
If you like my writing, please leave a like and/or a comment and share it with your trader colleagues!
As always, I’ll be using the XAU/USD chart, tons of visuals, the TradingView platform (and it’s awesome autocharting function) to illustrate all the concepts.
Trading is emotional because it involves money, and money triggers a range of feelings. Technical indicators offer a way to step back from emotions like fear, greed, and excitement that can cloud judgment, and instead focus on facts and data.
In technical analysis, we use indicators to:
confirm trends
gauge trend strength
pinpoint potential reversals or breakouts.
Basically, indicators help cut through the noise of economic data and geopolitical events and give us a clearer picture of the underlying trend.
Different types of indicators give different signals
These signals are like "rules" the indicators follow based on how they are mathematically designed. We can use these rules to better predict price movements and adjust our strategies.
However, indicators’ signals are not hard-and-fast rules that guarantee outcomes; they are probabilistic signals that suggest what might happen based on past market behavior.
Most common types of signals are:
#1. Crossovers: suggests a shift in trend direction.
Examples:
When a shorter-term moving average (e.g., 50-day) crosses above a longer-term moving average (e.g., 200-day), it’s called a bullish crossover (Golden Cross) and signals a potential upward trend.
When the shorter-term moving average crosses below the longer-term moving average, it’s called a bearish crossover (Death Cross) and signals a possible downward trend.
When the MACD line crosses above the zero line, it indicates that the short-term average is rising faster than the long-term average (bullish signal). A crossover below the zero line suggests bearish momentum.
#2. Overbought/Oversold: signals potential reversal or correction.
Examples:
When RSI is above 70, the asset is considered overbought, signaling a potential sell or trend reversal. When below 30, the asset is considered oversold, signaling a potential buying opportunity or trend reversal.
CCI above +100 indicates overbought conditions (potential sell signal). CCI below -100 indicates oversold conditions (potential buy signal).

#3. Breakout: indicates a potential continuation of a strong price movement.
Examples:
In the Donchian Channels indicator, a break above the upper channel indicates a bullish breakout, suggesting that the market is likely to continue upward.
A break below the lower channel indicates a bearish breakout, signaling a potential downward trend.
If the price breaks through a pivot level, it signals a potential reversal or continuation in a new direction.
#4. Divergence: when the indicator and price move in opposite directions, it can signal a potential trend reversal.
Examples:
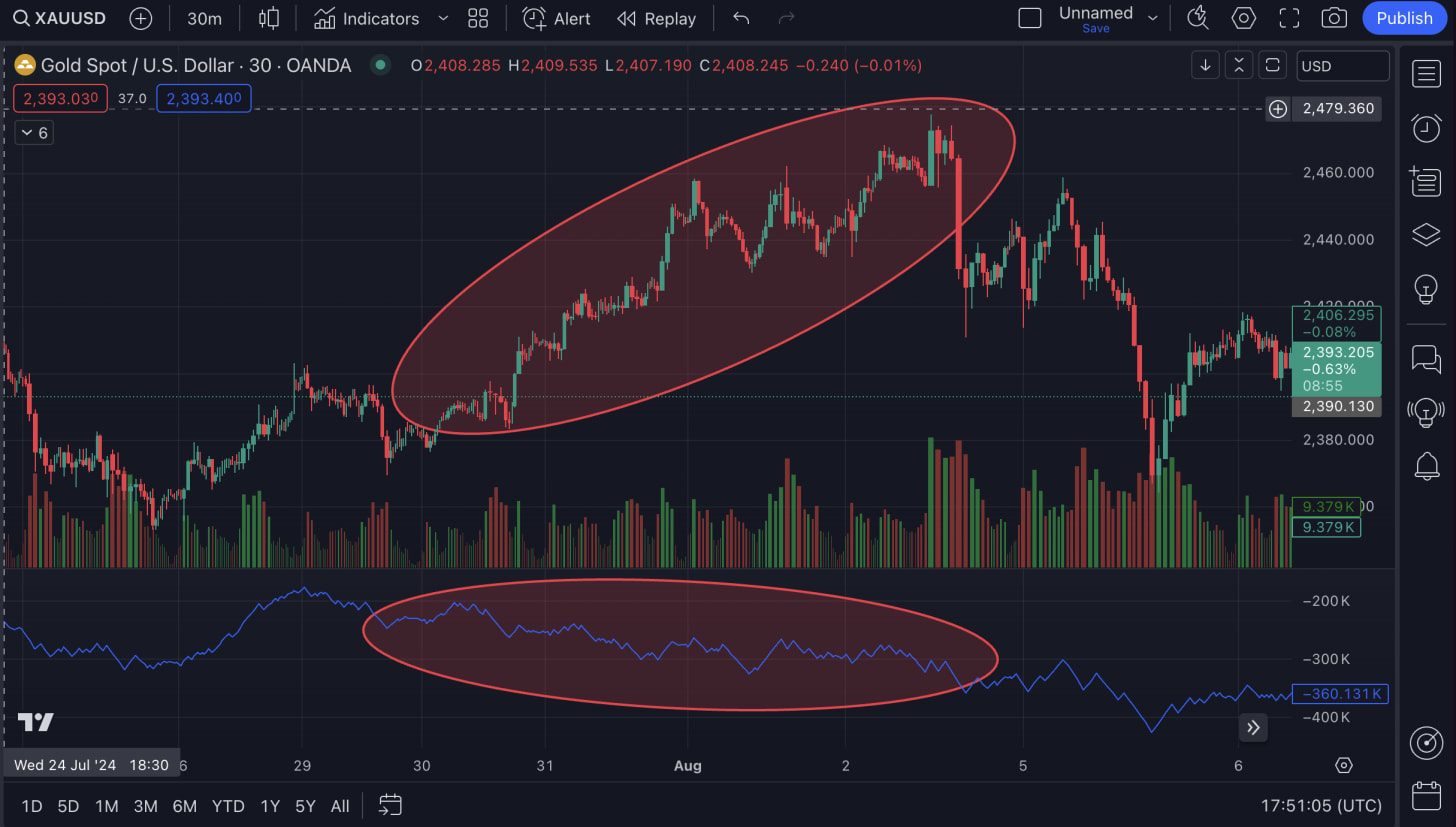
If OBV rises while the price is falling or flat, it signals bullish divergence, indicating buying pressure and a possible price increase.
If OBV falls while the price is rising, it signals bearish divergence, indicating selling pressure and a potential price drop.
Combining different types of indicators will give you a clearer view of the market
#1. Trend indicators
These help identify the direction of the market, whether it's moving up, down, or sideways.
Examples:
Moving Averages (MA): Shows the average price over a specific period of time, smoothing out fluctuations.
Moving Average Convergence Divergence (MACD): Measures the difference between two moving averages to indicate trend strength and direction.
Average Directional Index (ADX): Used to measure the strength of a trend, without indicating its direction.
#2. Momentum indicators
These show the speed at which prices are moving. They help us understand how strong a trend is and whether it might be losing steam.
Examples:
Relative Strength Index (RSI): Measures the speed and change of price movements to indicate overbought or oversold conditions.
Stochastic Oscillator: Compares a particular closing price to a range of prices over a set period to determine momentum.
Commodity Channel Index (CCI): Shows when a security is overbought or oversold relative to its historical performance.
#3. Volatility indicators
Volatility indicators tell how much the price is fluctuating, helping traders spot periods of high or low volatility.
Examples:
Bollinger Bands: Plots two standard deviations away from a simple moving average, indicating volatility.
Average True Range (ATR): Measures market volatility by analyzing the range of prices over a given period.
Keltner Channel: Similar to Bollinger Bands but uses the Average True Range (ATR) to determine channel width.
#4. Volume indicators
These focus on trading volume and help confirm price trends or predict reversals.
Examples:
On-Balance Volume (OBV): Uses cumulative volume data to predict price direction.
Chaikin Money Flow (CMF): Measures buying and selling pressure using both price and volume.
Volume-Weighted Average Price (VWAP): Calculates the average price weighted by volume, showing the true market value of the asset.
#5. Support and Resistance Indicators
These help identify key price levels where the market may reverse or consolidate.
Examples:
Fibonacci Retracement: Identifies potential reversal levels based on key Fibonacci ratios.
Pivot Points: Calculate potential support and resistance levels based on previous periods' highs, lows, and closing prices.
Donchian Channels: Track the highest and lowest prices over a specific period, helping define support and resistance levels.
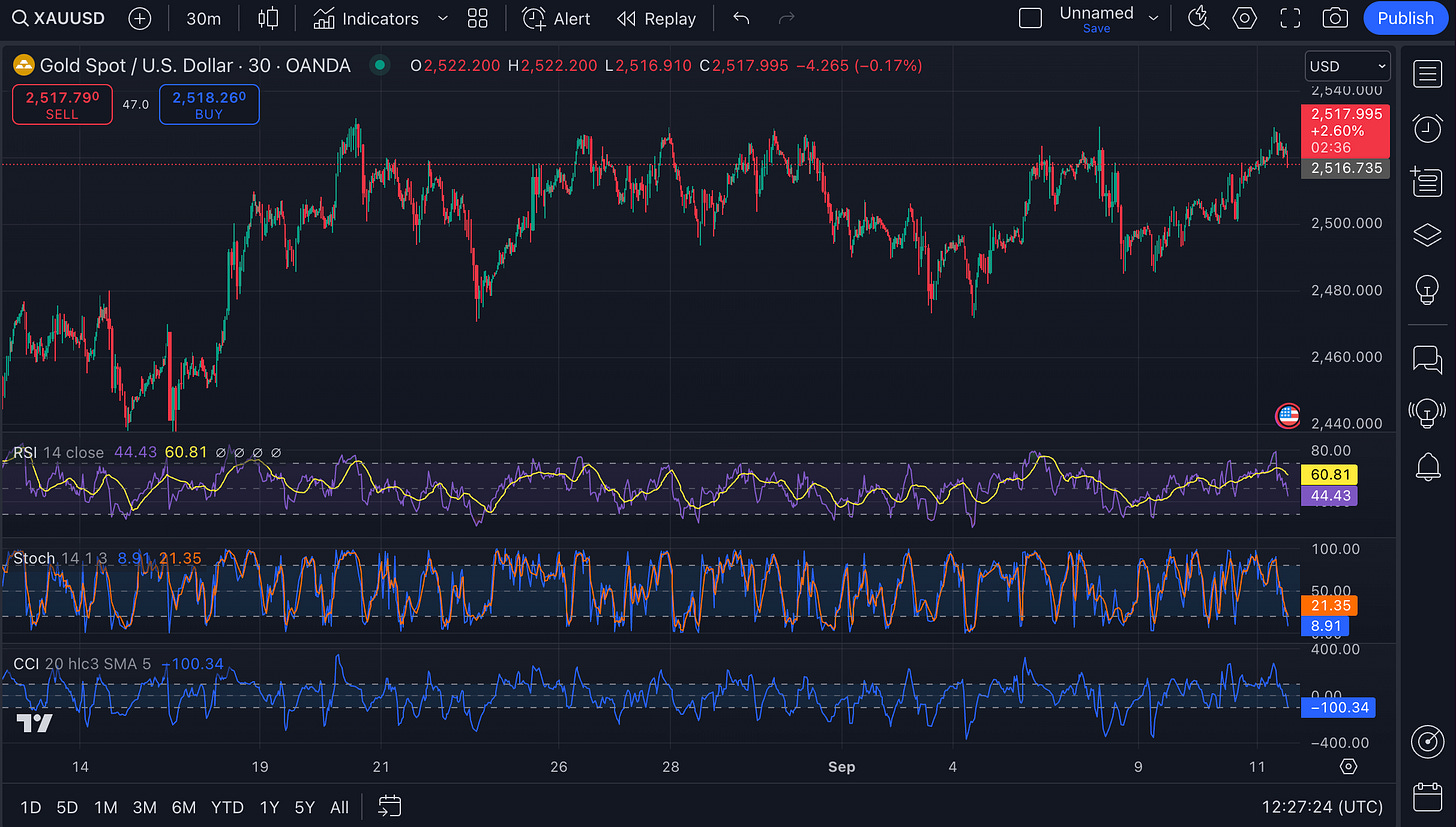
Let’s take a look at a 30-minute XAU/USD chart and what these indicators can tell us:
The SMA (50) is at $2,516.99. The price is currently hovering just above this line, which means the market is at a decision point. If the price holds above the SMA, this could support further bullish momentum. If it drops below, we might see another retest of $2,500 support level.
The MACD Line (blue) is at 1.417, and the Signal Line (orange) is at 2.023, with the histogram showing a slight negative reading of -0.606. Currently, the MACD is in a bearish crossover, with the MACD line below the signal line. But the histogram is starting to narrow, indicating that the bearish momentum could be weakening.
The ADX is at 35.13. ADX values above 25 typically indicate a trending market, with higher values pointing to stronger trends. High ADX readings show that the recent upward recovery from $2,500 has strong momentum behind it. If ADX continues to rise, it indicates the market is picking up steam, a drop could mean a weakening trend.
The RSI is currently at 60.81, which is just below the overbought threshold (70). This means that the market still has room to go higher but is approaching a level where momentum may start to slow down.
The Stochastic Oscillator shows %K at 21.35 and %D at 8.91, which are both in oversold territory (below 20). These low values indicate that the price is near the bottom of its recent range. Oversold readings in the Stochastic Oscillator often precede a bounce or small rally, which might support another attempt to break through the $2,520 level.
This contrasts with the bearish MACD crossover seen in the previous chart. The MACD indicated potential downward momentum building, but the Stochastic suggests this sell-off might be short-lived.
The CCI (Commodity Channel Index) is reading 100.34, which means Gold is entering overbought territory. This is a contrasting signal because while the Stochastic Oscillator shows oversold conditions (indicating a potential bounce), the CCI signals that the price may have rallied too fast and could face a pullback.
This divergence between indicators could mean we are in a period of consolidation, where the market is deciding its next move.
The current price is $2,512.03, slightly lower than in the previous charts, showing a minor pullback from the $2,520 region.
Bollinger Bands (BB) are based on a 20-period moving average (SMA) with two standard deviations. The upper BB is at $2,528.101 and the lower BB is at $2,515.183. The price is currently near the middle-to-lower part of the Bollinger Band range. The Bollinger Bands are currently narrow, which indicates a low volatility environment. This often precedes a breakout or breakdown because low volatility is typically followed by high volatility.
Right now, the Bollinger Bands are inside the Keltner Channels, which is a signal of consolidation - The upper KC band is $2,529.161, and the lower KC band is at $2,511.578. This condition typically suggests that a larger move in price may be coming soon (either up or down).
The consolidation seen here is a reflection of the price being unable to break above the $2,520-$2,522 resistance zone in the previous charts. This signals indecision in the market, as the price is trapped within a tight volatility band.
The ATR (14) is currently reading 4.033, which means the market is consolidating. We are not seeing the large price swings that are typically associated with major breakouts or breakdowns. However, the decreasing volatility as shown by the ATR, combined with the Bollinger Bands squeezing, indicates a potential breakout could be on the horizon.
Comparing to earlier charts: The MACD and Stochastic Oscillator in the previous charts suggested weakening momentum. Combined with the current low volatility seen in the ATR, it suggests the market is in a wait-and-see mode, but when a move comes, it could be significant. The price is hovering around key resistance, and traders are likely waiting for a trigger to either break out or fall back down.
Potential Scenarios
Bullish Breakout: If the MACD makes a bullish crossover and price breaks above the upper Bollinger Band at $2,528 and the upper Keltner Channel at $2,529 on high volume, it would signal a strong bullish breakout. In this case, we could see the price move toward $2,540 or even $2,560.
The tightening Bollinger Bands suggests a potential for volatility expansion, meaning the market is likely to make a strong move in one direction. For the bullish case, we’d need to see the bands widen with price moving above $2,520 decisively.
Bearish Breakdown: On the other hand, if the price falls below the 50-SMA, the lower Bollinger Band and lower Keltner Channel (around $2,511), this could signal a bearish breakdown. A move below this level could bring the price back to the previous support at $2,500 or even lower.
In the previous charts, we saw bearish signals from the MACD and CCI indicating potential weakness, which could align with this potential breakdown.
Never rely on just one type of indicator or signal
I've found that combining different types of indicators - say, a trend indicator with a momentum indicator and volume - often provides the most reliable signals.
For example, I might look for a golden cross (when the 50-day moving average crosses above the 200-day moving average) in conjunction with an RSI reading coming out of oversold territory and significant volume as a strong bullish signal for Gold.
In the next lesson, we will be looking closely at Moving Averages and how to use them as a part of your trading strategy.
Safe trading,
and remember: All that glitters is not Gold,
Joe


