Technical Analysis Course #6: using trendlines to time your entries like a pro -> high confluence areas in trading
Hello, fellow traders and welcome to the lesson #6 of the Technical Analysis course.
Today we’re talking about the secrets of trendline trading.
By the end of this lesson, you'll be able to:
see through market noise and identify true trends by drawing accurate trendlines
recognize high confluence areas with rich trading potential
time your entries and exits like a pro by combining trendlines with patterns, key levels, and Fibonacci.
If you like my writing, please leave a like and/or a comment and share it with your trader colleagues!
As always, I’ll be using the XAU/USD chart, tons of visuals, the TradingView platform (and it’s awesome autocharting function) to illustrate all the concepts.
What is a Trendline?
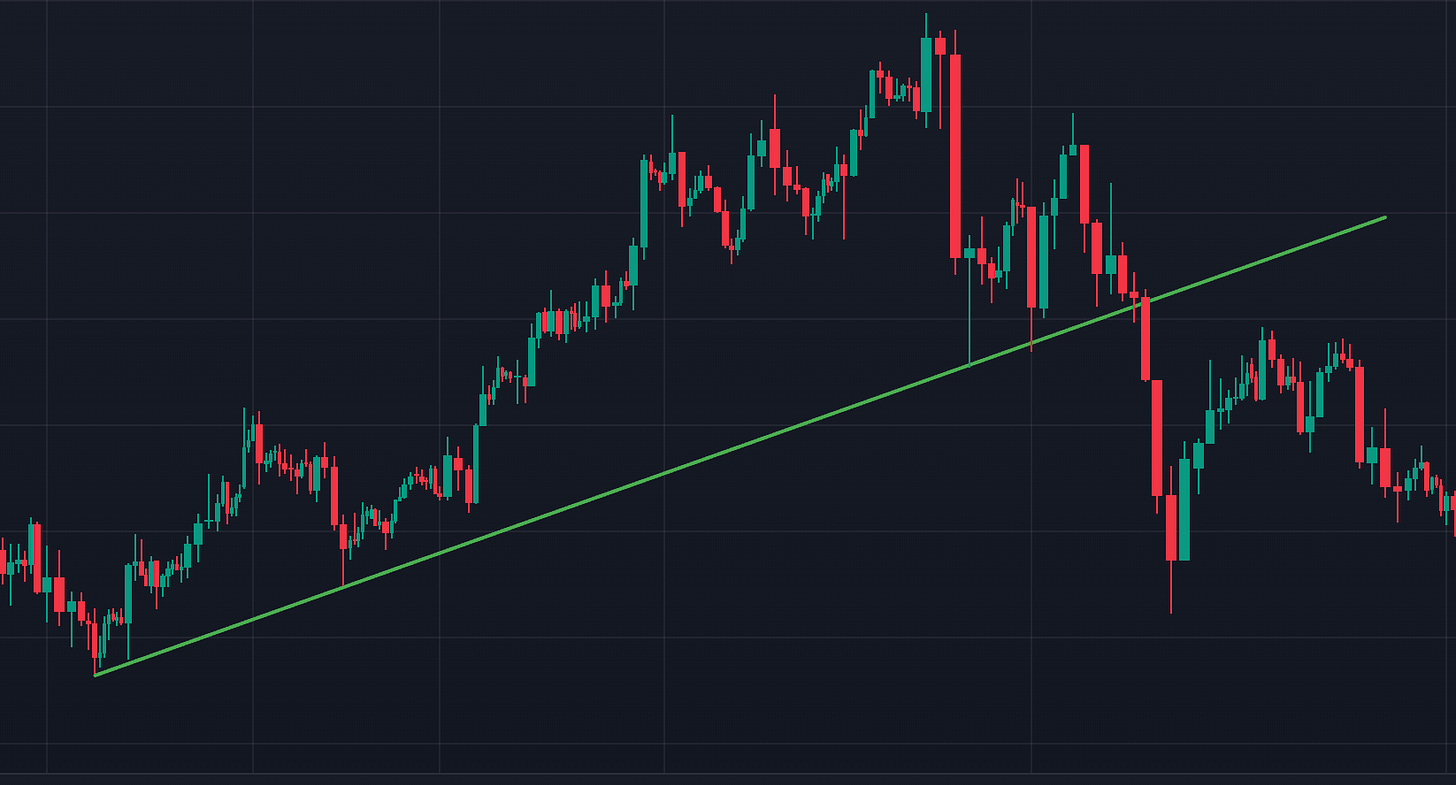
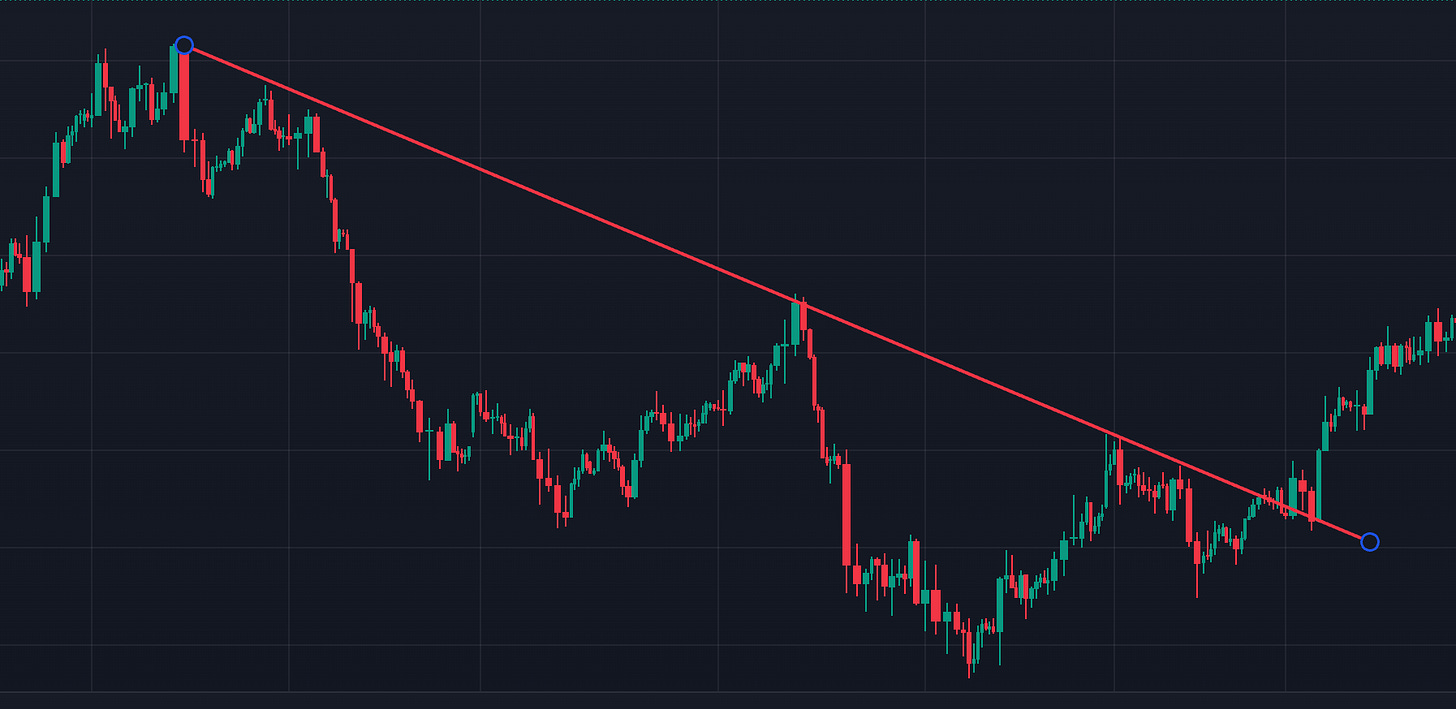
A trendline is a straight line that connects two or more price points on a chart. It helps you see the general direction of the market, whether it’s going up, down, or moving sideways. It's also used to identify potential support or resistance levels.
In an uptrend, trendlines connect the lows, while in a downtrend, they connect the highs
Now, here’s an important tip for a valid trendline
A valid trendline requires at least three touch points. The third touch acts as confirmation that the trendline isn’t just a fluke.
You could potentially start trading after the second touch, but
Keep reading with a 7-day free trial
Subscribe to The Gold Trader to keep reading this post and get 7 days of free access to the full post archives.


