
Technical Analysis Course #5: Anticipate and exploit crowd behavior with chart pattern analysis -> 10+ powerful patterns + using correlated markets to time your trades

Hello, fellow traders and welcome to the lesson #5 of the Technical Analysis course.
By the end of this lesson, you'll be able to:
Identify and trade 10+ powerful chart patterns in the Gold market
Read the Gold market's mood and anticipate its next move
Time your entries and exits for maximum gains and minimum losses
Confirm your analysis using candlesticks and volume
Spot opportunities across various timeframes and correlated markets
If you like my writing, please leave a like and/or a comment and share it with your trader friends!
As always, I’ll be using the XAU/USD chart, tons of visuals, the TradingView platform (and it’s awesome autocharting function) to illustrate all the concepts.
There are roughly two categories of chart patterns:
Continuation patterns
the current trend is likely to continue after a period of consolidation;
useful for identifying potential entry points in the direction of the existing trend.
Reversal patterns
the current trend is likely to change direction;
crucial for spotting potential turning points in the market.
Continuation Patterns
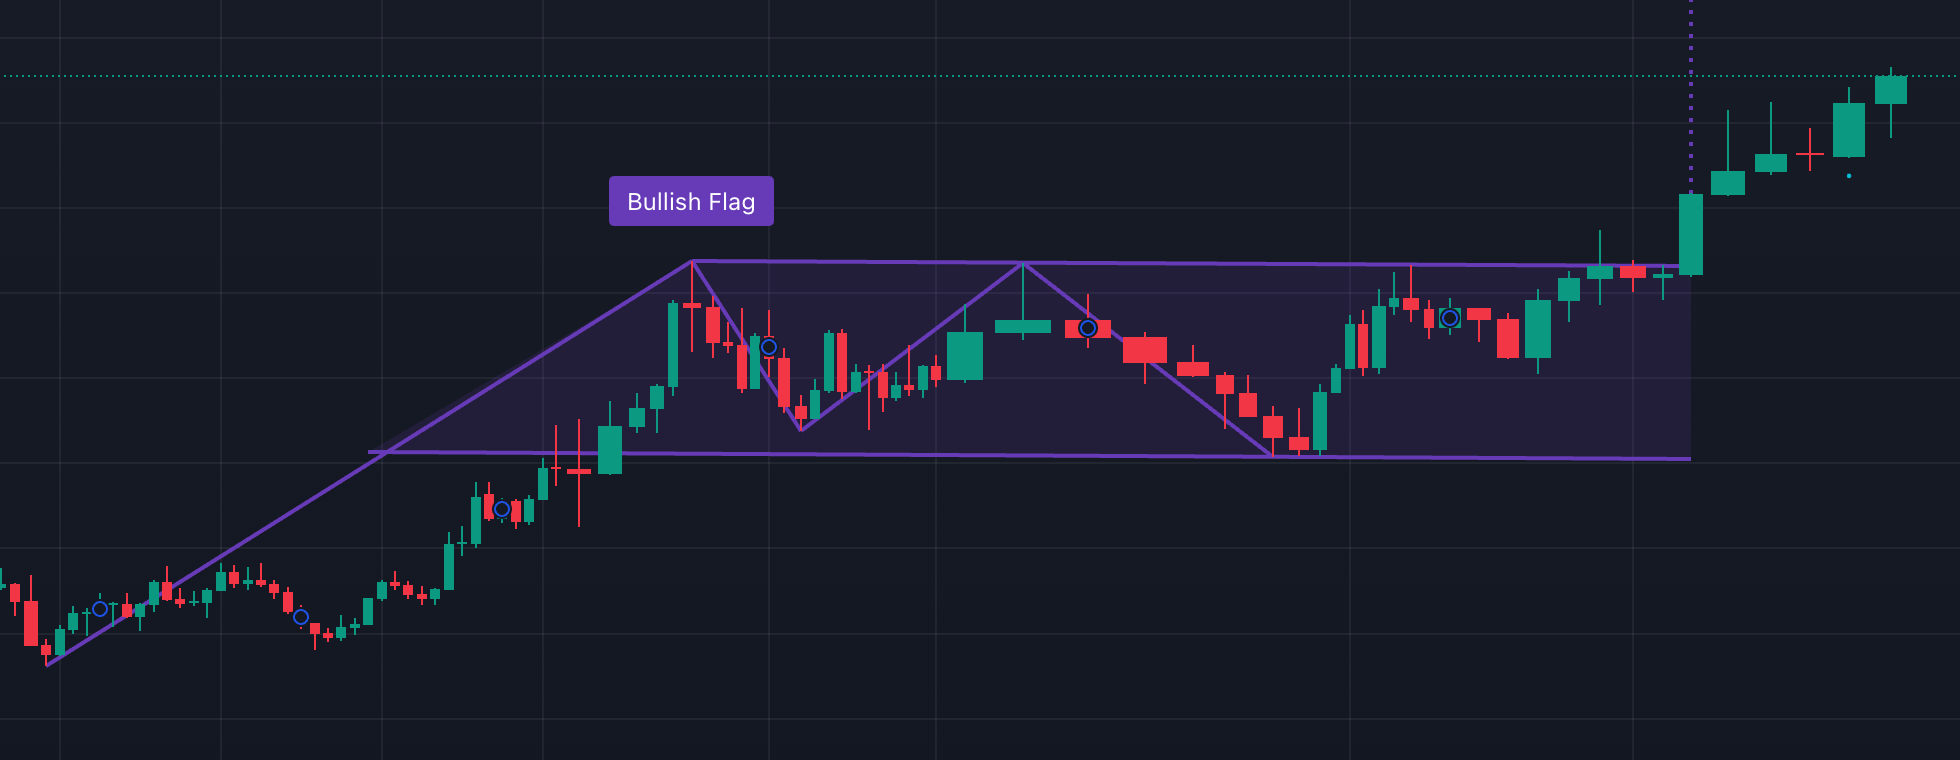
1. Bullish Flag/Pennant
Context: forms during an uptrend and means the upward trend will continue after a brief pause.
Identification: the upward line represents the flagpole, and the formation that follows is the flag or pennant.
Entry points: 1) pullback after the flagpole formation; 2) when the price breaks above the upper trendline of the flag.
Exit point: set a target equal to the height of the flagpole, measured from the breakout point.
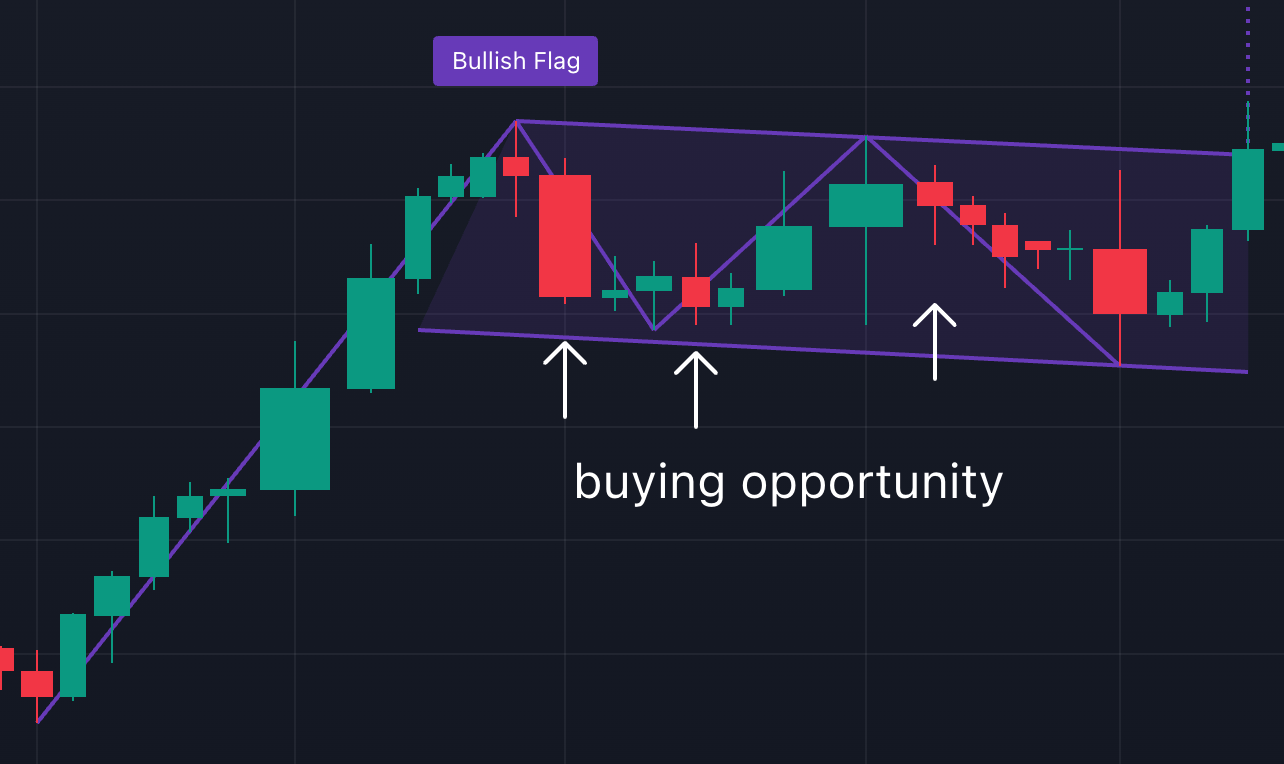
Explanation: When Gold rises in price quickly, the short-term trend gets exhausted. At some point, buyers stop pushing the price higher, and some might start taking profits. This leads to a small decline and usually results in red candle formation. However, these red candles have small bodies, indicating a minor pullback rather than a major reversal. This controlled decline is often a buying opportunity.
The bull flag typically includes a pullback of one to three candles. Ideally, the pullback doesn't exceed
50% of the initial move. If the pullback retraces more than 50%, or if we see a long red candle, the pattern is likely broken and not as reliable. Similarly, if there are too many red candles in the pullback, it suggests that the trend is losing steam.
Look at the different candle shapes:
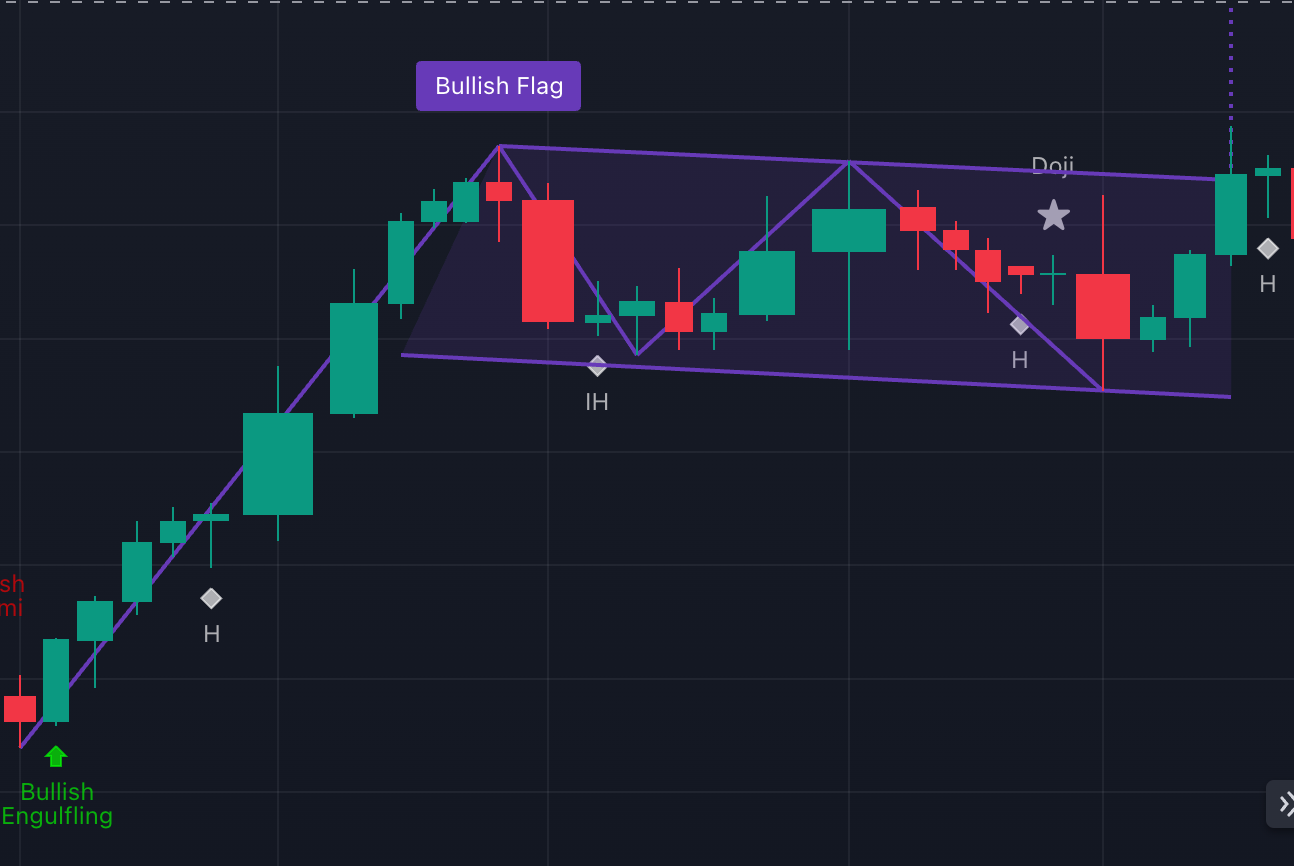
a Bullish Engulfling at the base of the flagpole, indicating a potential upward reversal;
a hammer, showing that buyers stepped in and pushed the price higher;
long green candles, which make up the bulk of the upward move
inverted hammer and doji, signaling seller’s pressure and indecision, during the flag formation.
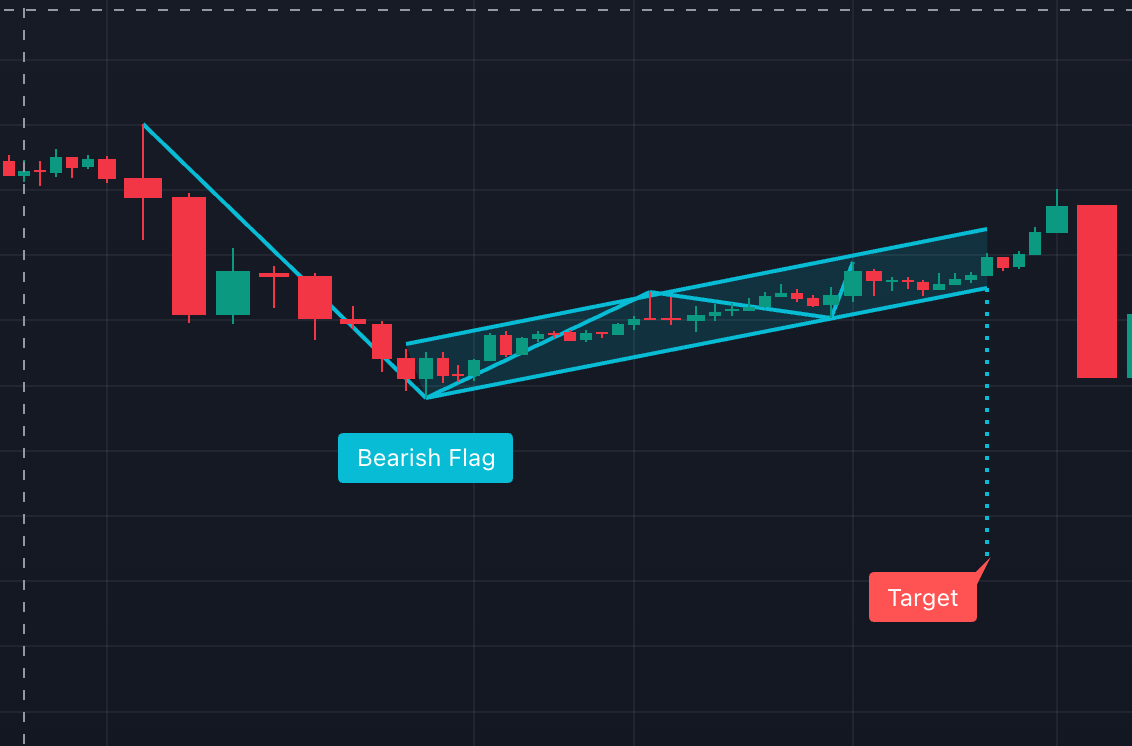
2. Bearish Flag/Pennant
Context: forms during a downtrend and often means the downtrend will continue after a brief pause.
Identification: a downward line that forms a flagpole + a slight upward or sideways consolidation - the flag.
Entry point: go short when the price breaks below the lower trendline of the flag.
Exit point: set a target equal to the height of the flagpole, measured from the breakout point. This gives you a rough estimate of where the price might move before finding support or reversing.
Explanation: Sellers gain control and push the price down aggressively. This could be triggered by various factors like strong economic data or a strengthening dollar. After the sharp decline, some sellers start taking profits, temporarily easing the selling pressure.
Some buyers, thinking the price might have fallen too far too fast, start entering the market, which leads to
Keep reading with a 7-day free trial
Subscribe to The Gold Trader to keep reading this post and get 7 days of free access to the full post archives.