
Technical Analysis Course #4: using candlestick analysis to predict market reversals + 8 most common patterns explained

Hello, fellow traders and welcome to the lesson #4 of the Technical Analysis course.
Today, we’ll cover in detail candlesticks and reading them to:
easily assess market sentiment at a glance
spot extremes of emotion (and predict reversals)
identify strategic market turning points
plan your entries and exits.
If you like my writing, please leave a like and/or a comment and share it with your trader friends!
As always, I’ll be using the XAU/USD chart, tons of visuals, and the TradingView platform to illustrate all the concepts.
Reading candlesticks (is easy!)
A single candlestick, like a traditional price bar, represents trading activity over a specific time period.
A candlestick consists of two parts:
The body (or real body)
The shadows (or wicks)
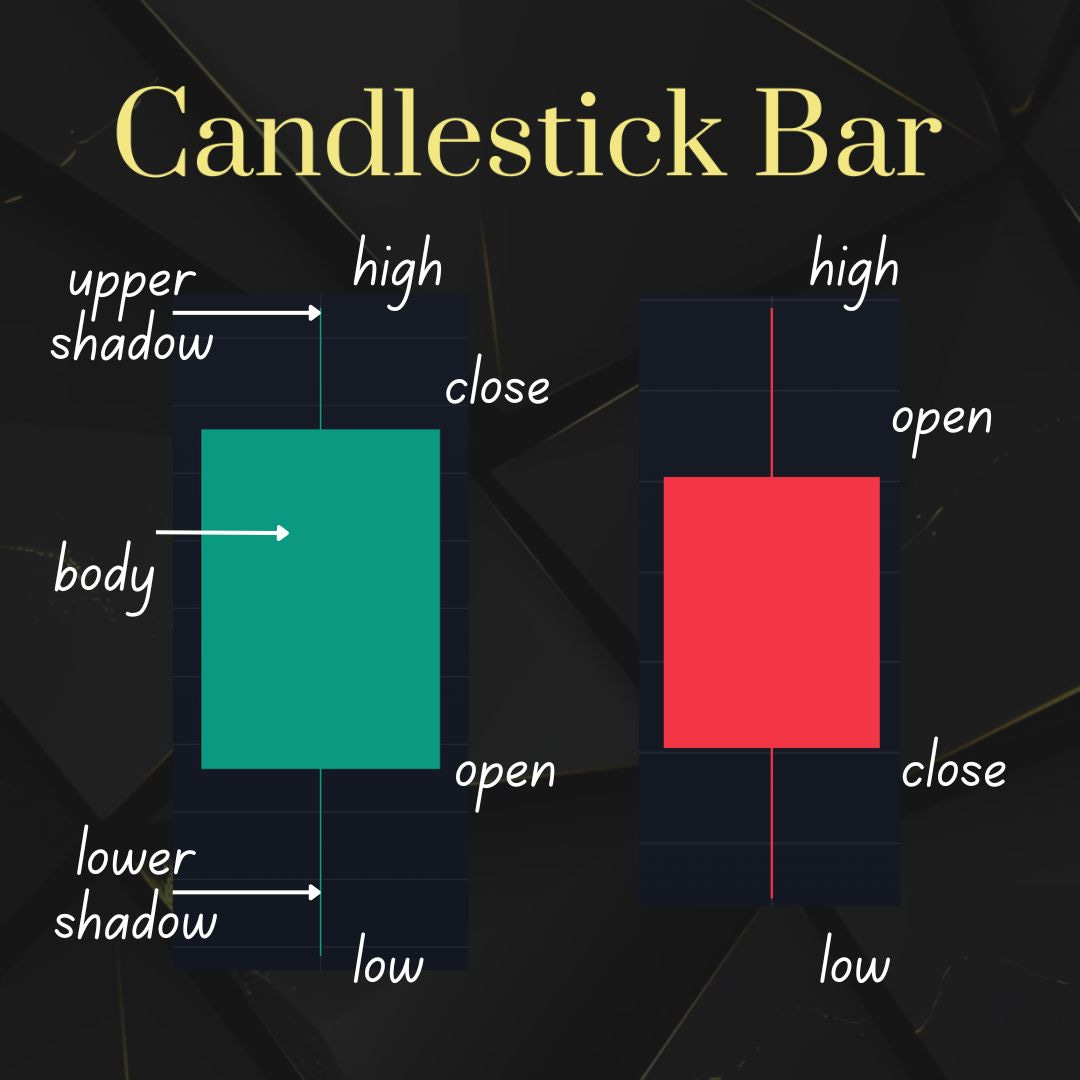
The body is the wide part of the candlestick. It shows the range between the opening and closing prices.
Closing price > opening price = green body. The longer the green body, the more bullish it is.
Closing price < opening price = red body. Again, the longer the red body, the more bearish it is.
The shadows are the thin lines extending above and below the body. The upper shadow represents the highest price reached during the period, while the lower shadow the lowest price - basically they show the trading range.
Candlesticks show bulls vs. bears battle result
Candlesticks give us a quick visual sense of market sentiment:
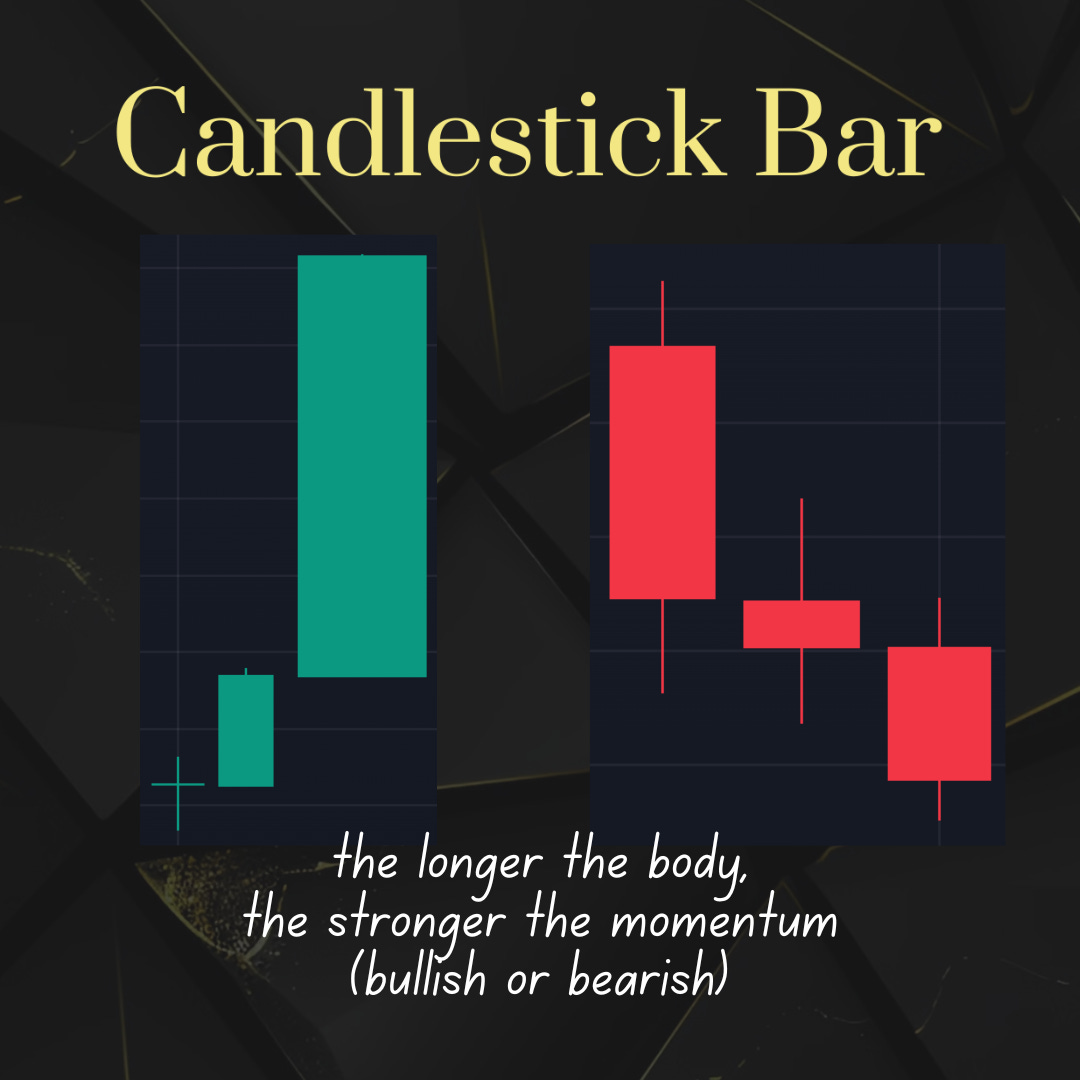
A long green candlestick with short shadows suggests strong bullish sentiment. Buyers-bulls were in control for most of the period.
A long red candlestick with short shadows show strong bearish sentiment. Sellers-bears were in control for most of the period.
A candlestick with a small body and long shadows suggests indecision in the market. The price moved significantly in both directions, but closed near where it opened.
Three “special” candlesticks
These candlesticks will help you assess the market sentiment at a single glance at a chart.
These are
Keep reading with a 7-day free trial
Subscribe to The Gold Trader to keep reading this post and get 7 days of free access to the full post archives.