
Technical Analysis Course #2: Volume speaks louder than charts --> 5 volume indicators explained + how to use pivot points

Hello, fellow traders and welcome to the #2 lesson of the Technical Analysis course.
Today, we’ll cover in detail:
why volume is one of the most powerful indicators out there
4 key volume patterns that will give you a significant edge in predicting Gold price movements
5 most useful volume indicators, how and when exactly to use them
my favorite volume combinations to get a comprehensive picture of market dynamics
how to use pivot days and pivot days to spot potential trend reversals and high-probability entry points that most traders miss
how to combine pivot points with volume analysis and time your trades with precision.
If you like my writing, please leave a like and/or a comment and share it with your trader friends!
As always, I’ll be using the XAU/USD chart and the TradingView platform to illustrate all the concepts.
PART 1: Volume Is The Most Powerful Indicator
Volume measures the number of trades made in a specific period.
It helps us gauge traders participation and their pressure on the price and confirm trends or trend reversals we see in price charts.
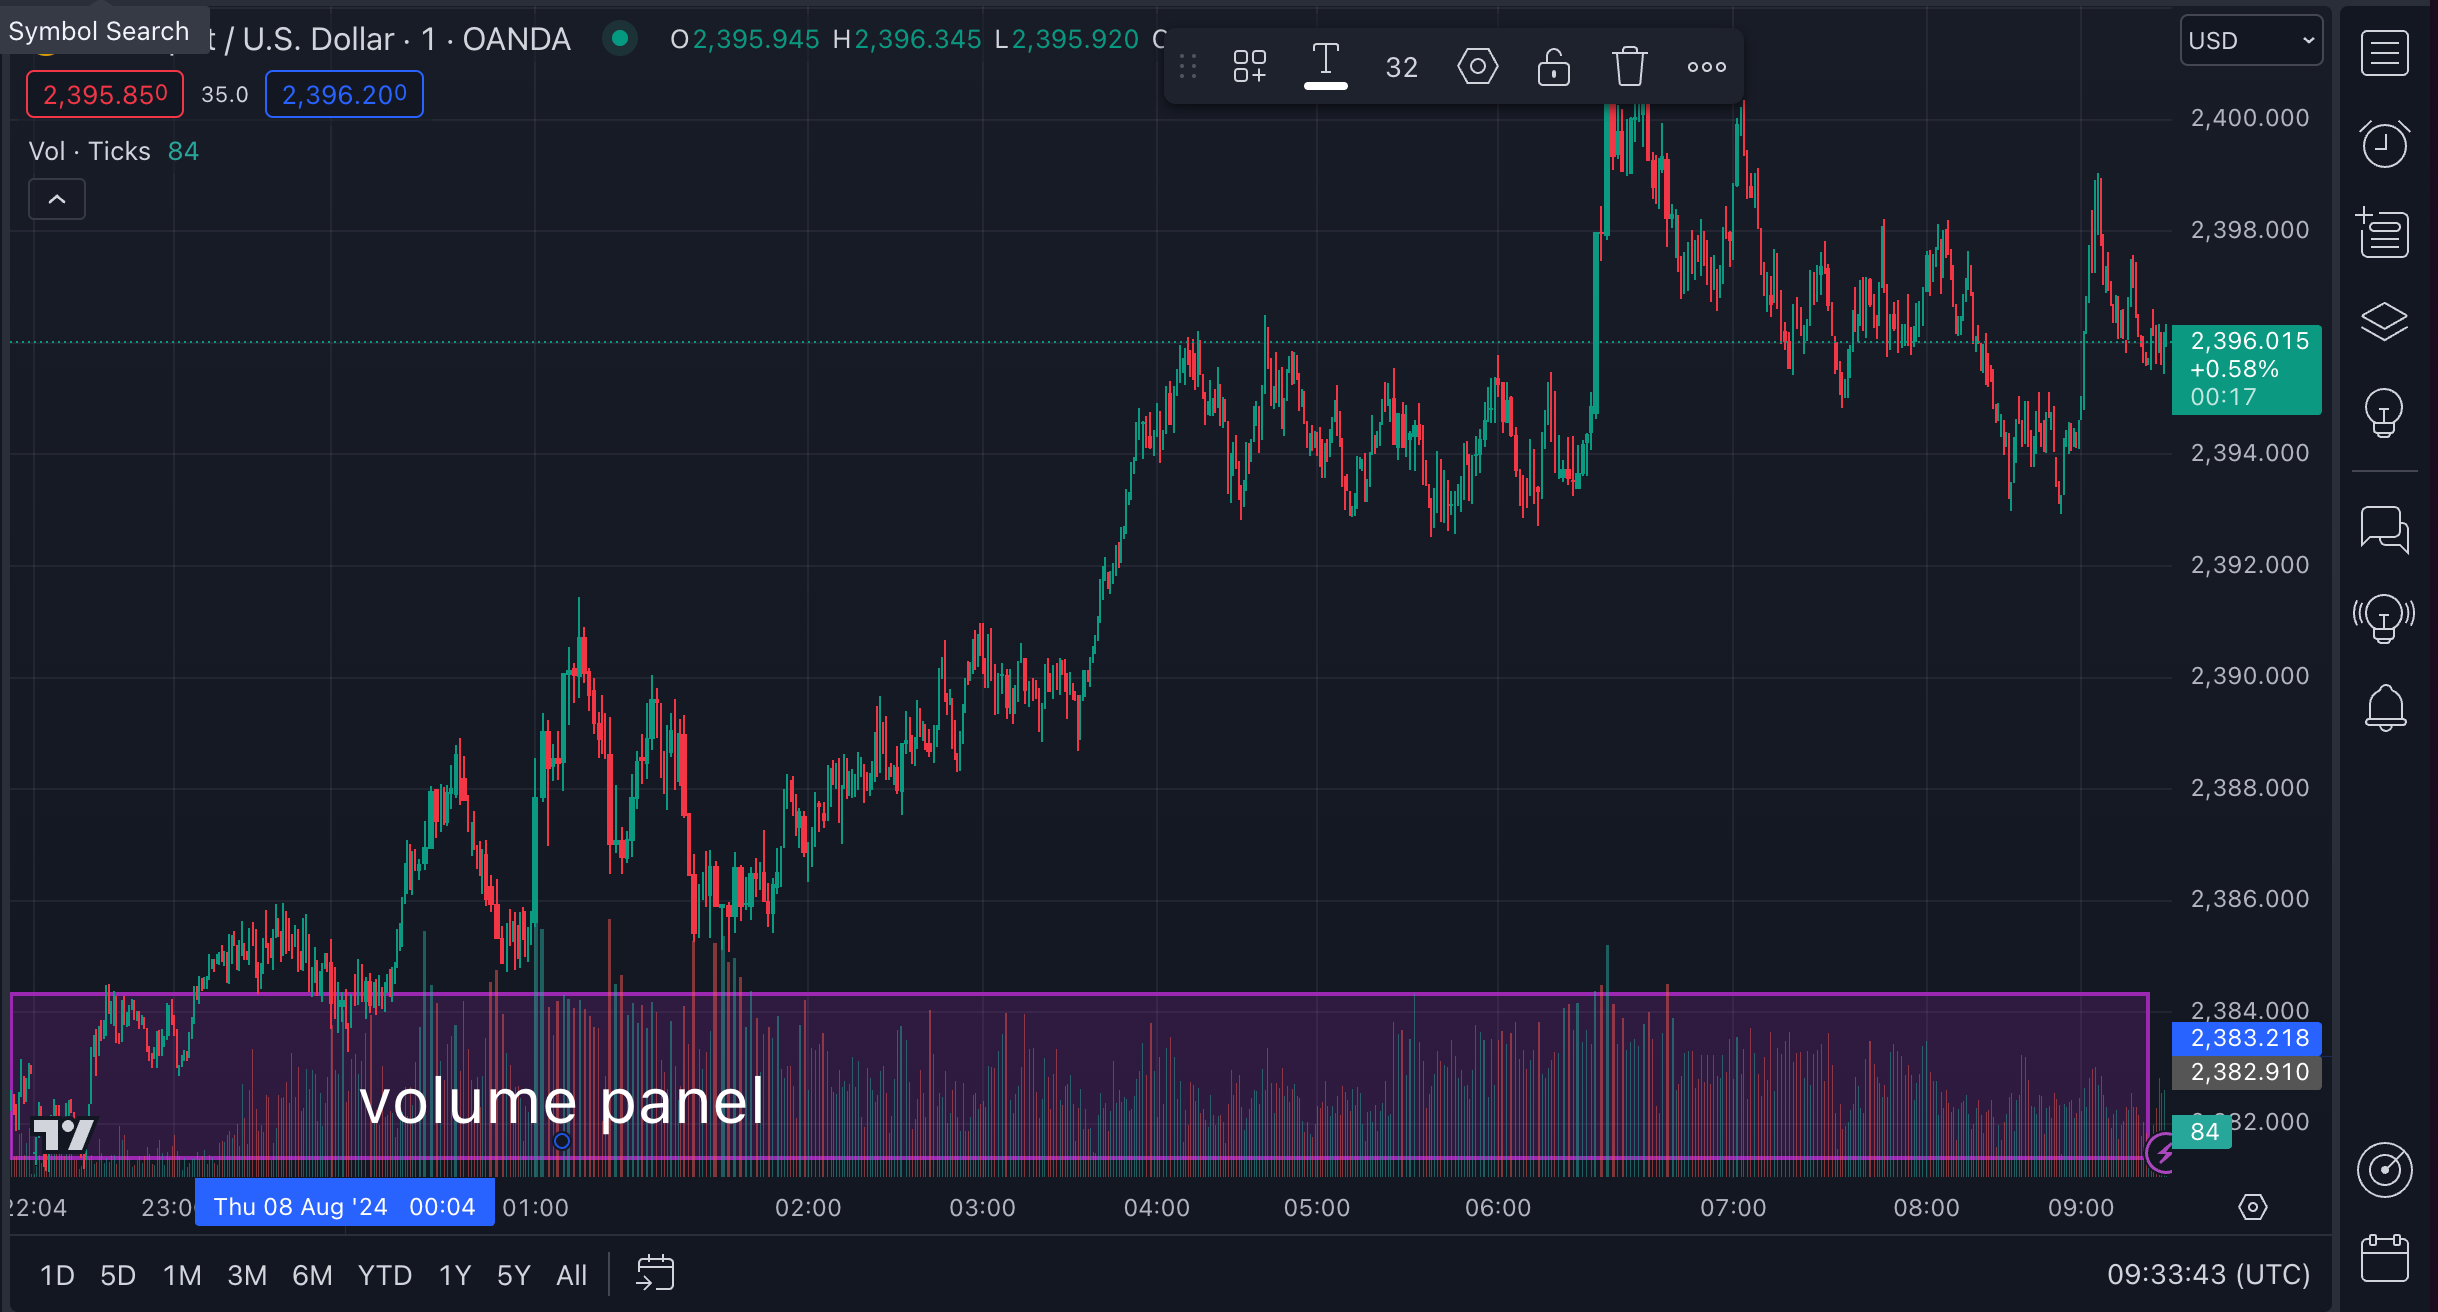
If rising prices come with increasing volume, it clearly shows that we’re not seeing an anomaly or someone’s mistake, but that the buyers are actively participating and driving the price up or down. In simple terms, volume should go up or expand in the direction of the current price trend.
You will often hear the phrase “Volume precedes price” in technical analysis. This means that changes in volume often happen before price changes, e.g. dropping volume in an uptrend might signal a future price drop.
4 Key Price+Volume Patterns
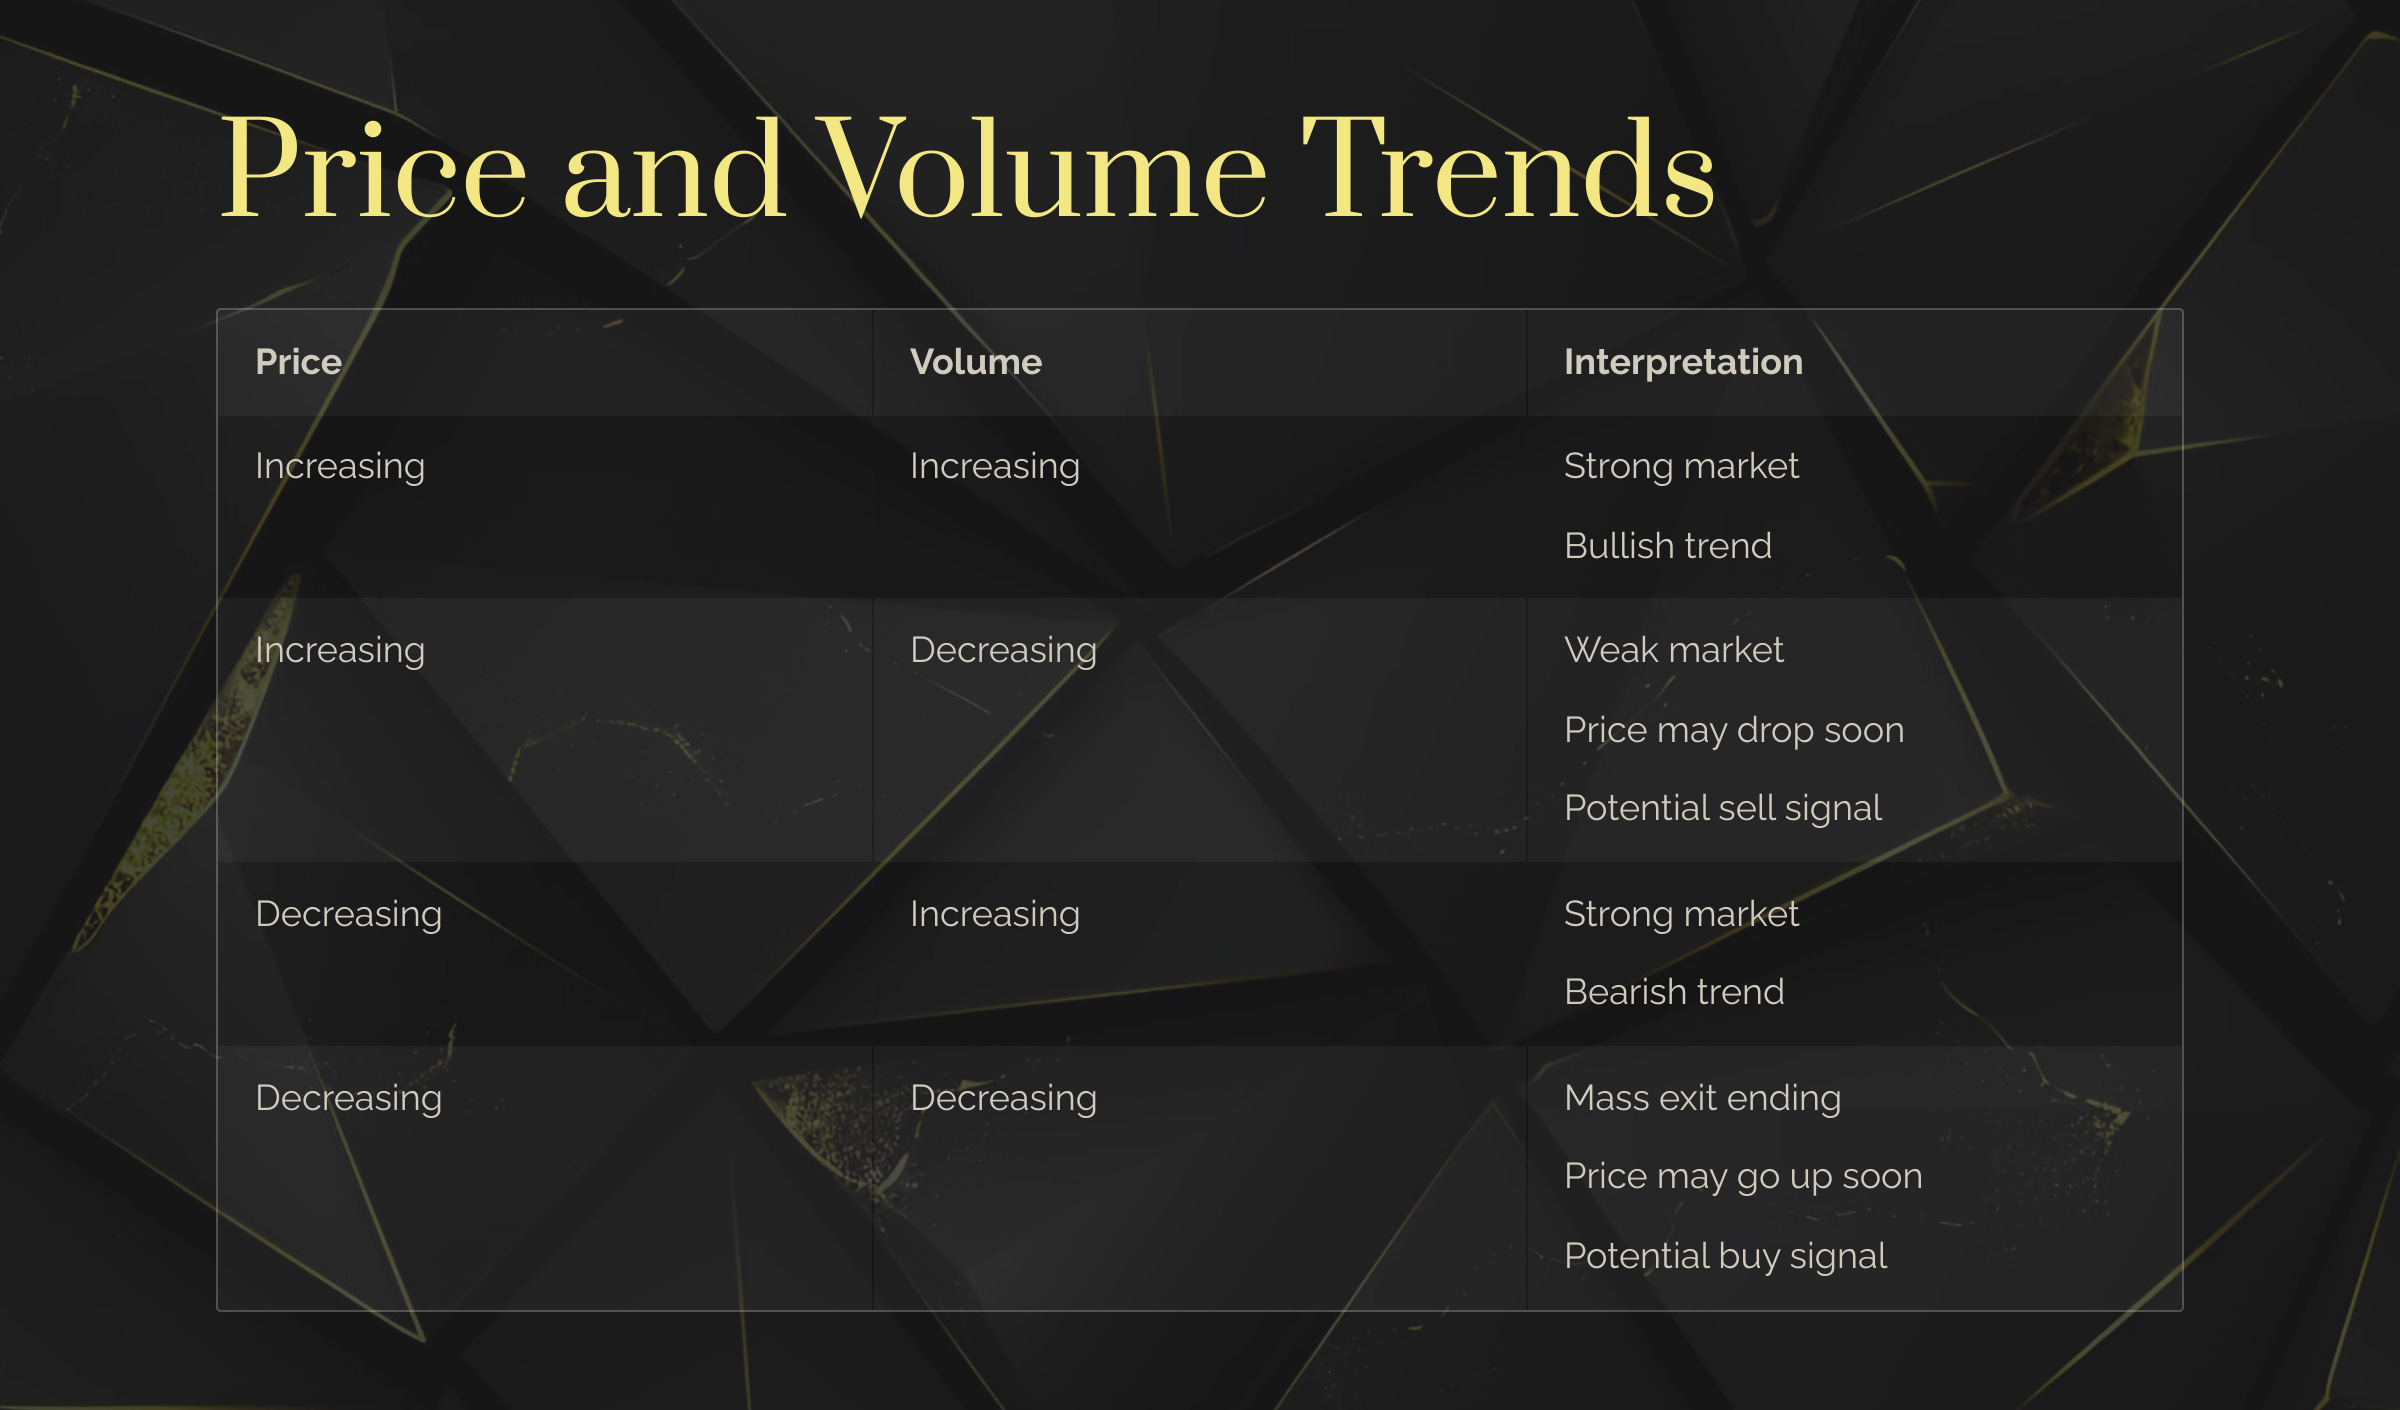
Rising price + increasing volume: More trades at the ask price, indicating aggressive buyers. The uptrend will likely continue.
Rising price + decreasing volume: Suggests a weak market. The buyers pushing the price up are losing steam and the price will likely reverse soon.
Price drop + increasing volume: More trades at the bid price, suggesting aggressive sellers. The downtrend is gaining strength.
Price drop + decreasing volume: The mass exit might be coming to an end. It might be a signal to buy back in.
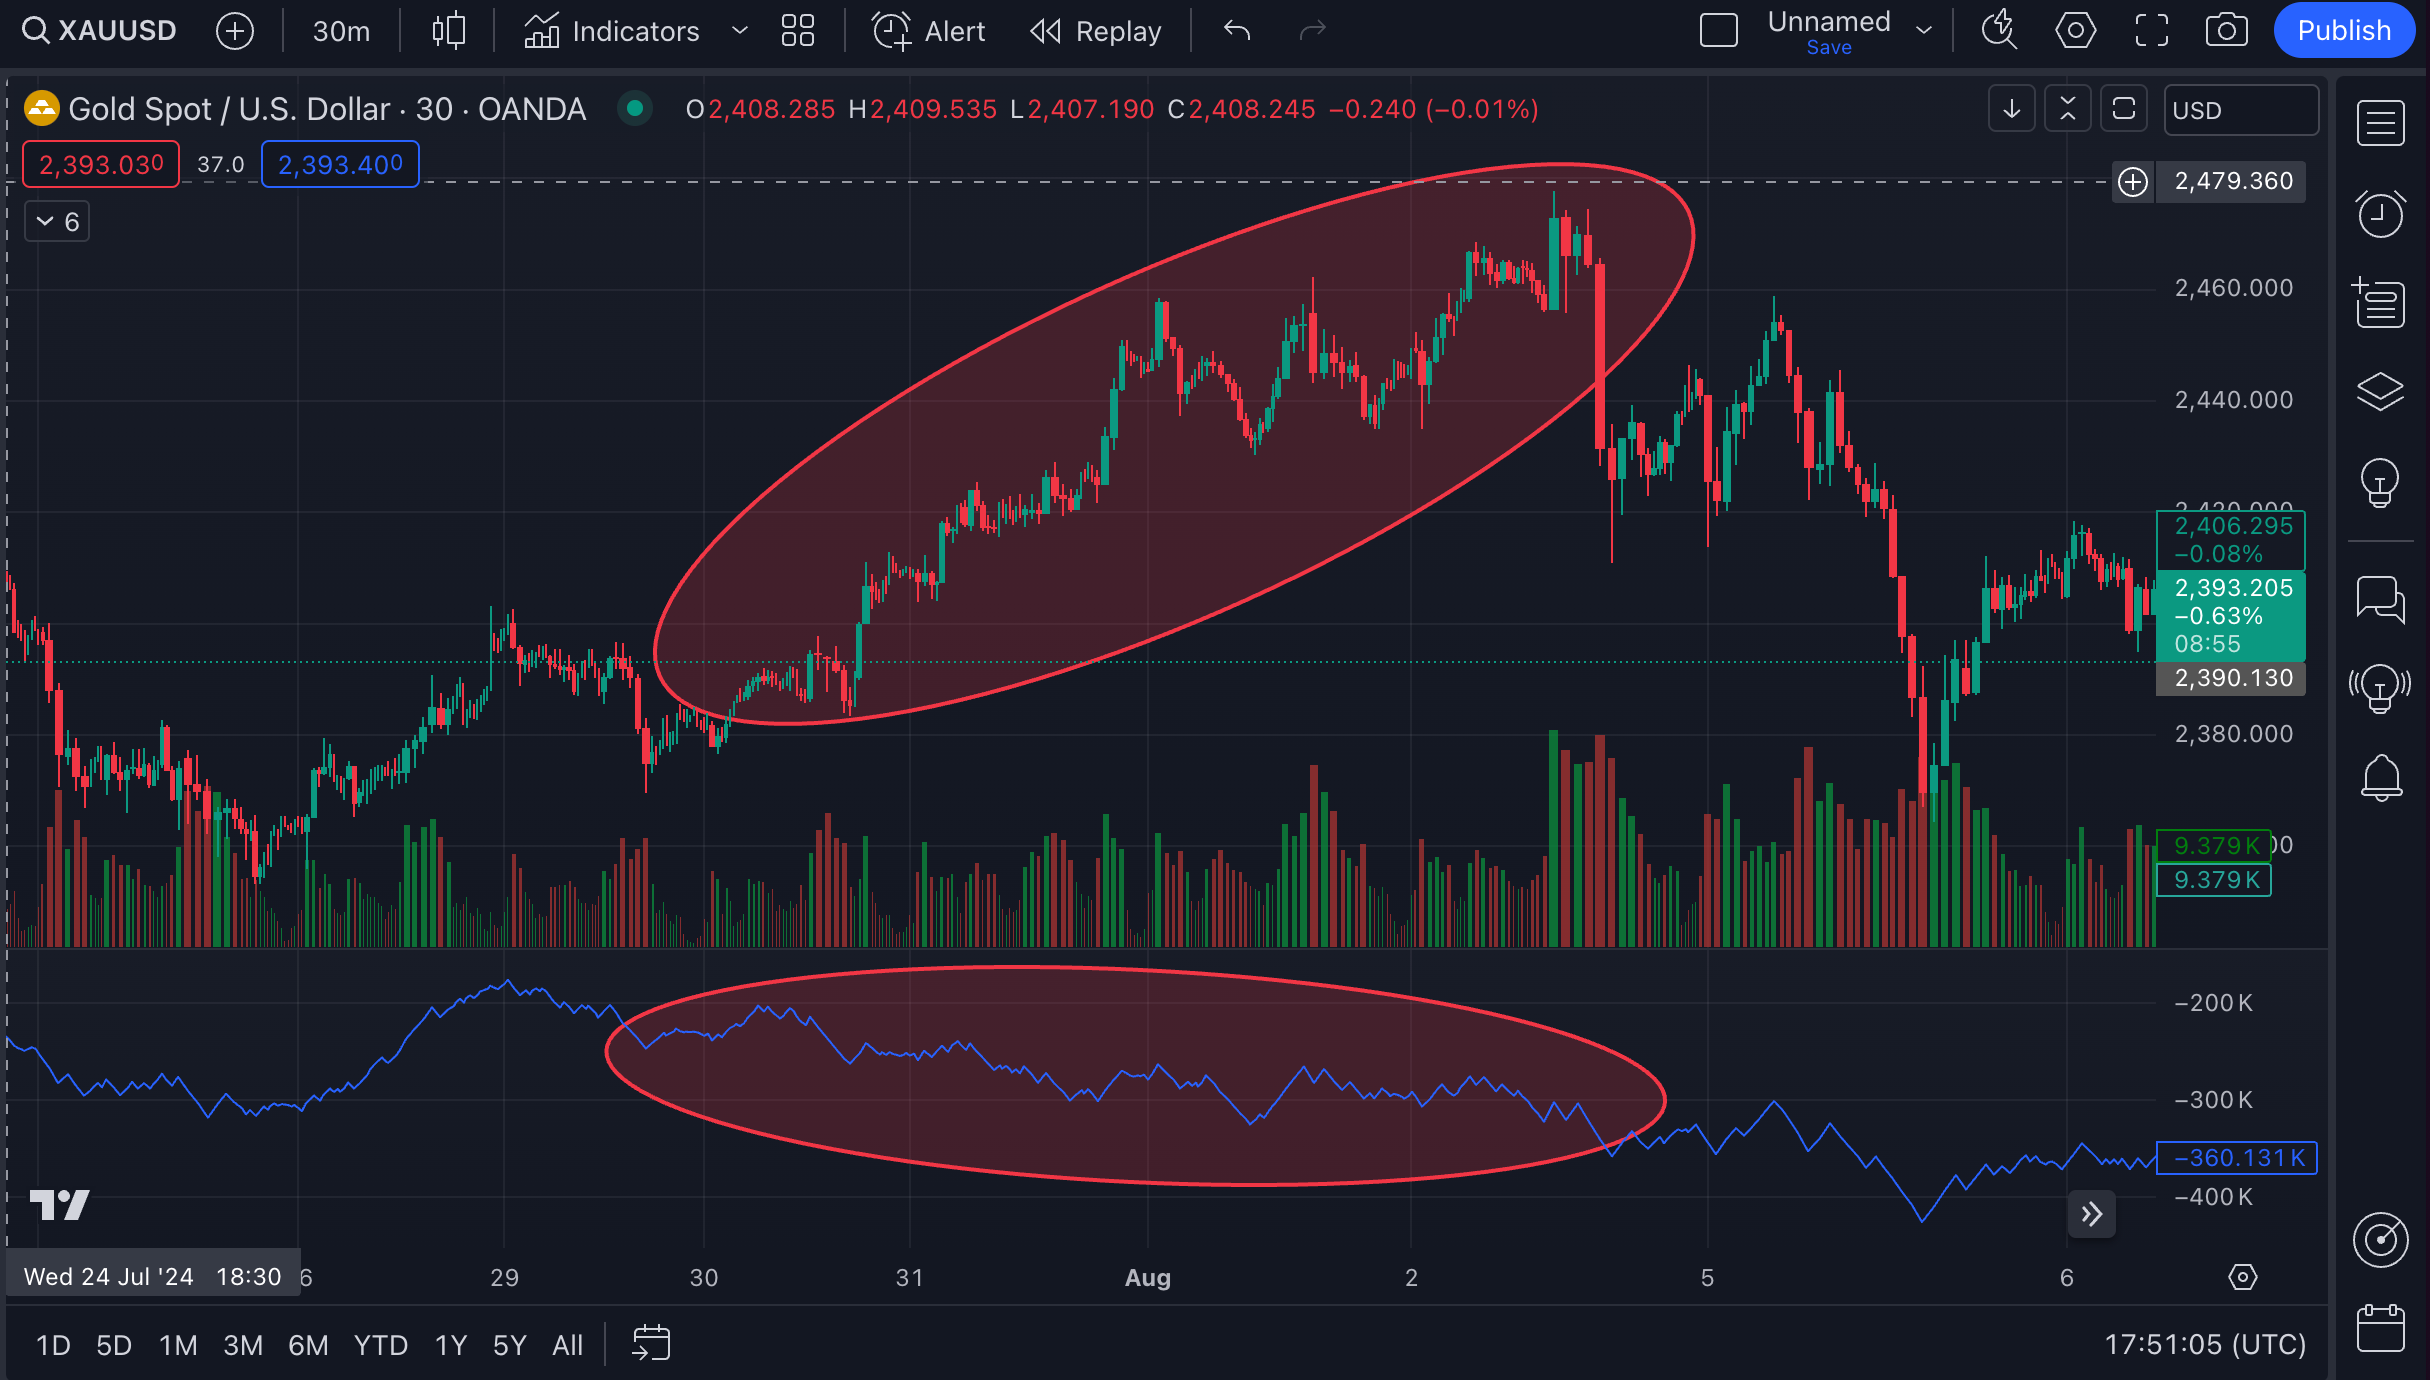
When looking for divergence, we're checking if a new price high happens with decreasing volume. This suggests the crowd has exhausted its buying power.
If volume increases during price dips, it can be a sign that the uptrend is in trouble and it’s a good time to check other indicators and think about taking profits.
5 Most Useful Volume Indicators + How To Use Them
1/ On-Balance Volume (OBV)
Best timeframes: Daily and weekly charts
How it works:
OBV adds volume on up days and subtracts volume on down days.
It creates a running total line that shows buying and selling pressure over time.
How to use it for XAU/USD:
Look for divergences between OBV and gold price. OBV line should move in the same direction as the price trend.
If gold price is making new highs but OBV isn't, it might indicate weakness in the uptrend.
If gold is making new lows but OBV isn't, it could suggest the downtrend is losing steam.
Combine with:
Pair OBV with price action analysis on daily charts.
Use alongside moving averages to confirm trend strength.
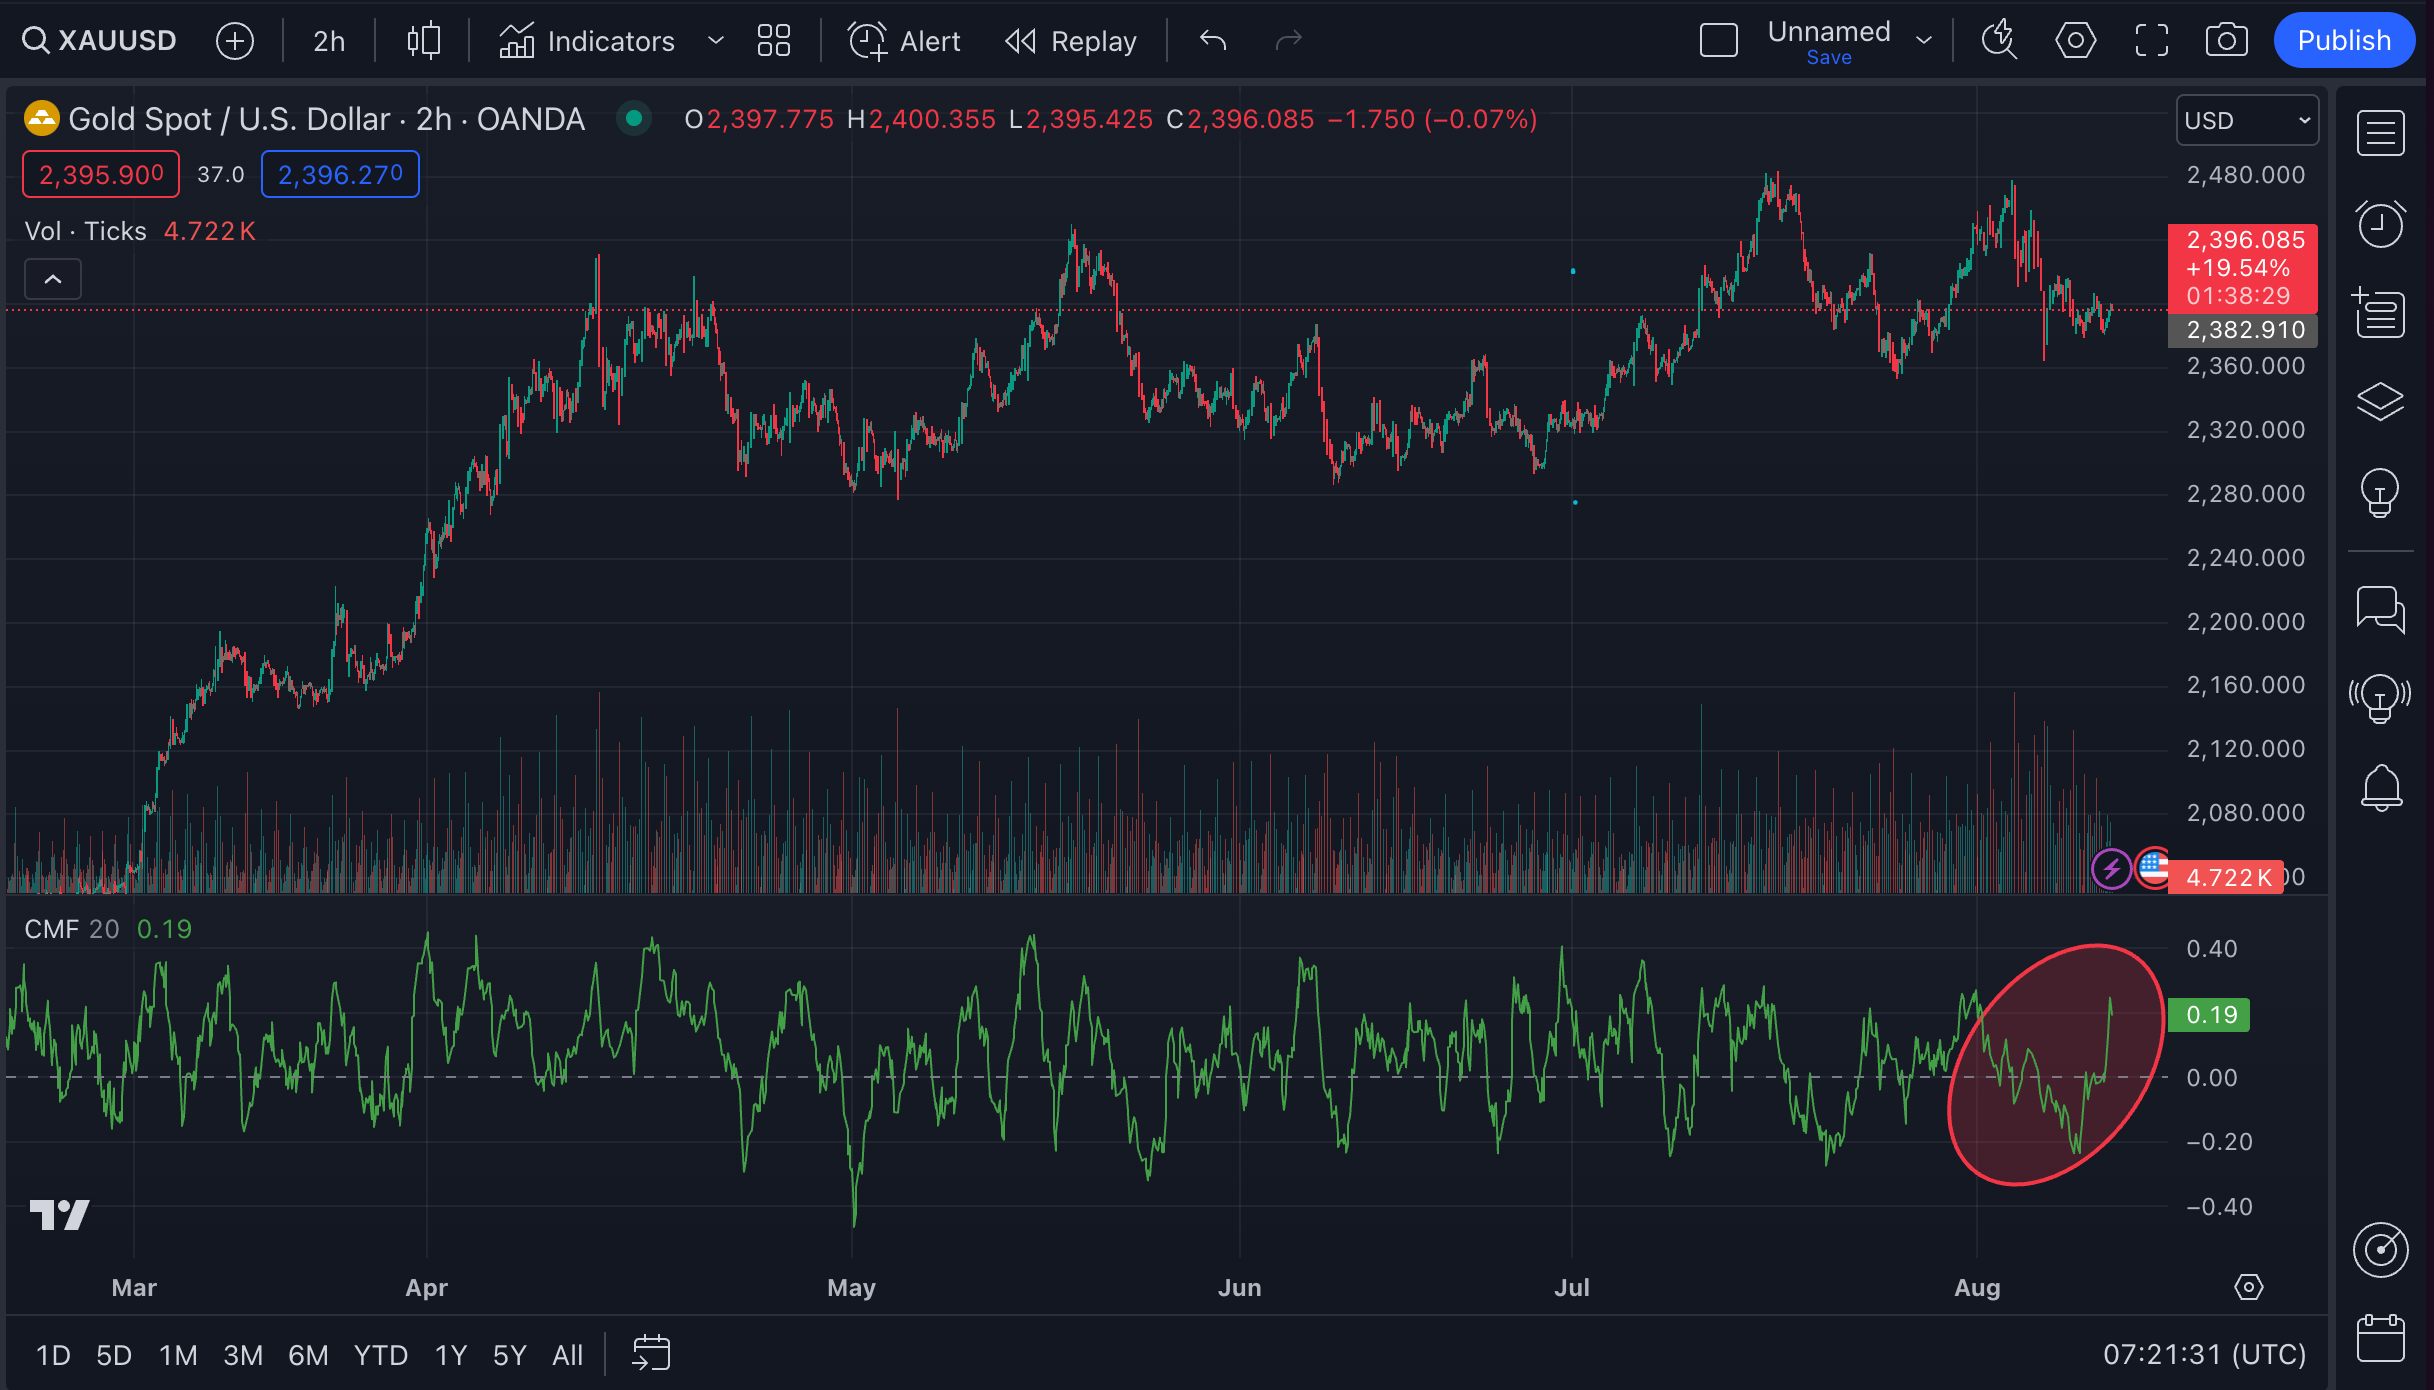
2/ Chaikin Money Flow (CMF)
Best timeframes: 4-hour and daily charts
How it works:
CMF measures buying and selling pressure over a set period (usually 20-21 days).
It combines volume with price location within the period's range.
How to use it for XAU/USD:
CMF oscillates above and below zero.
When CMF is above zero, it indicates buying pressure in gold. When CMF is below zero, it suggests selling pressure.
Look for CMF divergences with gold price for potential reversals and to confirm trend strength. A strong uptrend in gold should see consistently positive CMF values.
Combine with:
Use CMF with support and resistance levels to gauge the likelihood of breakouts.
Combine with RSI (Relative Strength Index) for a comprehensive view of momentum and volume.
3/ Volume-Weighted Average Price (VWAP)
Best timeframes: Intraday charts (5-minute, 15-minute, 1-hour)
How it works:
VWAP calculates the average price of gold weighted by volume.
It's typically used as an intraday indicator.
How to use it for XAU/USD:
Keep reading with a 7-day free trial
Subscribe to The Gold Trader to keep reading this post and get 7 days of free access to the full post archives.