
Technical Analysis Course #11: Understanding volatility and mean reversion + sample trading strategy using Bollinger Bands

Hello, fellow traders and welcome to the lesson #11 of the Technical Analysis course.
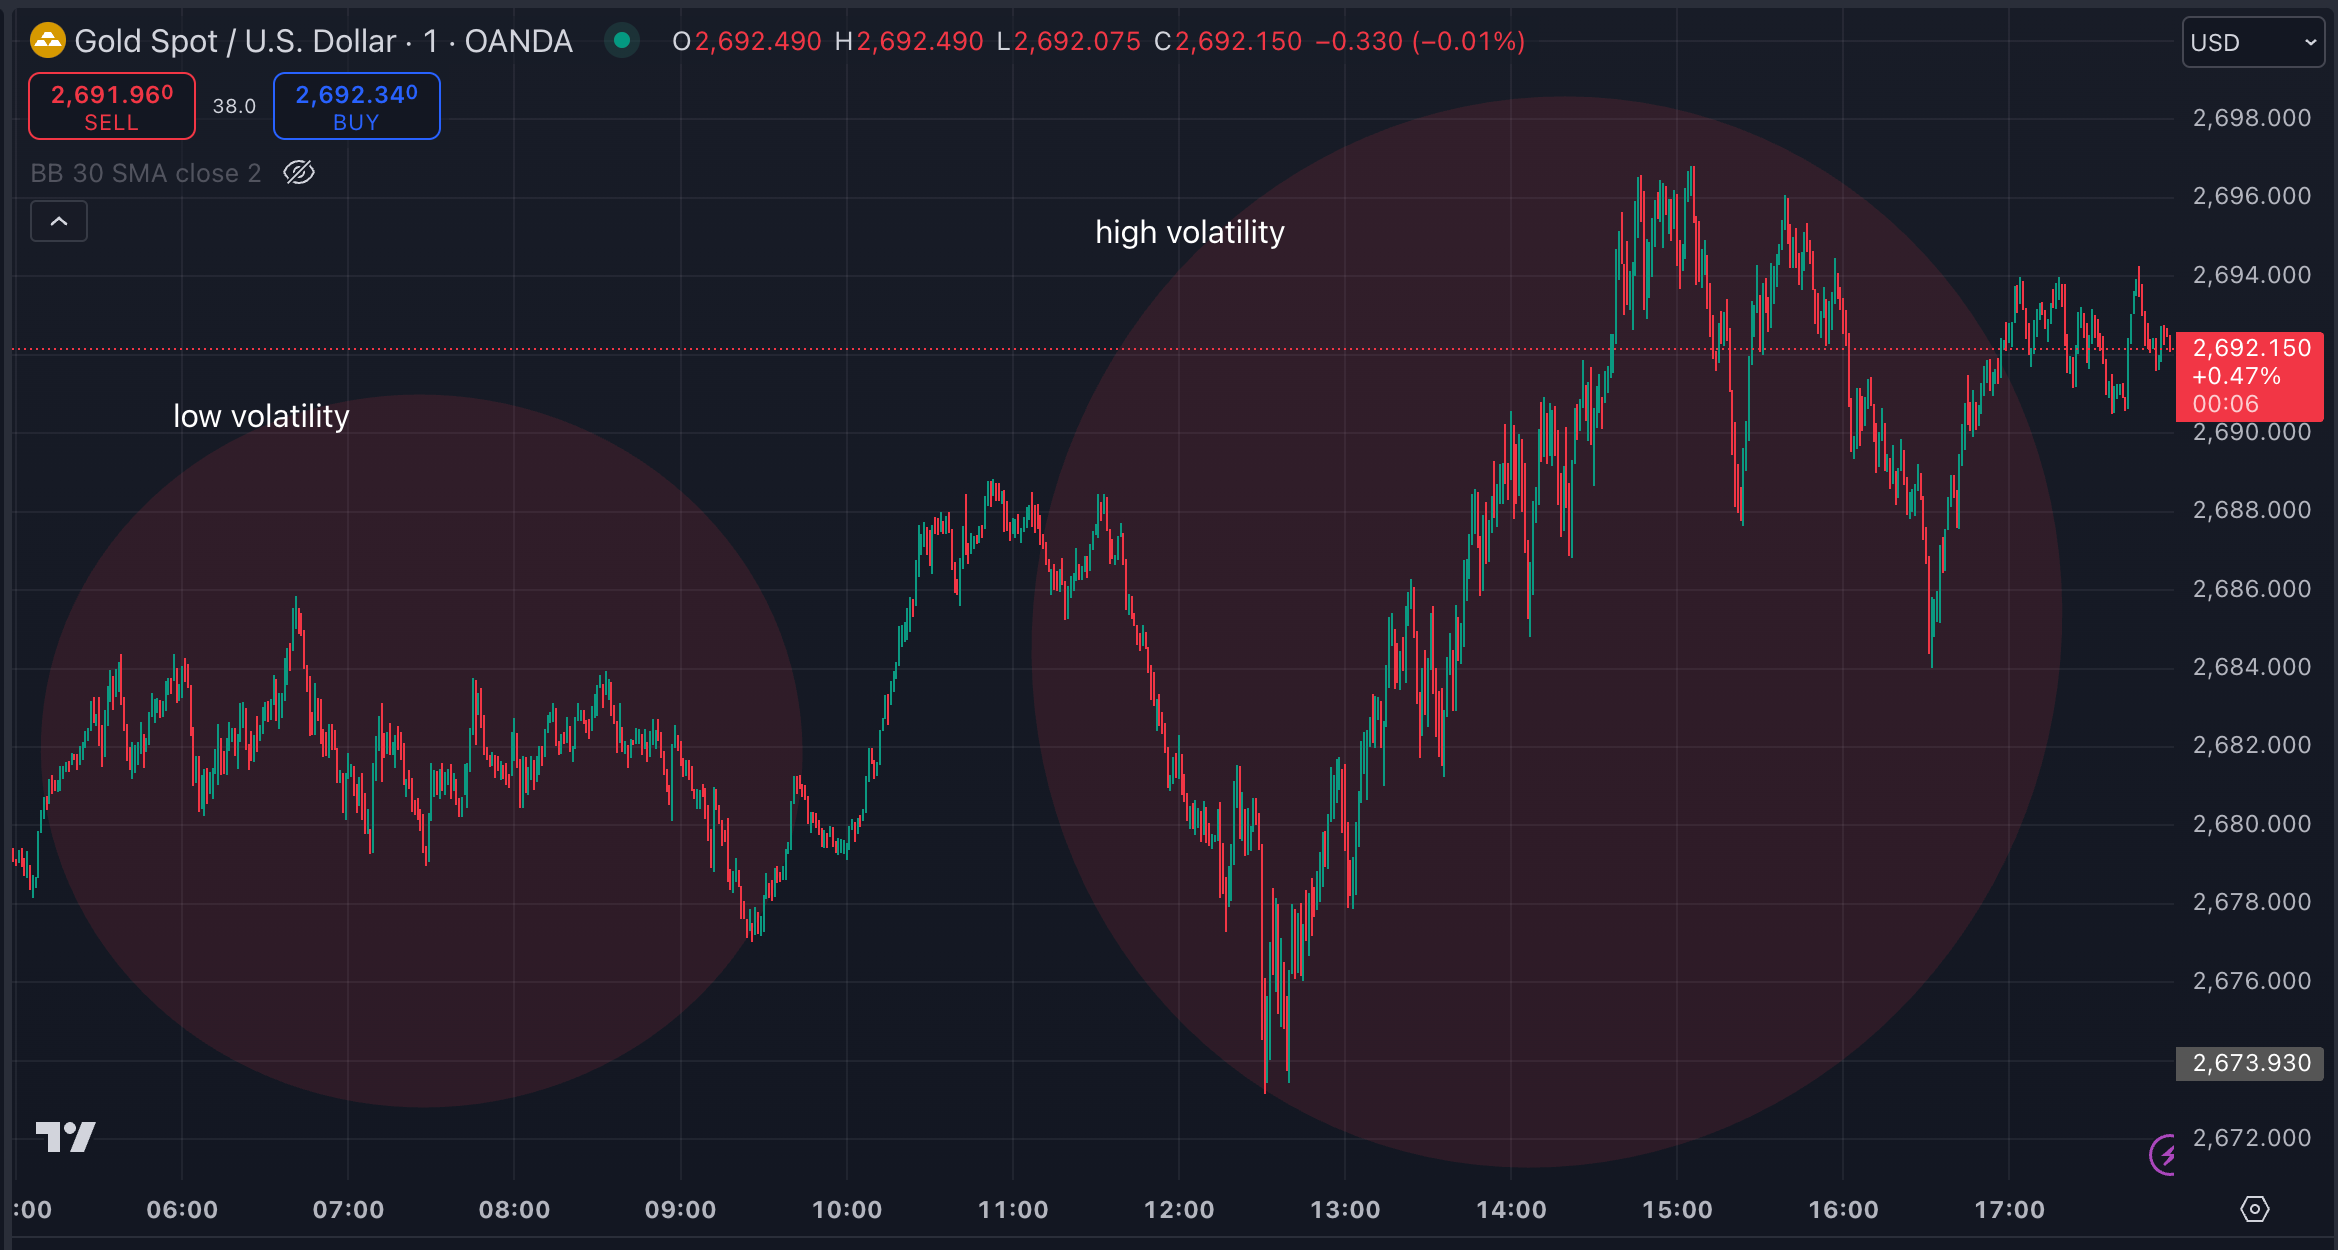
Today, we’re talking about volatility.
Volatility essentially measures how much prices are moving around — are they jumping up and down wildly, or are they stable.
In this post, I'll break down everything you need to know about volatility:
how to measure it
what it means for your trades
how you can use different volatility indicators to improve your strategy.
If you like my writing, please leave a like and/or a comment and share it with your trader friends!
As always, I’ll be using the XAU/USD chart, tons of visuals, and the TradingView platform to illustrate all the concepts.
What is Volatility?
Volatility tells you how much the price of an asset, like Gold, moves up and down and how much risk you're taking in a trade.
When volatility is high, prices can move sharply in either direction, which means there's a higher chance for both profit and loss.
Lower volatility means the price is more stable and easier to predict, making it less risky to trade.
High volatility = bigger price swings, more risk, and more opportunity.
Low volatility = smaller price swings, less risk, but less reward potential.
3 Ways to measure volatility
#1. Standard deviation
Standard deviation shows how much the price moves away from the average - its normal level.
If the standard deviation is high, it means the price of Gold is moving a lot up and down compared to its average.
Standard deviation only tells you how much the price is moving, not whether it’s going up or down, so it works best when combined with other indicators.
#2. Bollinger Bands
Bollinger Bands create a band around the price chart using a moving average, with two lines placed above and below it at two standard deviations. The bands widen when volatility goes up and narrow when volatility drops.
When the price reaches the upper band, it might mean the asset is overbought, and a price drop could follow.
When the price hits the lower band, it could mean the asset is oversold, and the price might rise soon.
A Bollinger Band squeeze (when the bands get really close together) usually hints at an upcoming breakout, either up or down.
#3. Average True Range (ATR)
ATR measures how much an asset's price moves, on average, over a certain time period.
It is especially reliable in volatile or “choppy” markets because it accounts for both the high and low of each period, even if there are price gaps (like when the market reopens after weekends).
If the ATR shows high volatility, you might set a wider stop-loss to avoid getting stopped out by short-term fluctuations. If the ATR shows low volatility, you could set a tighter stop to secure profits more quickly.
Volatility isn't constant and changes over time
Factors that influence volatility:
News and economic events: Big reports like U.S. jobs data, inflation updates, or central bank decisions can cause sudden jumps in volatility as traders adjust their positions.
Market sentiment: Volatility can rise when traders' emotions shift quickly. For instance, if fear hits the market, prices might drop fast, making things more volatile.
Market trends: During a strong, steady trend, volatility usually stays low, but when the trend weakens, volatility often picks up as uncertainty grows.
Volatility will affect your trading strategy
Whether you're trend trading, range trading, or scalping, your approach will need to adapt to the current volatility levels.
Low volatility in a trending market
When Gold is trending upward but with low volatility, it creates
