

Momentum check: are Gold prices ready to soar? A detailed look at technical data
Momentum check: are Gold prices ready to soar? A detailed look at technical data

Hello, fellow traders!
Today, Gold has been rather bullish. It started trading around $2320 per ounce and showed a steady upward trend, peaking at ~$2333.
But before we dive into whether Gold can keep up the momentum, let’s check some important news from today.
📰 Key economic updates:
The U.S. retail sales data for May 2024 came in today and showed a modest increase of 0.1% month-over-month - way less than the 0.3% expected.
This means consumers are spending less → the economy is potentially slowing down.
Poor economic data can lead to a weaker U.S. dollar as growth expectations fall. If the Fed seriously considers this slowdown, it might delay rate hikes or even lower rates to boost the economy.
All of these factors create great conditions for Gold to rise:
economic instability drives investors to safer assets;
a weaker dollar makes Gold cheaper for foreign buyers, potentially boosting demand and driving up prices;
lower interest rates increase the attractiveness of non-yielding assets like Gold.
Given the current news, Gold could continue to rise and even reach the 2330-2333 resistance zone.
📊 Let’s look at the data:
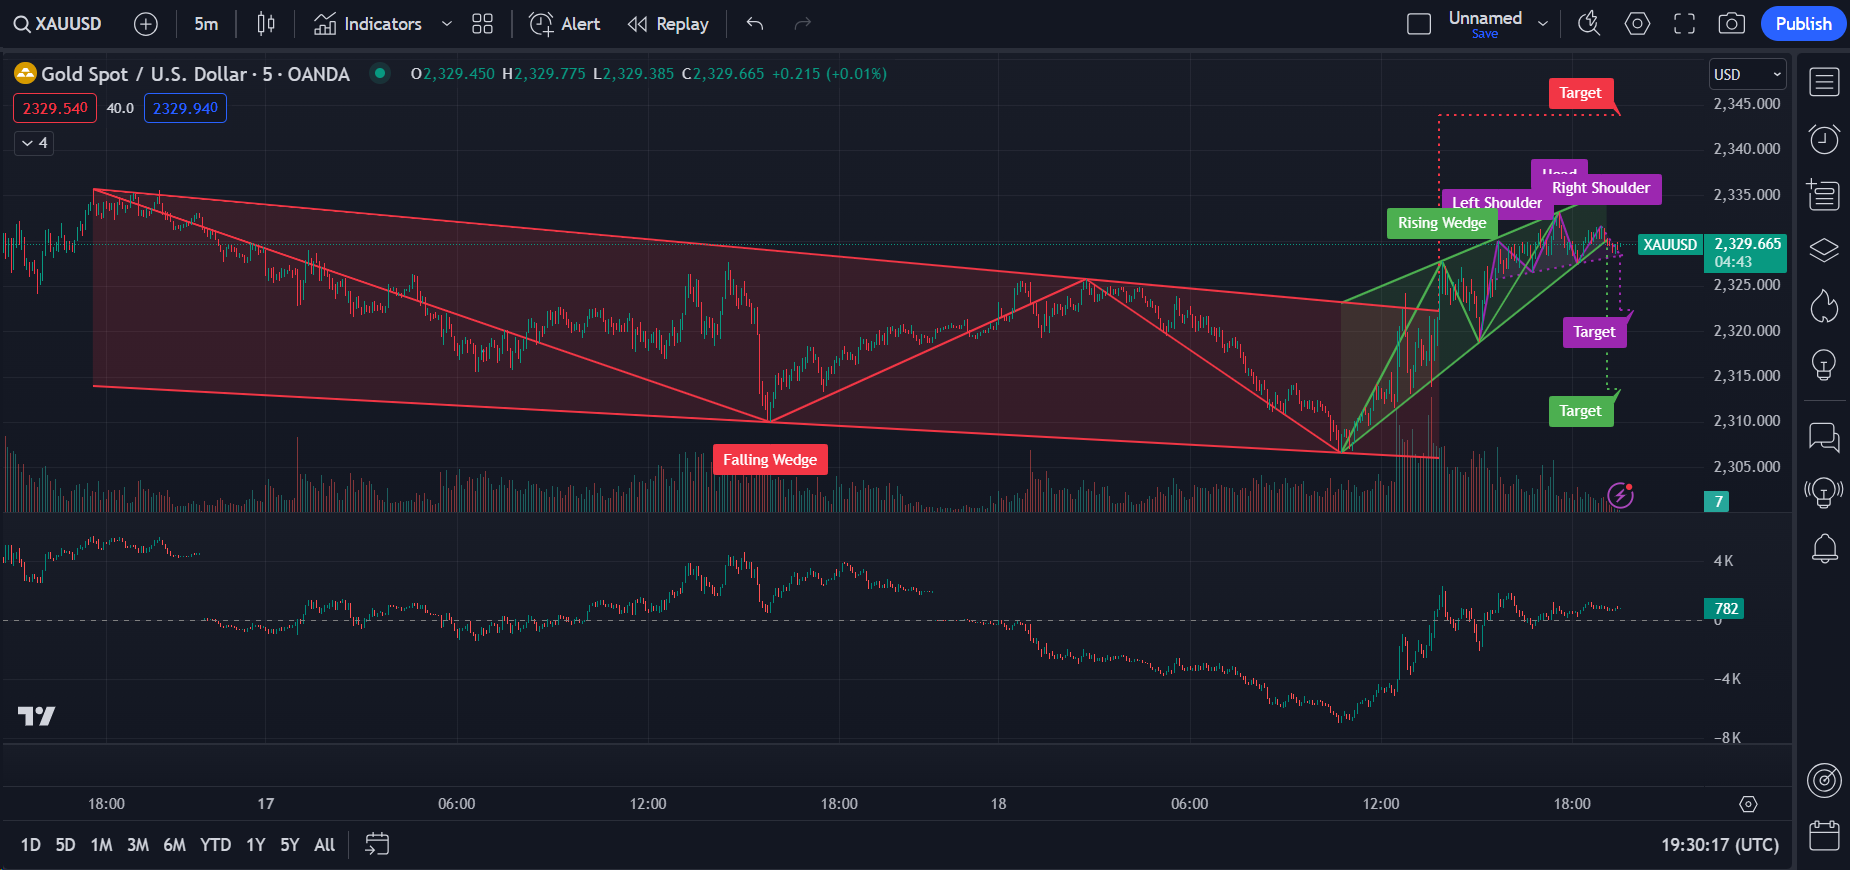
On the left side of chart 1, we can clearly see a falling wedge pattern forming. This pattern shows lower highs and lower lows, with the wedge narrowing down, which means the downtrend is losing steam.
Eventually, the price breaks upward out of the falling wedge, signaling a potential trend reversal. This upward move is confirmed by a subsequent rise in price and the rising wedge on the right side of the chart.
A rising wedge is usually a bearish pattern, indicating that the price might drop after rising for a while. During this period, we see higher highs and higher lows, but the range gets narrower.
Keep reading with a 7-day free trial
Subscribe to The Gold Trader to keep reading this post and get 7 days of free access to the full post archives.