

Mid-term XAU/USD outlook and predictions: why Gold prices are set to rise
Mid-term XAU/USD outlook and predictions: why Gold prices are set to rise


Hello, fellow traders!
The last five trading days for XAU/USD have been marked by a significant sell-off from the highs, a bounce from key support levels, and a gradual recovery with consolidation phases.
In this week’s update, I’ll:
Recap Gold’s weekly price action.
Analyze Gold’s technical performance over the last 90, 30, 5 days, including and last 24 trading hours.
Highlight crucial support and resistance levels.
Update you on key economic events that influenced Gold prices this week.
Assess the current market sentiment by looking at Gold EFT flows and breaking down long/short positions of different trader categories
Share my mid-term predictions and speculations for XAU/USD movements next week and the coming month.
⚡ Gold reaches the weakest level in 2 weeks
The XAU/USD has shown a clear downward trend over the past week, with a net decline of 0.70%.
On Monday, XAU/USD experienced a significant drop early in the day. The price fell from around $2,410 to a low near $2,380 before showing a minor recovery, climbing back to around $2,387 by the end of the trading session.
Gold edged higher on Tuesday and Wednesday until the market saw a significant shift towards the bearish side. XAU/USD dropped consistently throughout the days, reaching the weakest level in two weeks and hitting support around $2,353.
Buyers stepped in at lower prices, pushing XAU/USD higher on Friday before settling at the current $2,387 level.
📊 Let’s look at the technical data
Last 90 days
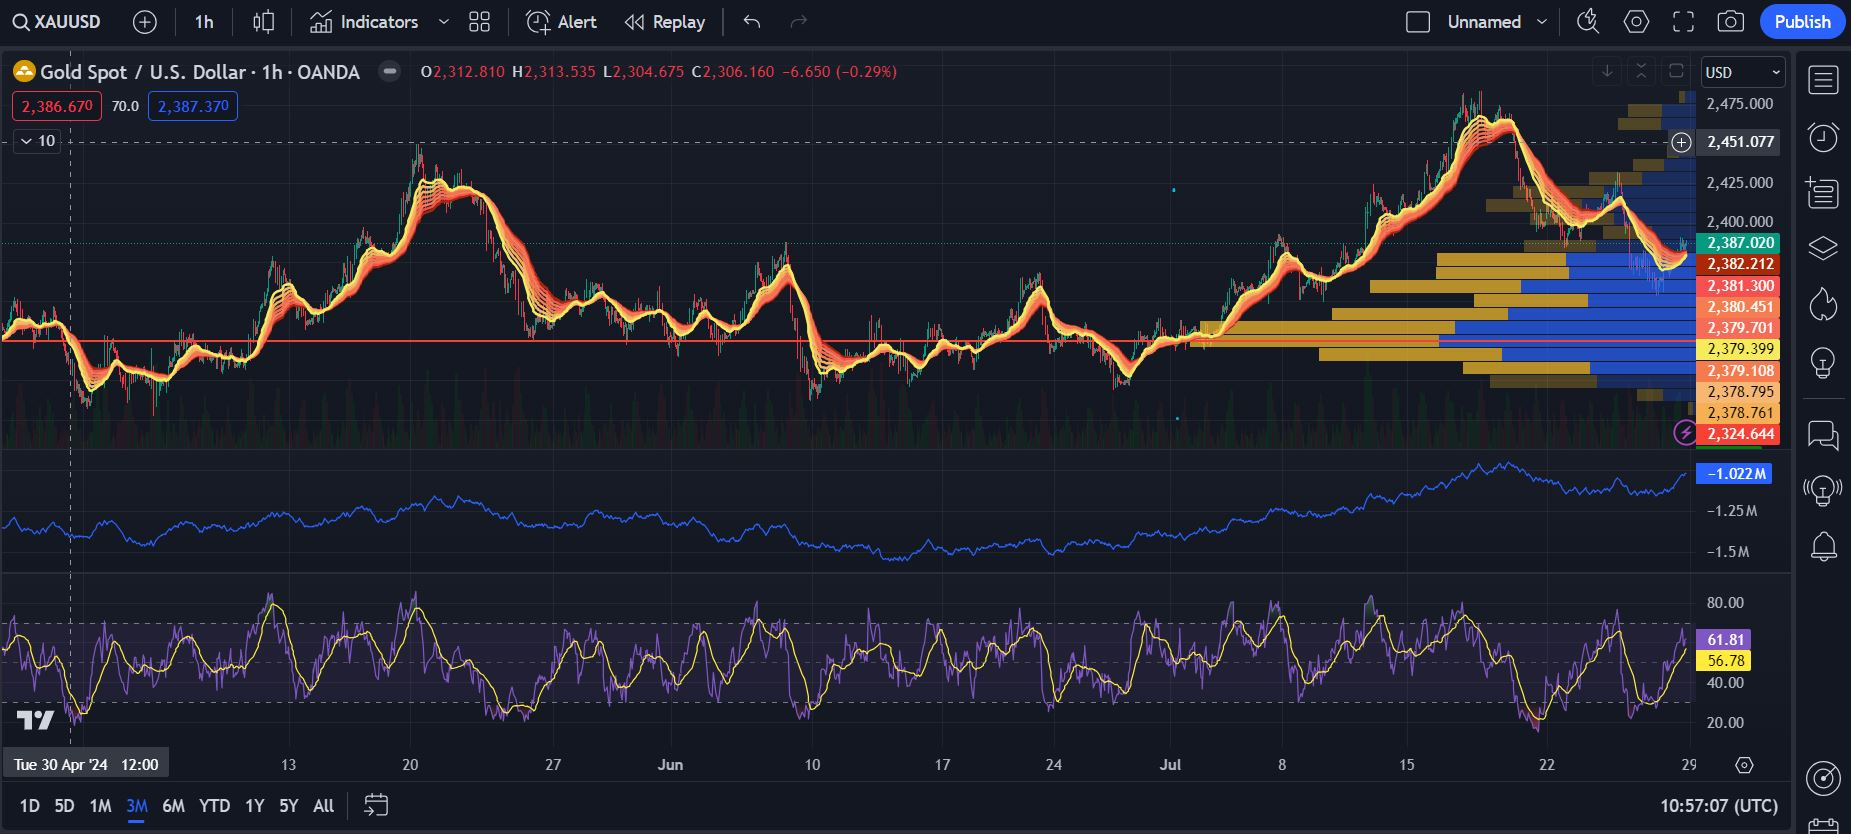
The 90-day chart shows mixed signals from the indicators with a cautiously bullish outlook.
The moving averages show a recent bearish crossover, indicating a potential downtrend. The price is currently below most of these moving averages, confirming bearish momentum.
The RSI is trending upward and is currently above 50, indicating that the momentum is shifting towards the bullish side. However, it's not yet in the overbought territory (above 70), suggesting there is still room for upward movement before any potential reversal.
The OBV line is moving sideways, which means the volume of trading is balanced and the market is consolidating.
The volume profile shows significant trading activity around the price levels of $2,380 and $2,387. This area acts as a strong support zone since a high volume of trades has taken place here, indicating strong interest from both buyers and sellers.
If the price holds above the $2,382 - $2,387 support zone and the RSI continues to rise, the price might attempt to break above the immediate resistance at $2,400. A successful breakout above this level could see the price move towards the next significant resistance around $2,450.

Last 30 days
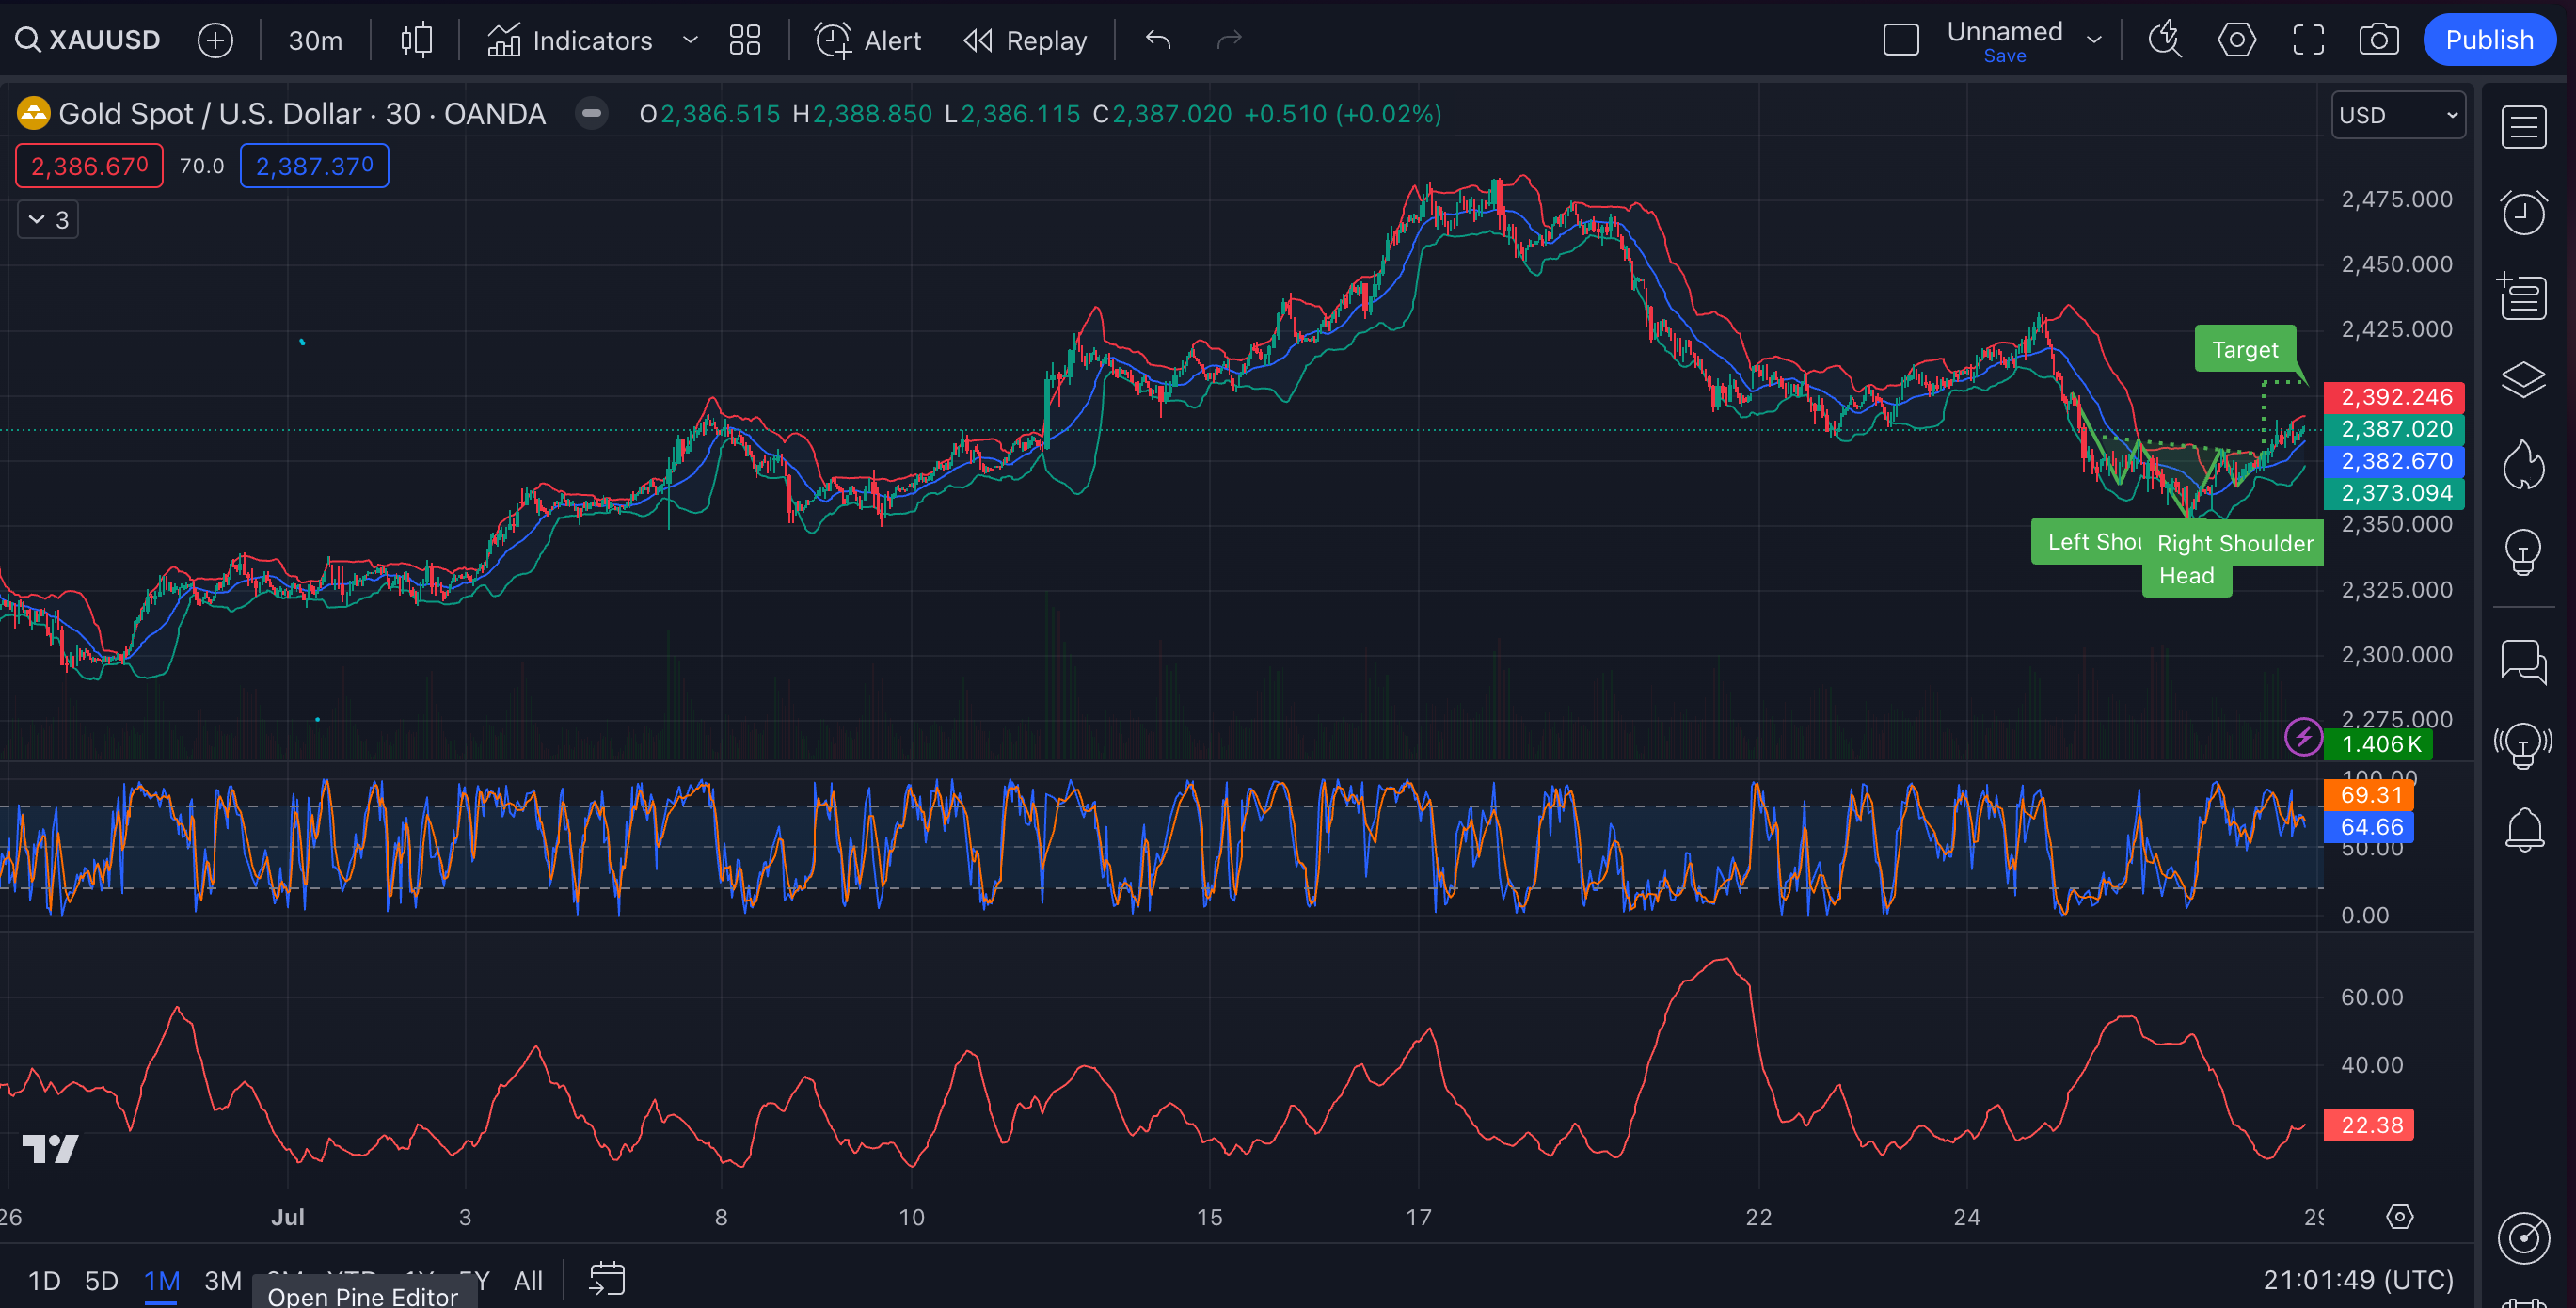
The Bollinger Bands are showing a slight constriction, which usually means a volatility breakout might happen soon. The price is near the middle band, so it's trading around its 20-period simple moving average.
The Stochastic Oscillator is in the mid-range. The %K line is below the %D line, which usually signals bearishness. But since both lines are around the 50 level, it indicates a neutral to slightly bearish momentum. If the %K crosses above the %D line and both move above 80, it would be a strong buy signal. If they move below 20, it would be a strong sell signal.
The ADX is below 25, suggesting the market is range-bound rather than trending.
There's an inverse head and shoulders pattern visible at the end of the chart, which is typically a bullish reversal pattern:
Left Shoulder: Around 2,350
Head: Around 2,325
Right Shoulder: Around 2,350
The neckline of this pattern is around 2,380, a key support level. A breakout above this level, which seems to be happening, is typically a bullish signal. This could suggest a potential price target equal to the distance from the head to the neckline added to the breakout point, targeting around 2,400 - 2,410.
Last 5 days
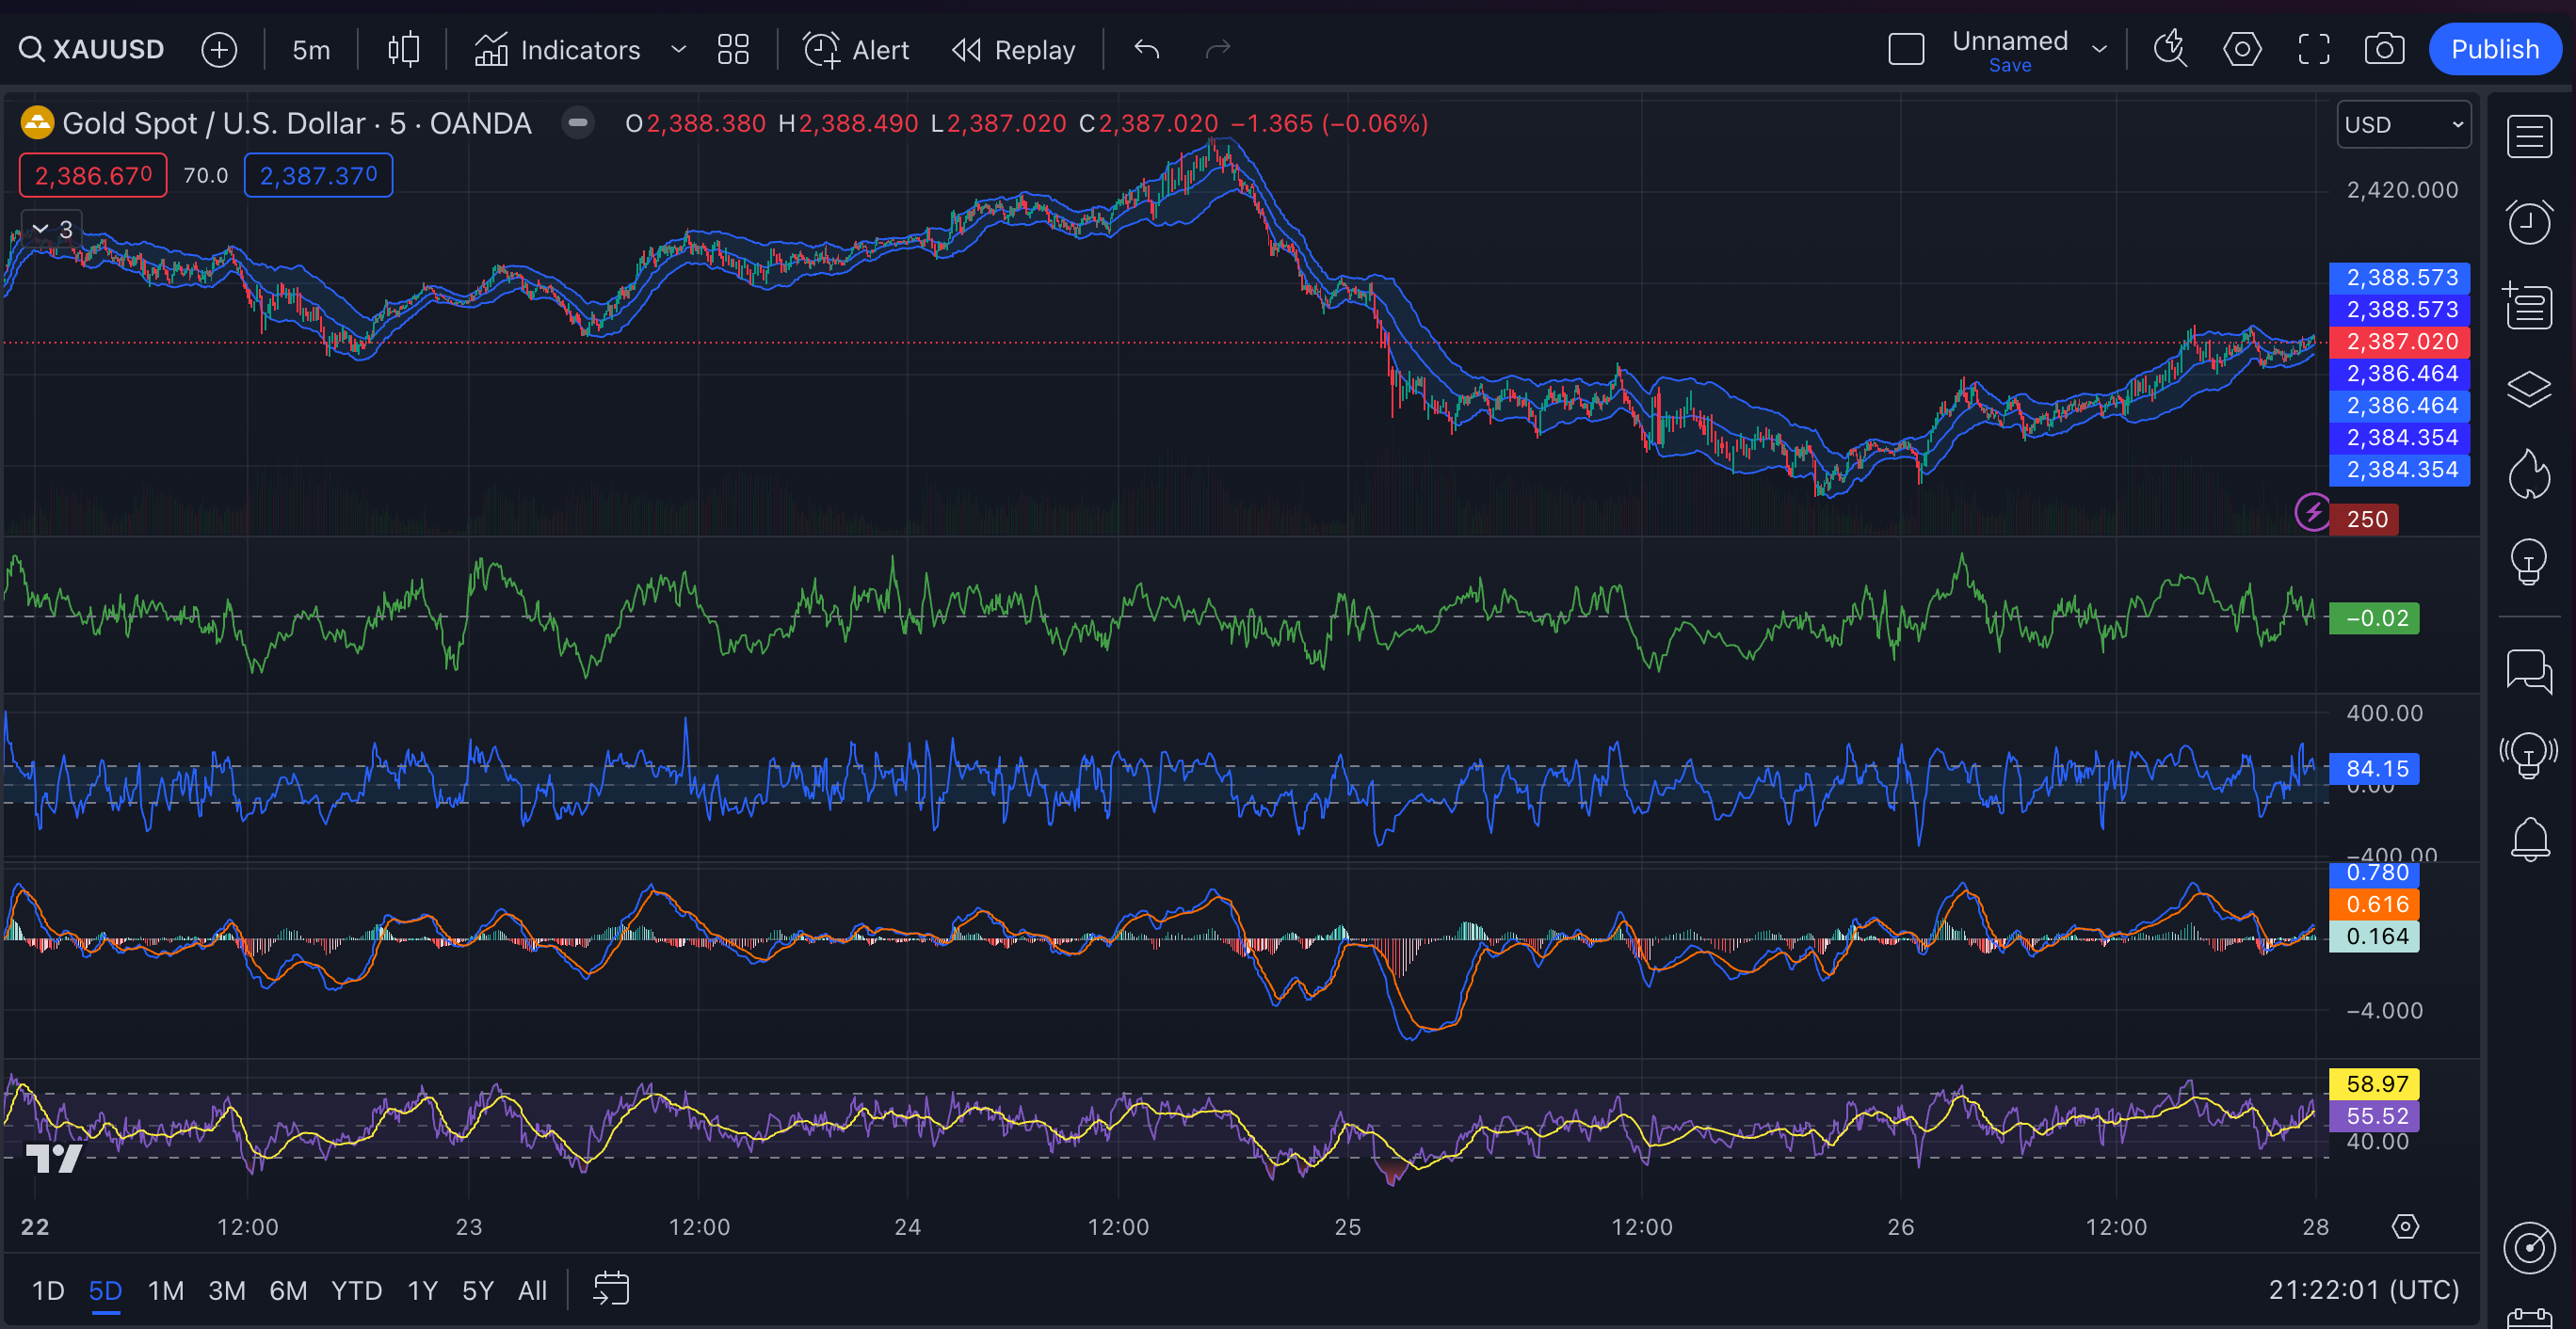
The short-term outlook based on the 5-minute chart is neutral with a slight bullish bias.
Keep reading with a 7-day free trial
Subscribe to The Gold Trader to keep reading this post and get 7 days of free access to the full post archives.