Is the Gold sell-off over? Key indicators point to rebound potential [Weekly XAU/USD analysis + forecast]
Hello, fellow traders!
Gold took a 3% hit on Wednesday after Trump’s victory, as rising U.S. Treasury yields and a stronger dollar pushed it below $2,650. The precious metal got a brief lift from strong export data out of China, but it didn’t really pick up any lasting momentum.
The Fed went ahead with a 25-point rate cut, and Fed Chair Powell kept things open-ended without giving any hints on future cuts. Looking ahead, upcoming U.S. inflation numbers and Fed comments could shake things up: higher-than-expected inflation could strengthen the dollar, putting more pressure on XAU/USD, while any dovish Fed signals might give Gold a bit of a breather.
In this week’s update, I’ll:
Look at the technical setup of XAU/USD and what it tells us about potential future price action.
Highlight the recent key support and resistance levels.
Break down this week’s key economic data from around the world (audio available!) and how it might affect XAU/USD in the mid term.
Explain the latest shift in the market sentiment as to the COT report and what it means for Gold's outlook.
Share my short-term and mid-term predictions on XAU/USD price action and trajectory.
📊 Let’s look at the technical data
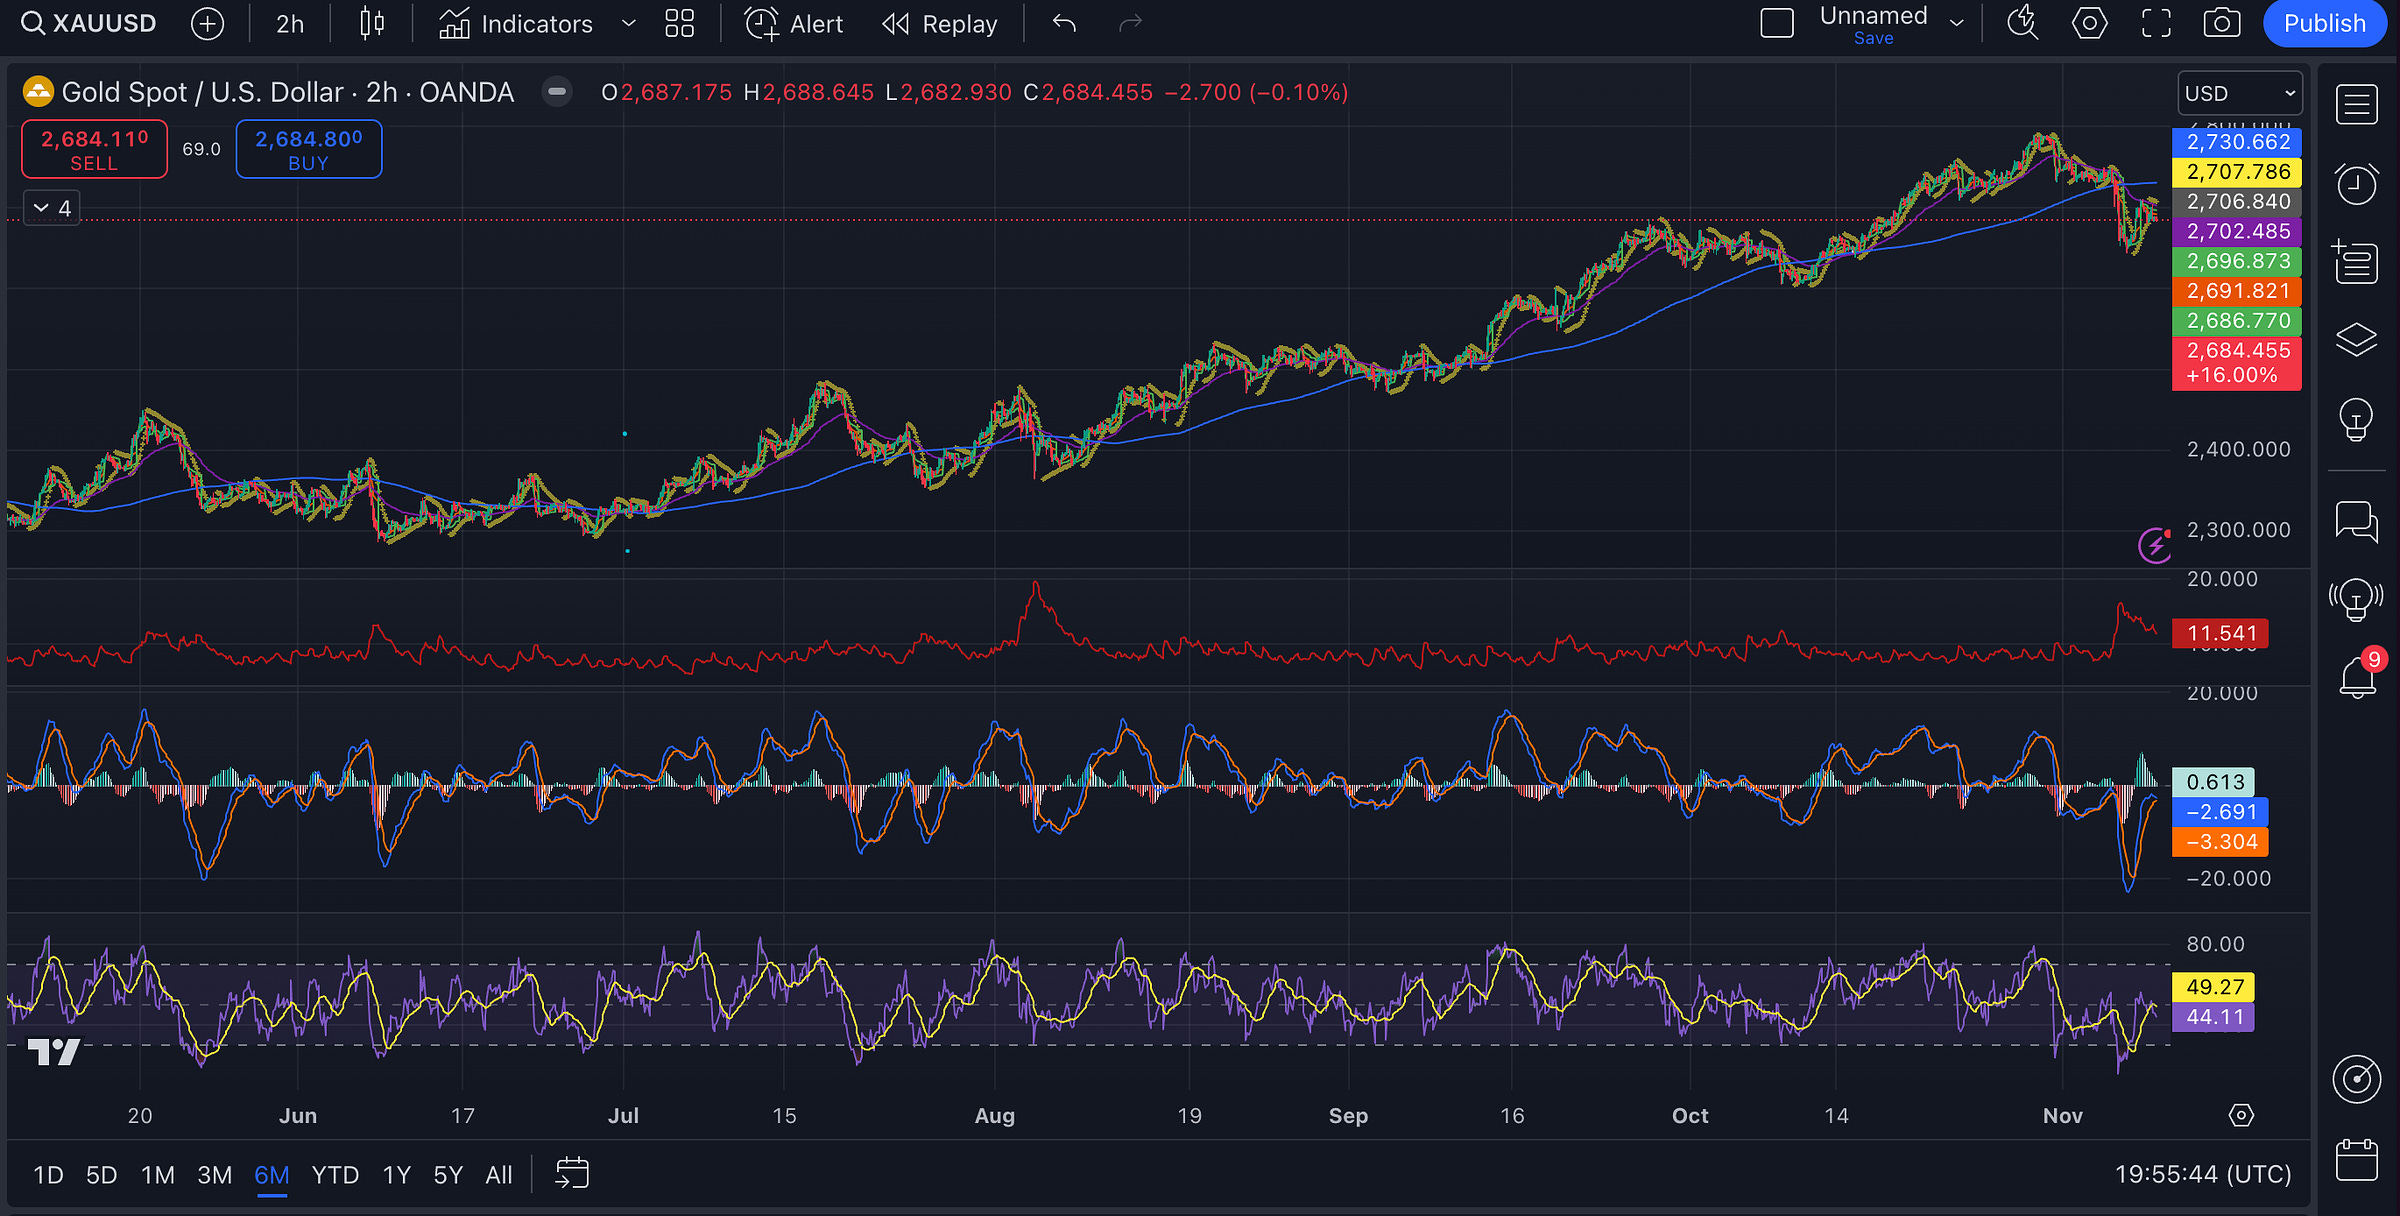
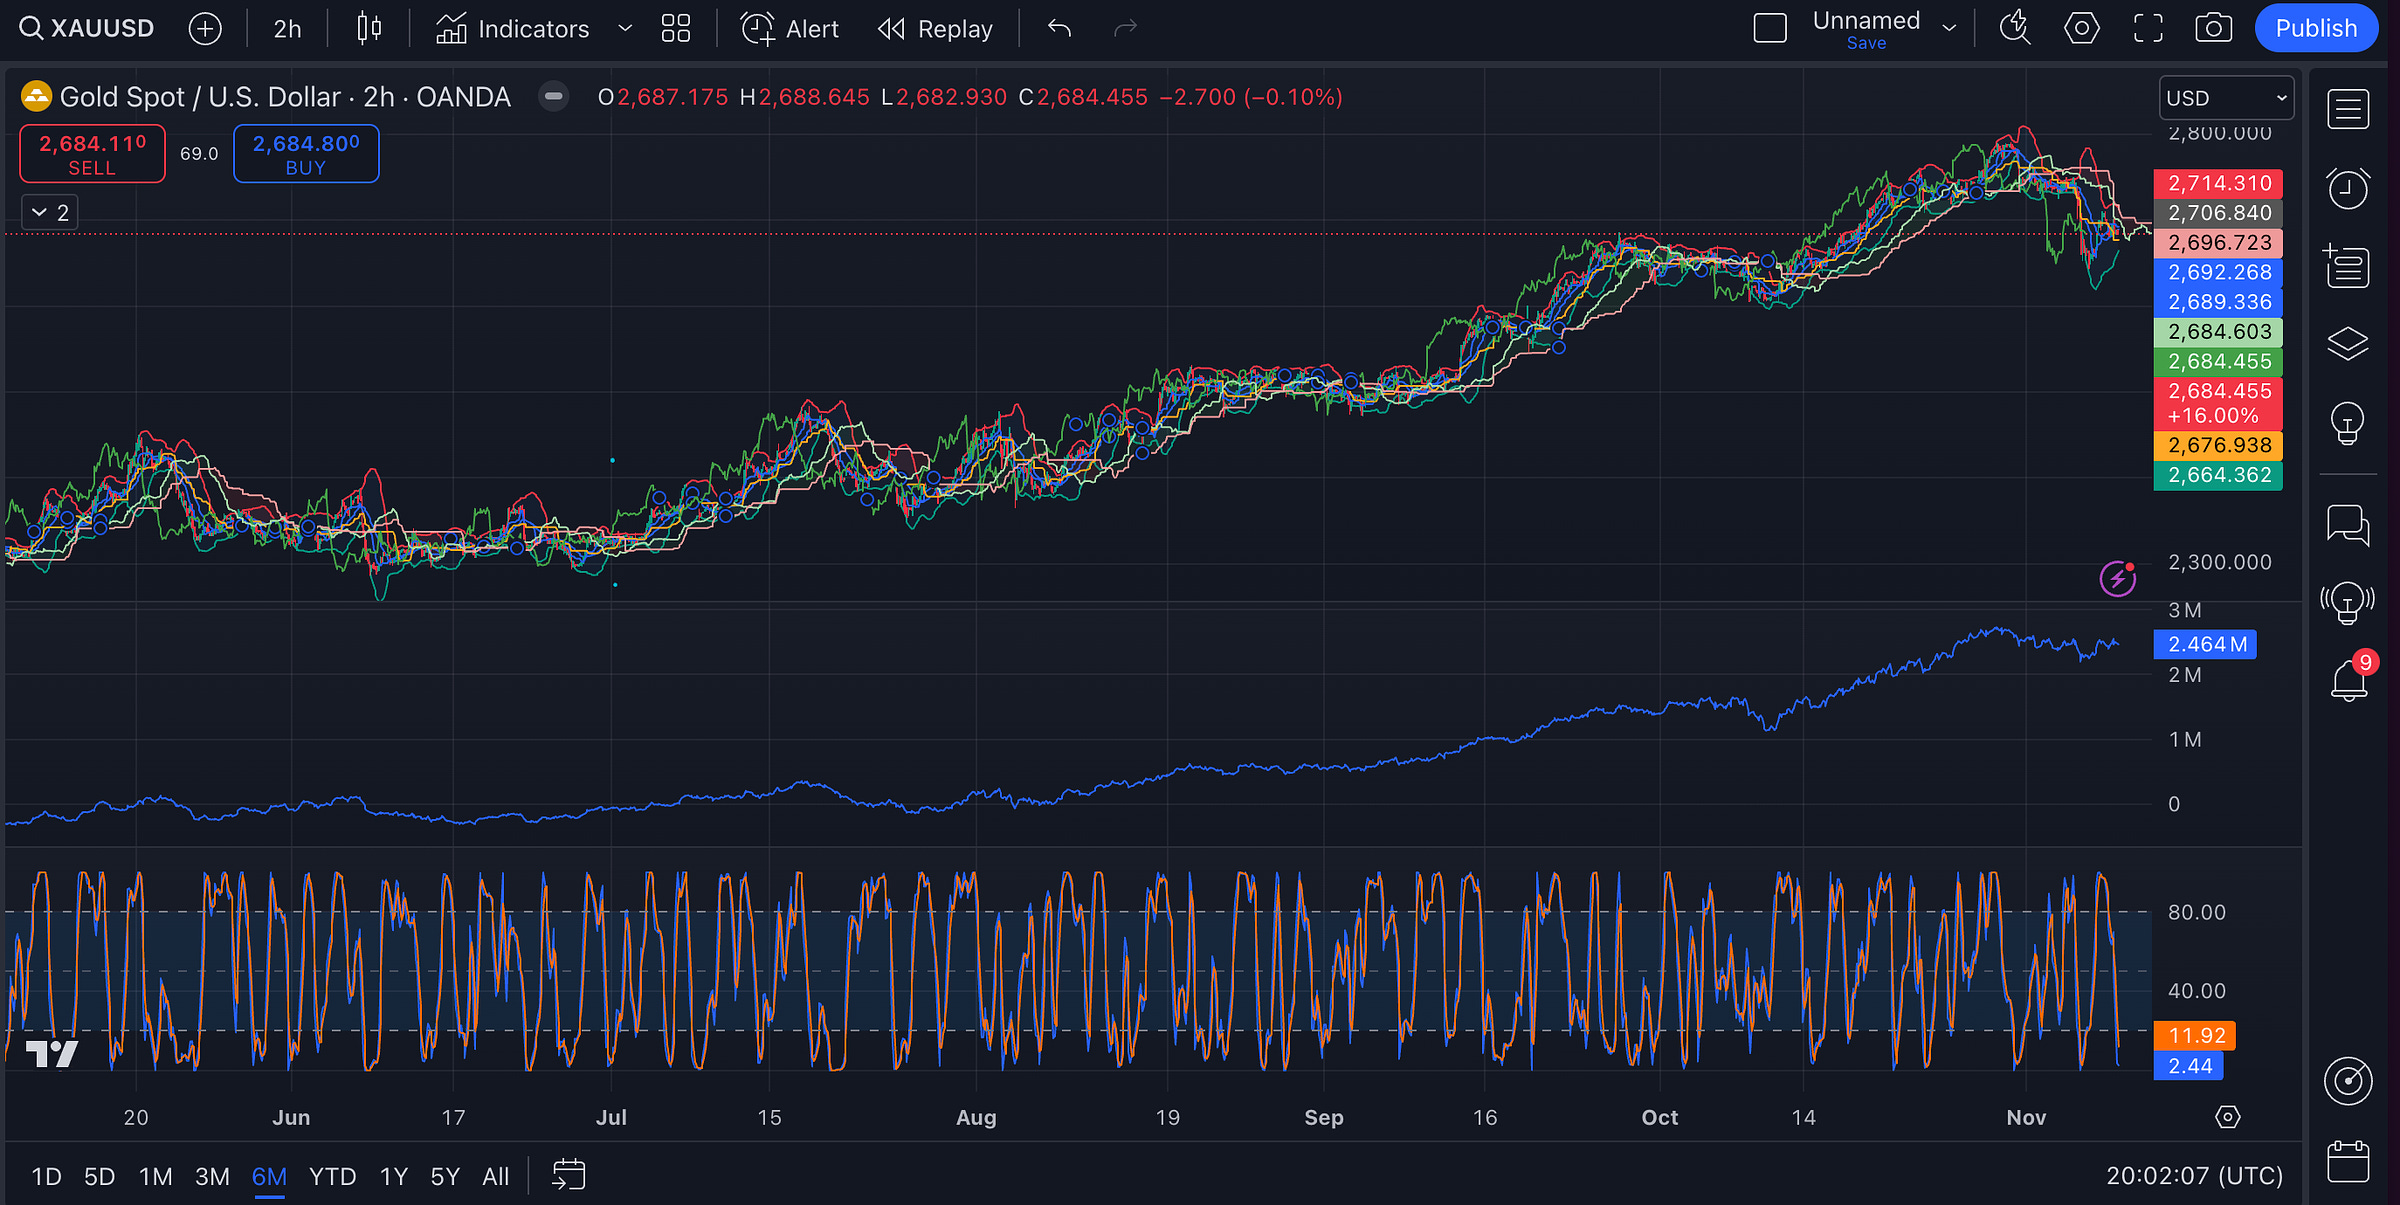
Last 6 months - 2h charts
Key takeaway:
Overall, the sentiment is slightly bearish, with some potential for short-term rebounds, but no clear long-term bullish signs yet. Break above the 50 EMA or a flip in the SAR below the price, would offer a safer entry for any long positions.
Bearish pressure, but with potential relief: Overall, the charts show a dominant bearish pressure (price below 50 EMA, 200 SMA, and SAR), but there are early signs that the sell-off might slow down or consolidate soon. Indicators like the Stochastic RSI and MACD histogram show hints of potential bounce.
Possible short-term rebound, but long-term uncertain: The oversold signals from Stochastic RSI and neutral RSI near 50 suggest that a minor bounce could happen soon. However, unless we see price movement above the 50 EMA and a shift in SAR or MACD, any rebound might be limited.
No clear momentum: The On-Balance Volume not showing strong bullish activity suggests that large buyers aren’t aggressively stepping in to support prices at these levels. Without stronger buying volume, it’s hard to see a sustained uptrend forming in the near term.
Volatility is picking up: Both the ATR and Bollinger Bands are showing increased volatility, which usually means bigger price swings. Gold might see more pronounced movements in either direction.
Support around 2,670-2,680: The price is hovering close to the VWAP and lower Bollinger Band range, suggesting that the 2,670-2,680 zone could act as a support level. If this area holds, we might see Gold consolidate or attempt a short-term bounce. If it breaks below this range, it would open up more downside potential.
Last 3 months - 1h charts
Key takeaway:
There’s some short-term potential for a bounce, especially with oversold conditions and the bullish pennant. Yet the broader sentiment is still bearish. In the current conditions, it would be best to consider a range-bound strategy. Short positions near
Keep reading with a 7-day free trial
Subscribe to The Gold Trader to keep reading this post and get 7 days of free access to the full post archives.


