

Is Gold becoming recession-proof? In-depth technical analysis, key economic news, mid-term predictions for XAU/USD
Is Gold becoming recession-proof? In-depth technical analysis, key economic news, mid-term predictions for XAU/USD


Hello, fellow traders!
It’s been a volatile week for Gold that opened on Monday bearing heavy losses. As the days progressed though, the metal found support and began to recover. By the end of the trading week, the sentiment was clearly bullish, with the market rallying and establishing new support levels.
In this week’s update, I’ll:
Recap Gold’s weekly price action.
Analyze Gold’s technical performance over the last 6 months, 90, 30, days.
Highlight crucial support and resistance levels.
Summarize all key economic events that influenced Gold prices this week.
Assess the current market sentiment by looking at Gold EFTs inflows and outflows and breaking down long/short positions of different trader categories
Share my mid-term predictions and speculations for XAU/USD.
⚡ Gold rebounds following the bearish drop
Gold started the trading week with significant downward pressure, driven by strong market selloff. The price dropped sharply from around $2,446 down to $2,364, losing more than 1% and breaking through multiple support levels.
It managed to regain its 2,400 level on Tuesday, followed by a brief consolidation, but was pushed lower as the 10-year US Treasury bond yield rebounded.
Gold stretched higher on Wednesday and fully regained its bullish momentum the next day. The successful breach of $2,400 meant that the market was gaining confidence. XAU/USD reached as high as $2,437 before closing around $2,431 on Friday.
📊 Let’s look at the technical data
Last 6 months
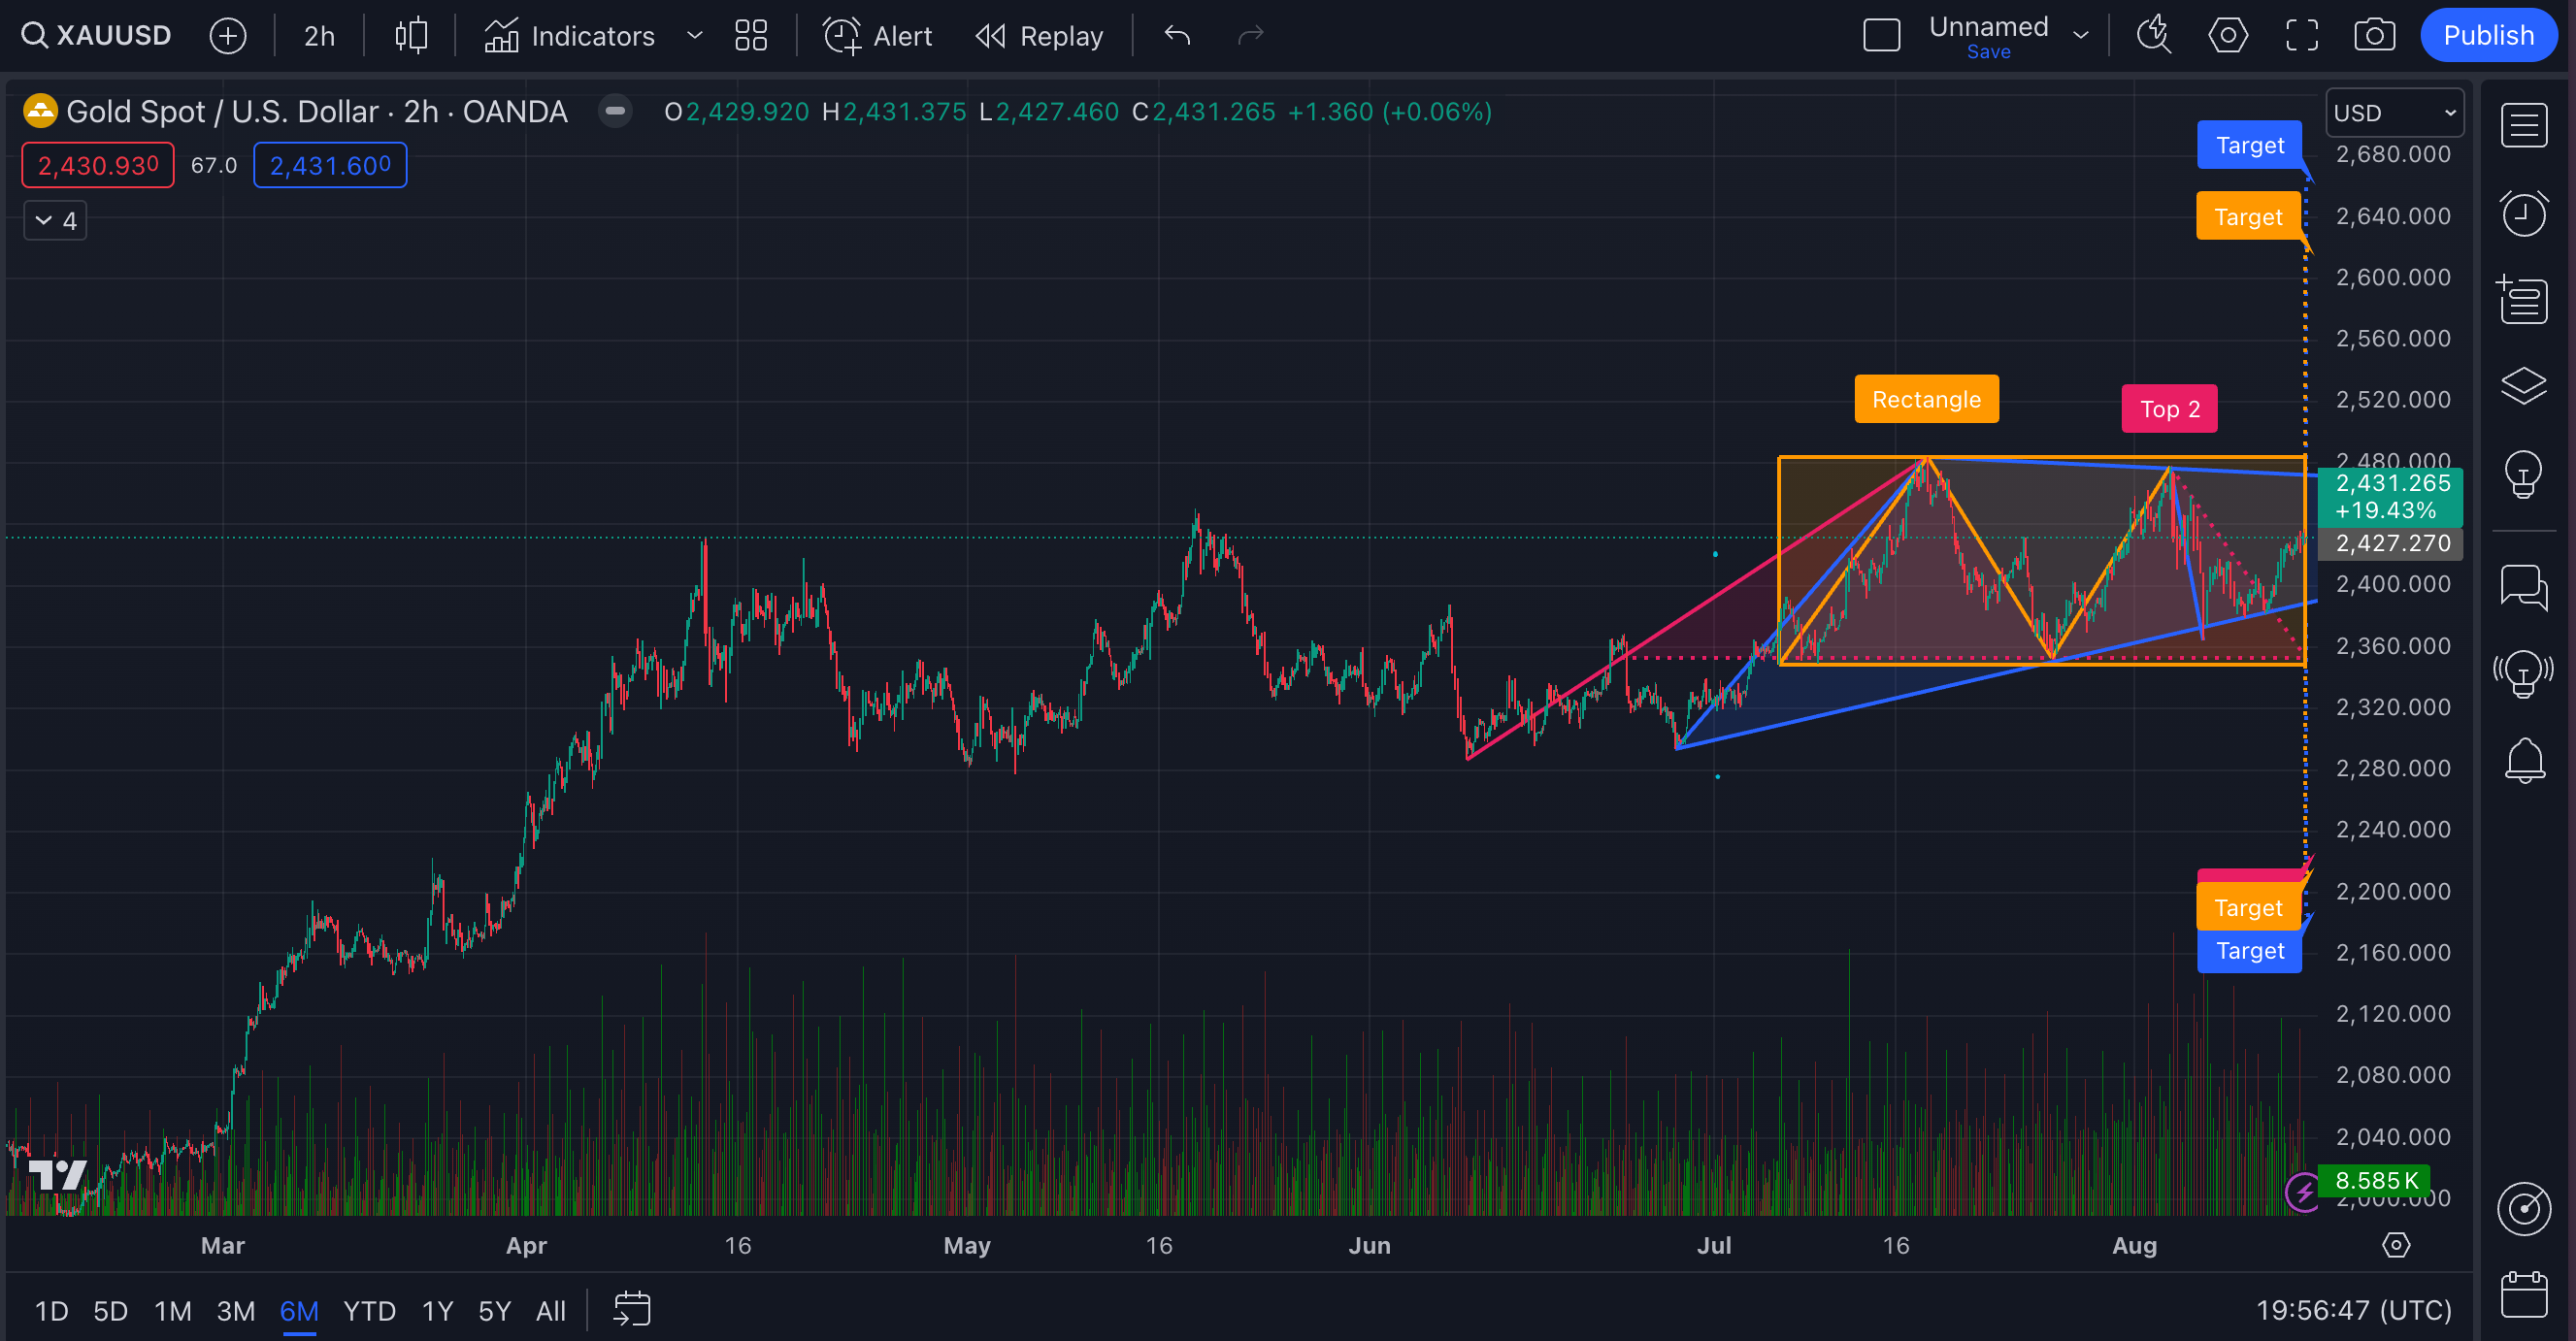
The 2-hour time frame, covering about 6 months from early February to August, shows the market is leaning slightly towards the bullish side.
The pink trendline shows a strong uptrend from early February to mid-May. The price tested resistance near $2,480 twice but failed to break above it, so the selling pressure at that level is strong.
In mid-May, the price entered the consolidation phase, outlined by the rectangle.
The blue trendline is forming an ascending triangle with the rectangle's lower boundary around $2,360 as the support. Ascending triangles are typically bullish patterns, indicating that the price might eventually break out above the $2,480 resistance. However, this would require a significant catalyst, either news-driven or from a significant volume increase.
The volume has been somewhat steady with occasional spikes, particularly during the price drops and near the peaks. But there hasn’t been enough volume to break out of the consolidation range.
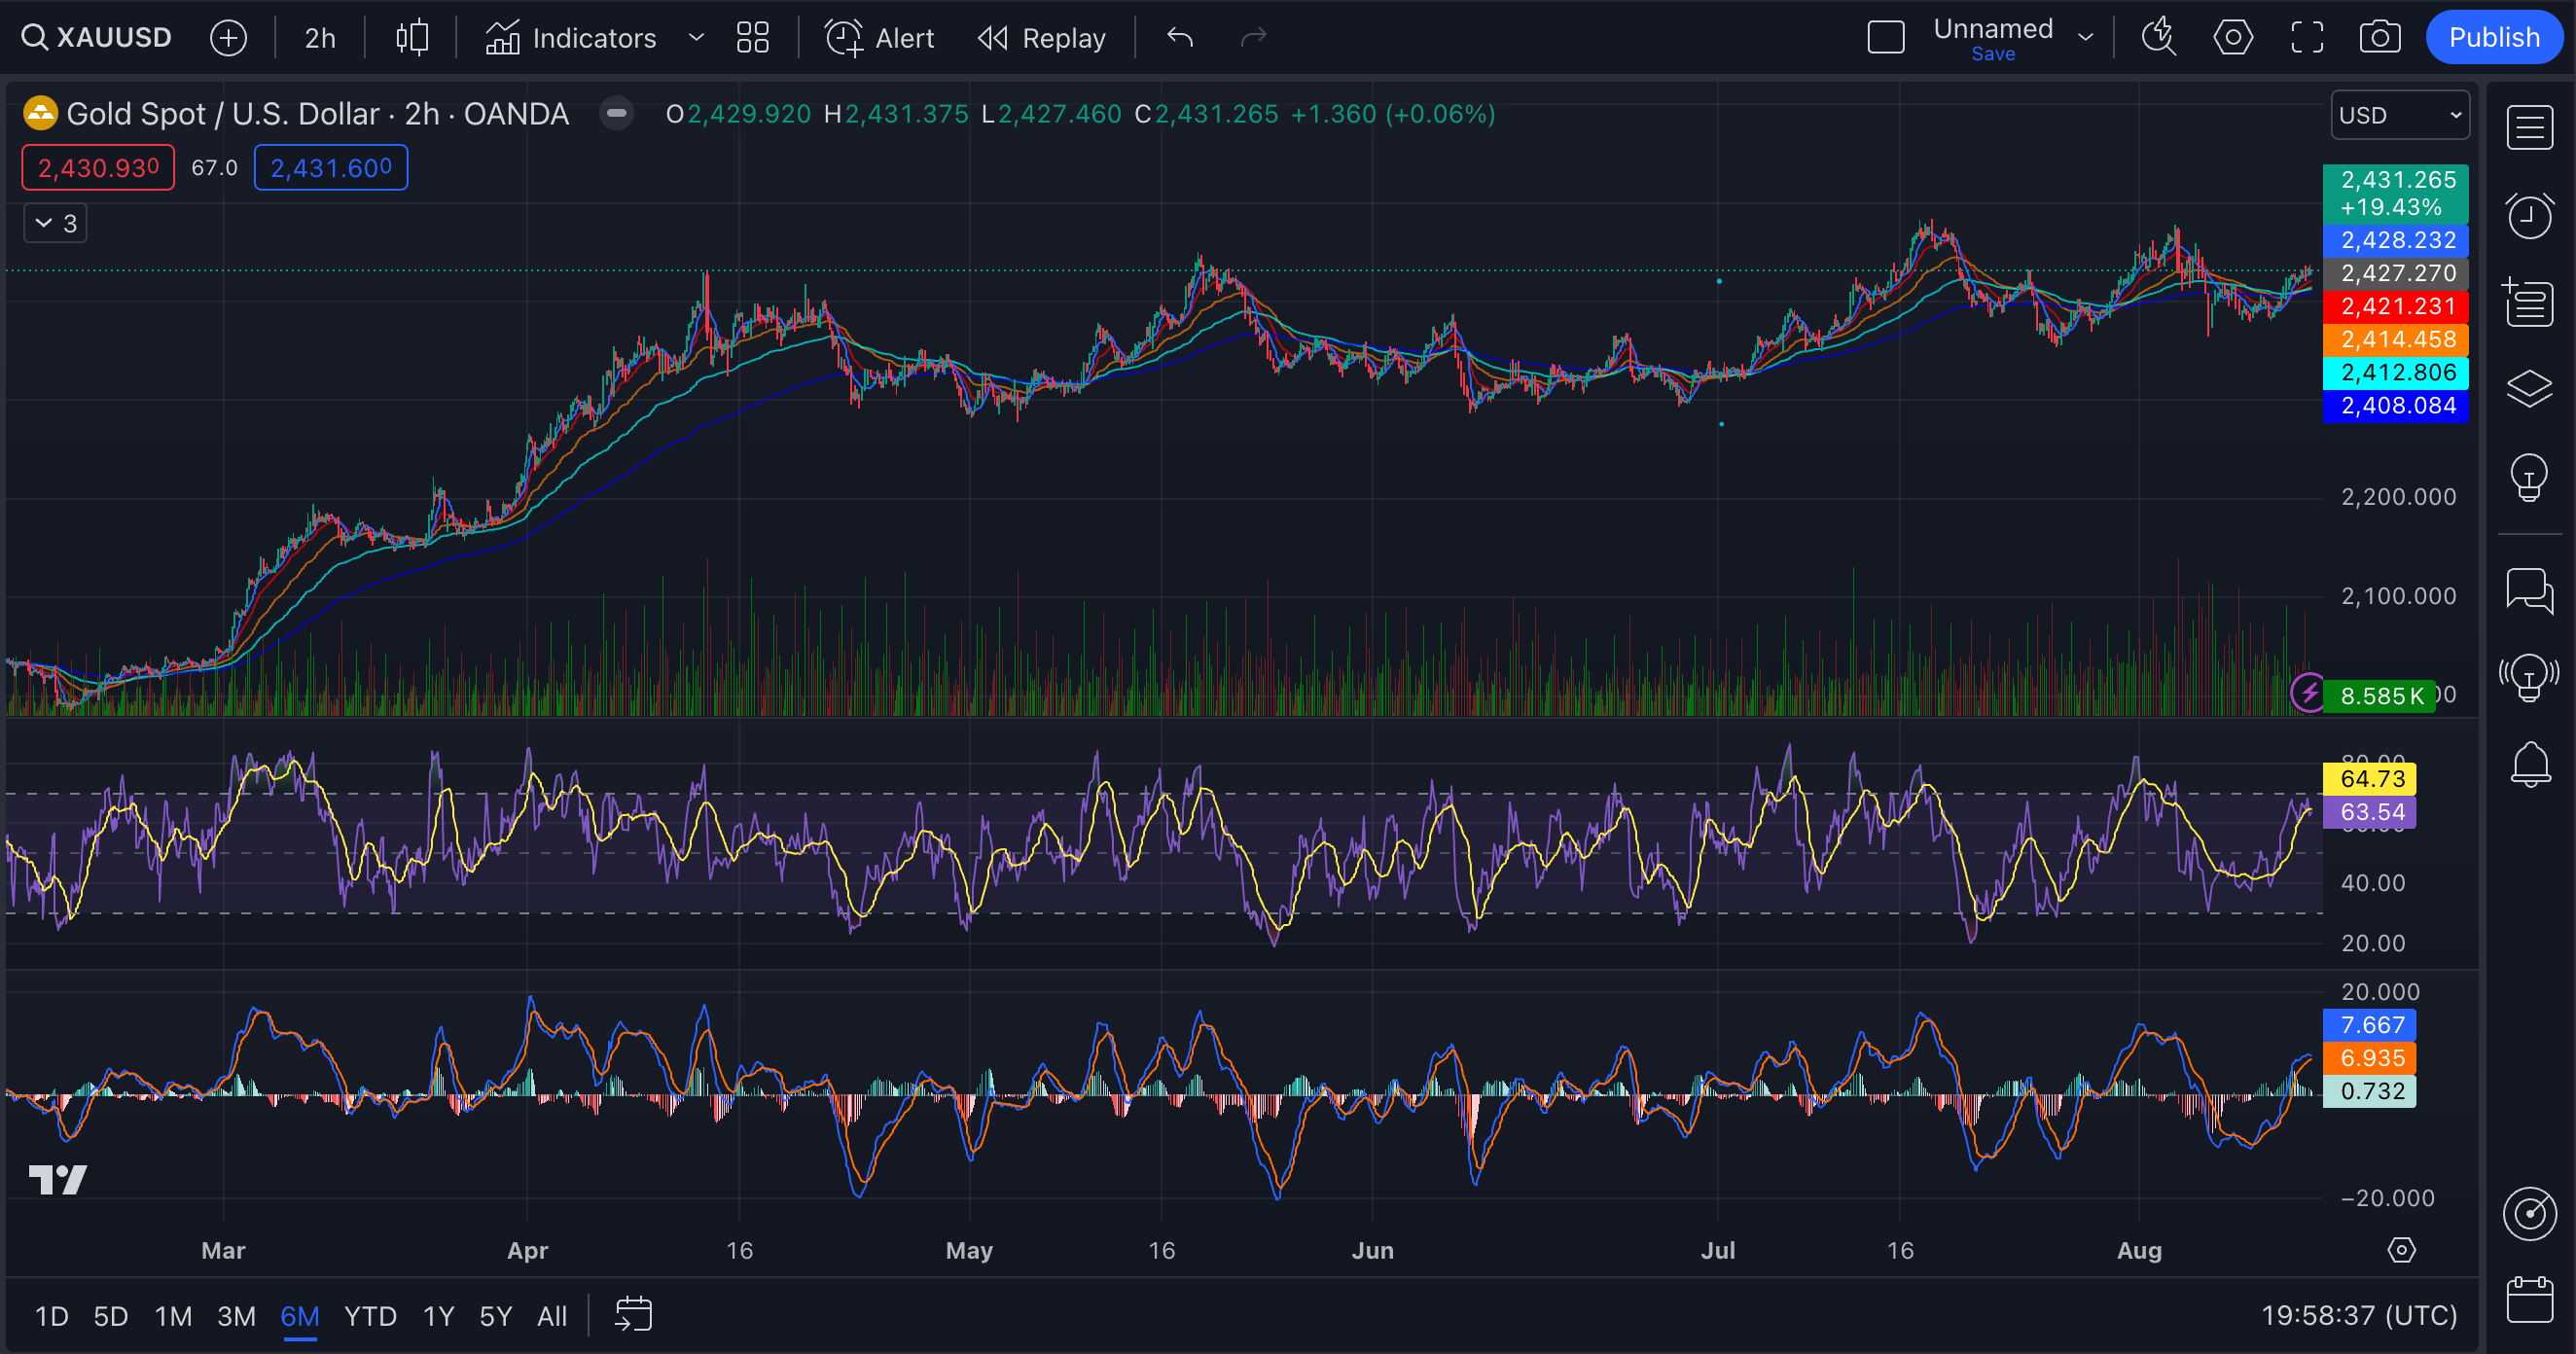
The price is currently above all EMAs and SMA 9, which generally is a bullish signal.
The RSI is hovering around 64, but not yet overbought. It has bounced back from around 40, so there’s been a recent shift from bearish to bullish sentiment.
The MACD is showing a bullish crossover (a buy signal). However, the values are close to each other, indicating that the bullish momentum is not very strong.
Last 90 days
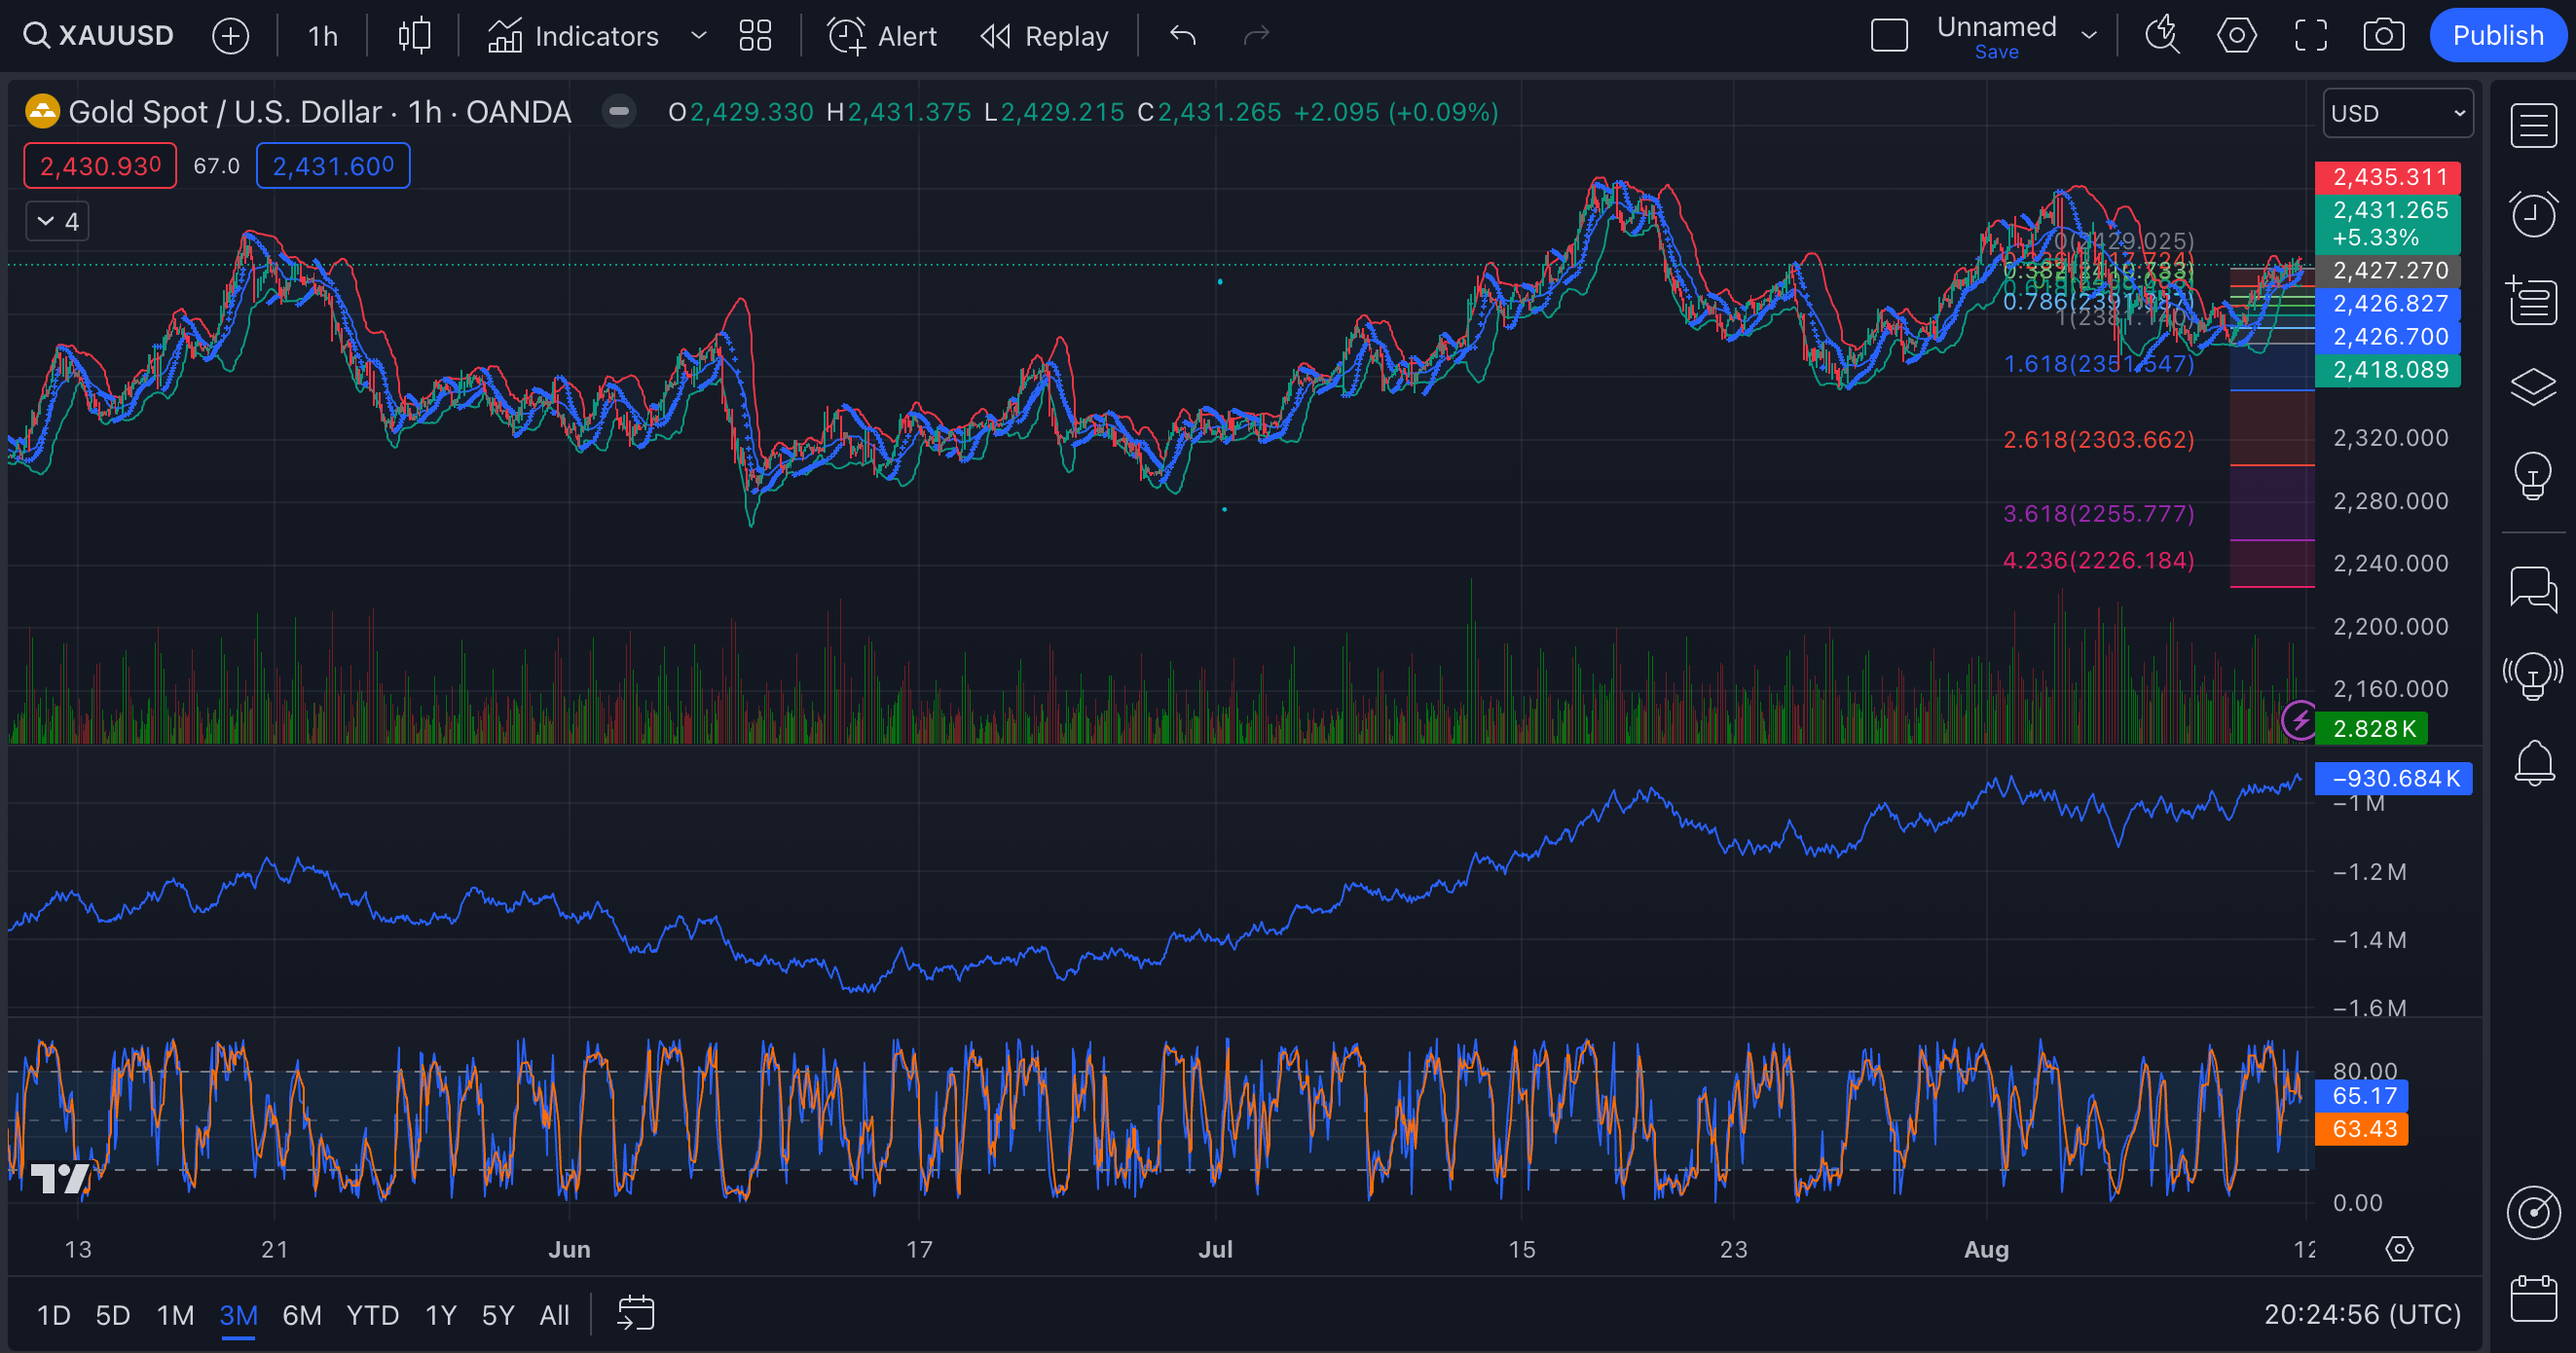
The 1-hour chart shows the market has a bullish tilt but with signs of potential weakening.
The Bollinger Bands are currently relatively tight, which indicates a period of lower volatility following a more volatile period. The price is currently near the middle band at $2,426.700, meaning the market is in a consolidation phase where buyers and sellers are more balanced.
The Parabolic SAR dots are currently below the price, which is a bullish indicator. This suggests that the short-term trend is upward, and unless we see a reversal, this trend could continue.
The Stochastic Oscillator shows the market is approaching an overbought condition - a pullback might be on the horizon if it reaches overbought territory.
Keep reading with a 7-day free trial
Subscribe to The Gold Trader to keep reading this post and get 7 days of free access to the full post archives.