Institutional traders turn bearish on Gold while central banks continue Gold buying spree: XAU/USD weekly analysis and price action forecast
Hello, fellow traders!
The trading week began quietly due to the Labor Day holiday in the US, but activity soon picked up as various economic indicators came into play. A surprising decline in US job openings and weaker-than-expected employment data lead to a softer dollar, indirectly supporting Gold prices in the 2nd half of the week.
Lower-than-anticipated nonfarm payroll growth and a slight dip in unemployment, fueled speculation about the Federal Reserve's next moves. Markets are now 50/50 on whether the Fed will cut rates by 50 basis points or 25 basis points at the upcoming September 18th meeting - the decision that will define Gold’s action in the coming months.
In this week’s update, I’ll:
Analyze the latest technical patterns and indicators of XAU/USD and what they mean for potential future price action.
Suggest how to position for different scenarios in the Gold market by giving 4 example trade setups.
Break down this week’s key economic data and central bank Gold buying trends from around the world and how it might affect XAU/USD in the mid term.
Explain the latest shift in the market sentiment as to the COT report and what it means for Gold's outlook.
Share my short-term and mid-term predictions on XAU/USD price action and trajectory.
📊 Let’s look at the technical data
Last 6 months - 2h charts
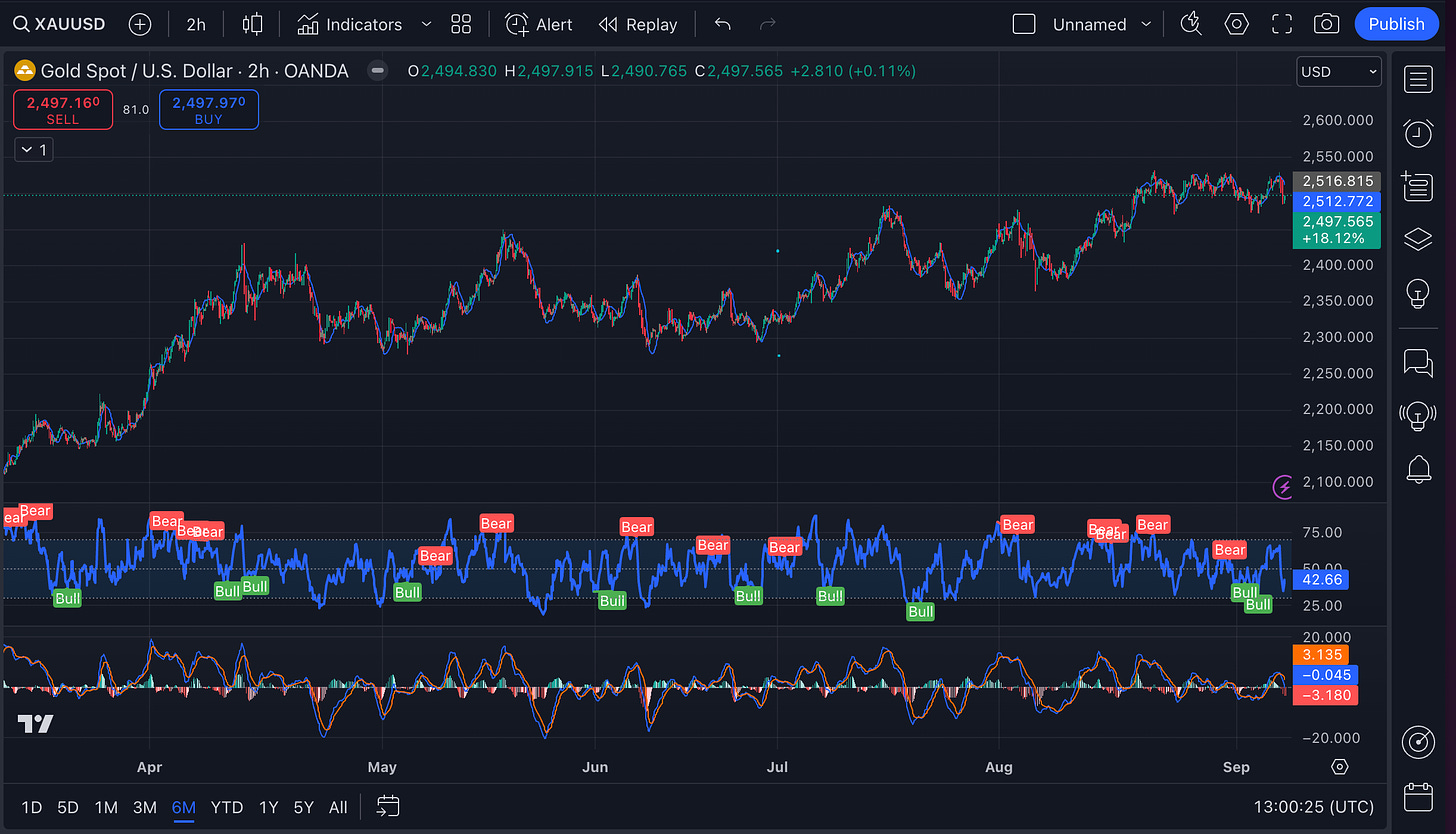
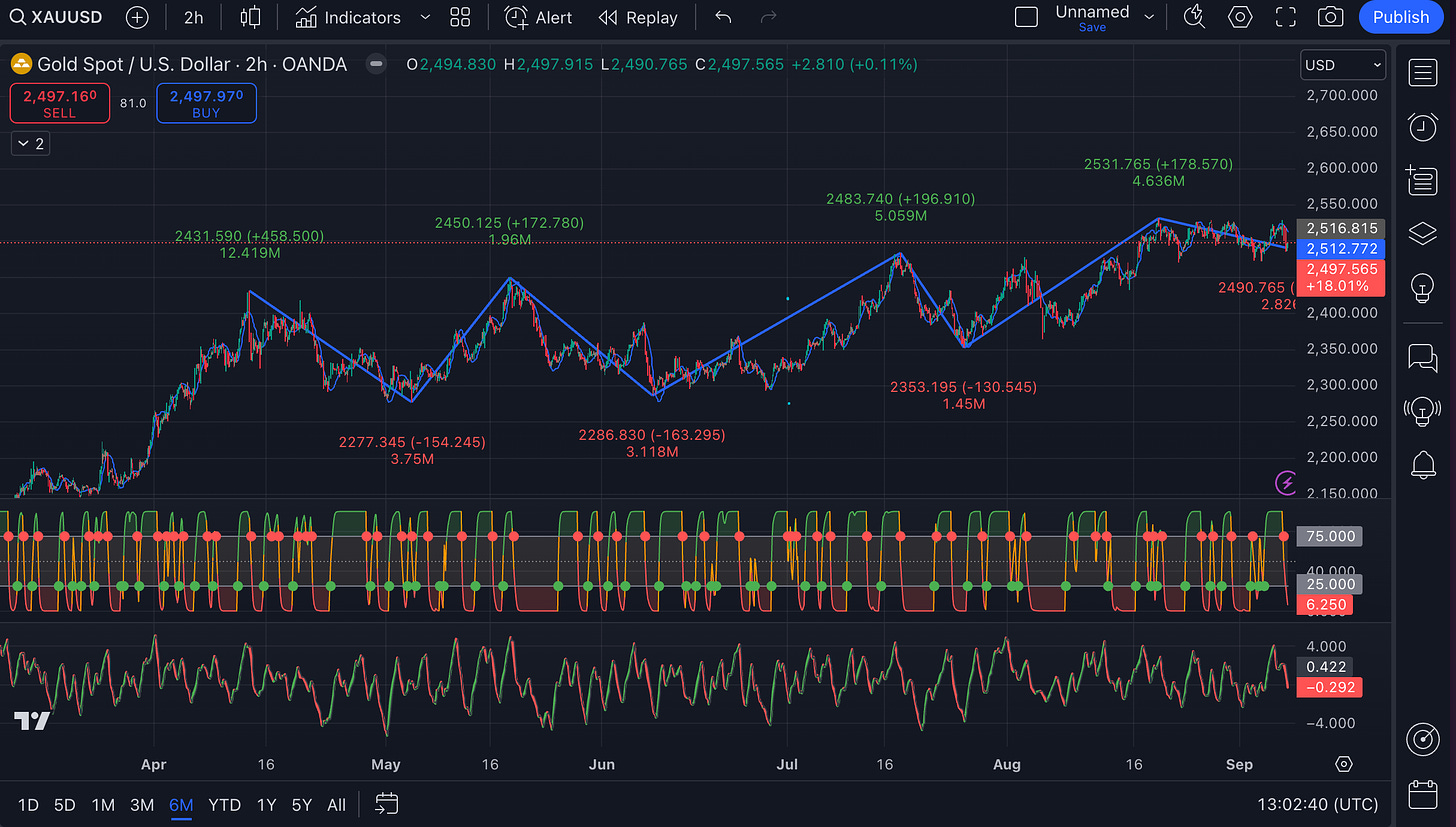
The big picture shows an uptrend. Unless we see a significant break below the last major swing low around $2,485, the bulls are still in control.
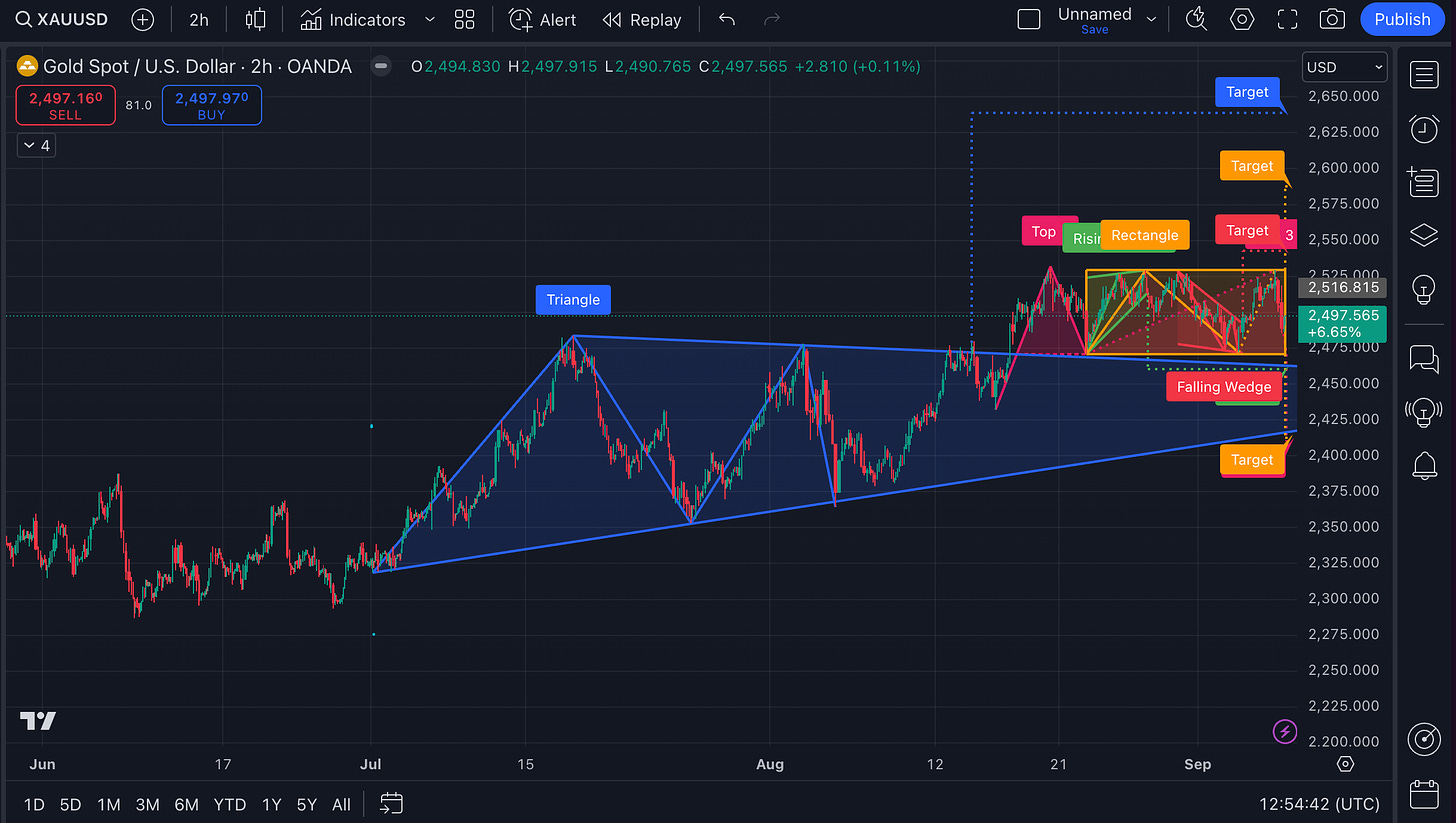
There's a large ascending triangle pattern with the upper resistance at around $2,480 and a rising lower support. This pattern often suggests bullish momentum is building, with buyers getting more aggressive at higher lows.
In the last 2 weeks, the price has been bouncing between support around $2,470 and resistance around $2,525, forming a rectangle pattern. This shows a period of consolidation before the next big move.
Inside the rectangle, we can spot a falling wedge pattern. This is typically a bullish reversal pattern, suggesting we might see an upward breakout soon:
The closest target is around $2,550
Next target at $2,600
The highest target is at $2,650
Right now, the price is at $2,497.56, which is near the middle of the recent trading range. The market seems to be deciding its next move.
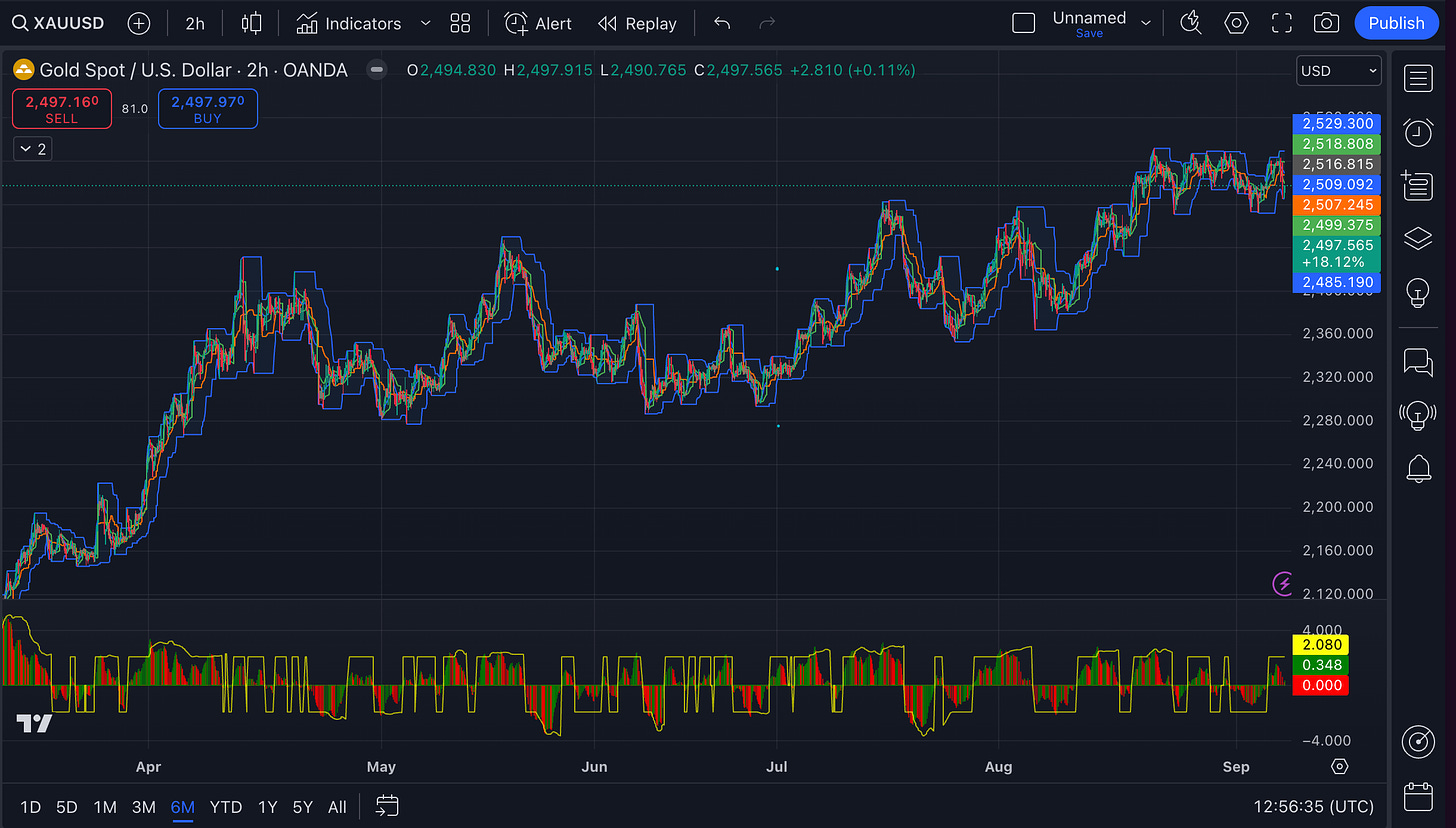
The LSMA is above the current price, which suggests we might be in a slight pullback within the larger uptrend. For bulls, it might be a good buying opportunity.
MACD suggest we might be at a turning point.
Keep reading with a 7-day free trial
Subscribe to The Gold Trader to keep reading this post and get 7 days of free access to the full post archives.


