


Holiday trading keeps Gold flat, but $2,600 could be tested soon [Weekly XAU/USD analysis + forecast]


Hello, fellow traders!
Gold had a steady but slightly up-and-down week, starting around $2,620 per ounce. Prices got an early boost when the US dollar weakened, but they dipped later on when Treasury yields rose and the dollar regained strength, pulling Gold toward $2,610.
Worries about demand added more pressure. India, one of the biggest Gold buyers, is expecting a big drop in imports this month. Still, ongoing tensions in Europe and the Middle East helped give Gold some safe-haven support.
By midweek, thinner holiday trading volumes pushed Gold back above $2,610, hitting $2,630 on Thursday. The market finished the week just under $2,630, with traders staying cautious about the Fed’s policies and continued uncertainties around the world.
In this week’s update, I’ll:
Decode the technicals: pinpoint the hidden technical clues that could signal a sudden breakout—or a ruthless selloff.
Unpack the global data: highlight the global economic numbers making waves and where they could push Gold’s price in the mid term.
Identify strategic “make-or-break” price zones
Spot the sentiment shifts: what’s brewing beneath the surface and why this matters for Gold’s future direction.
Predict what’s next for Gold: give away my short-term and mid-term calls for where XAU/USD is headed.


📊 Let’s look at the technical data
Last 3 months - 1h charts
Key takeaway:
Right now, Gold is in a corrective phase, with short-term signals tilting bearish: a bearish flag, negative PPO, CCI in negative territory, and a correction wave still in play.
Short-term bounces may happen, but a big chunk of the trade depends on how the price behaves around that 2,640–2,650 pivot. Bulls need to reclaim 2,650 and sustain above it for the medium-term uptrend to resume.
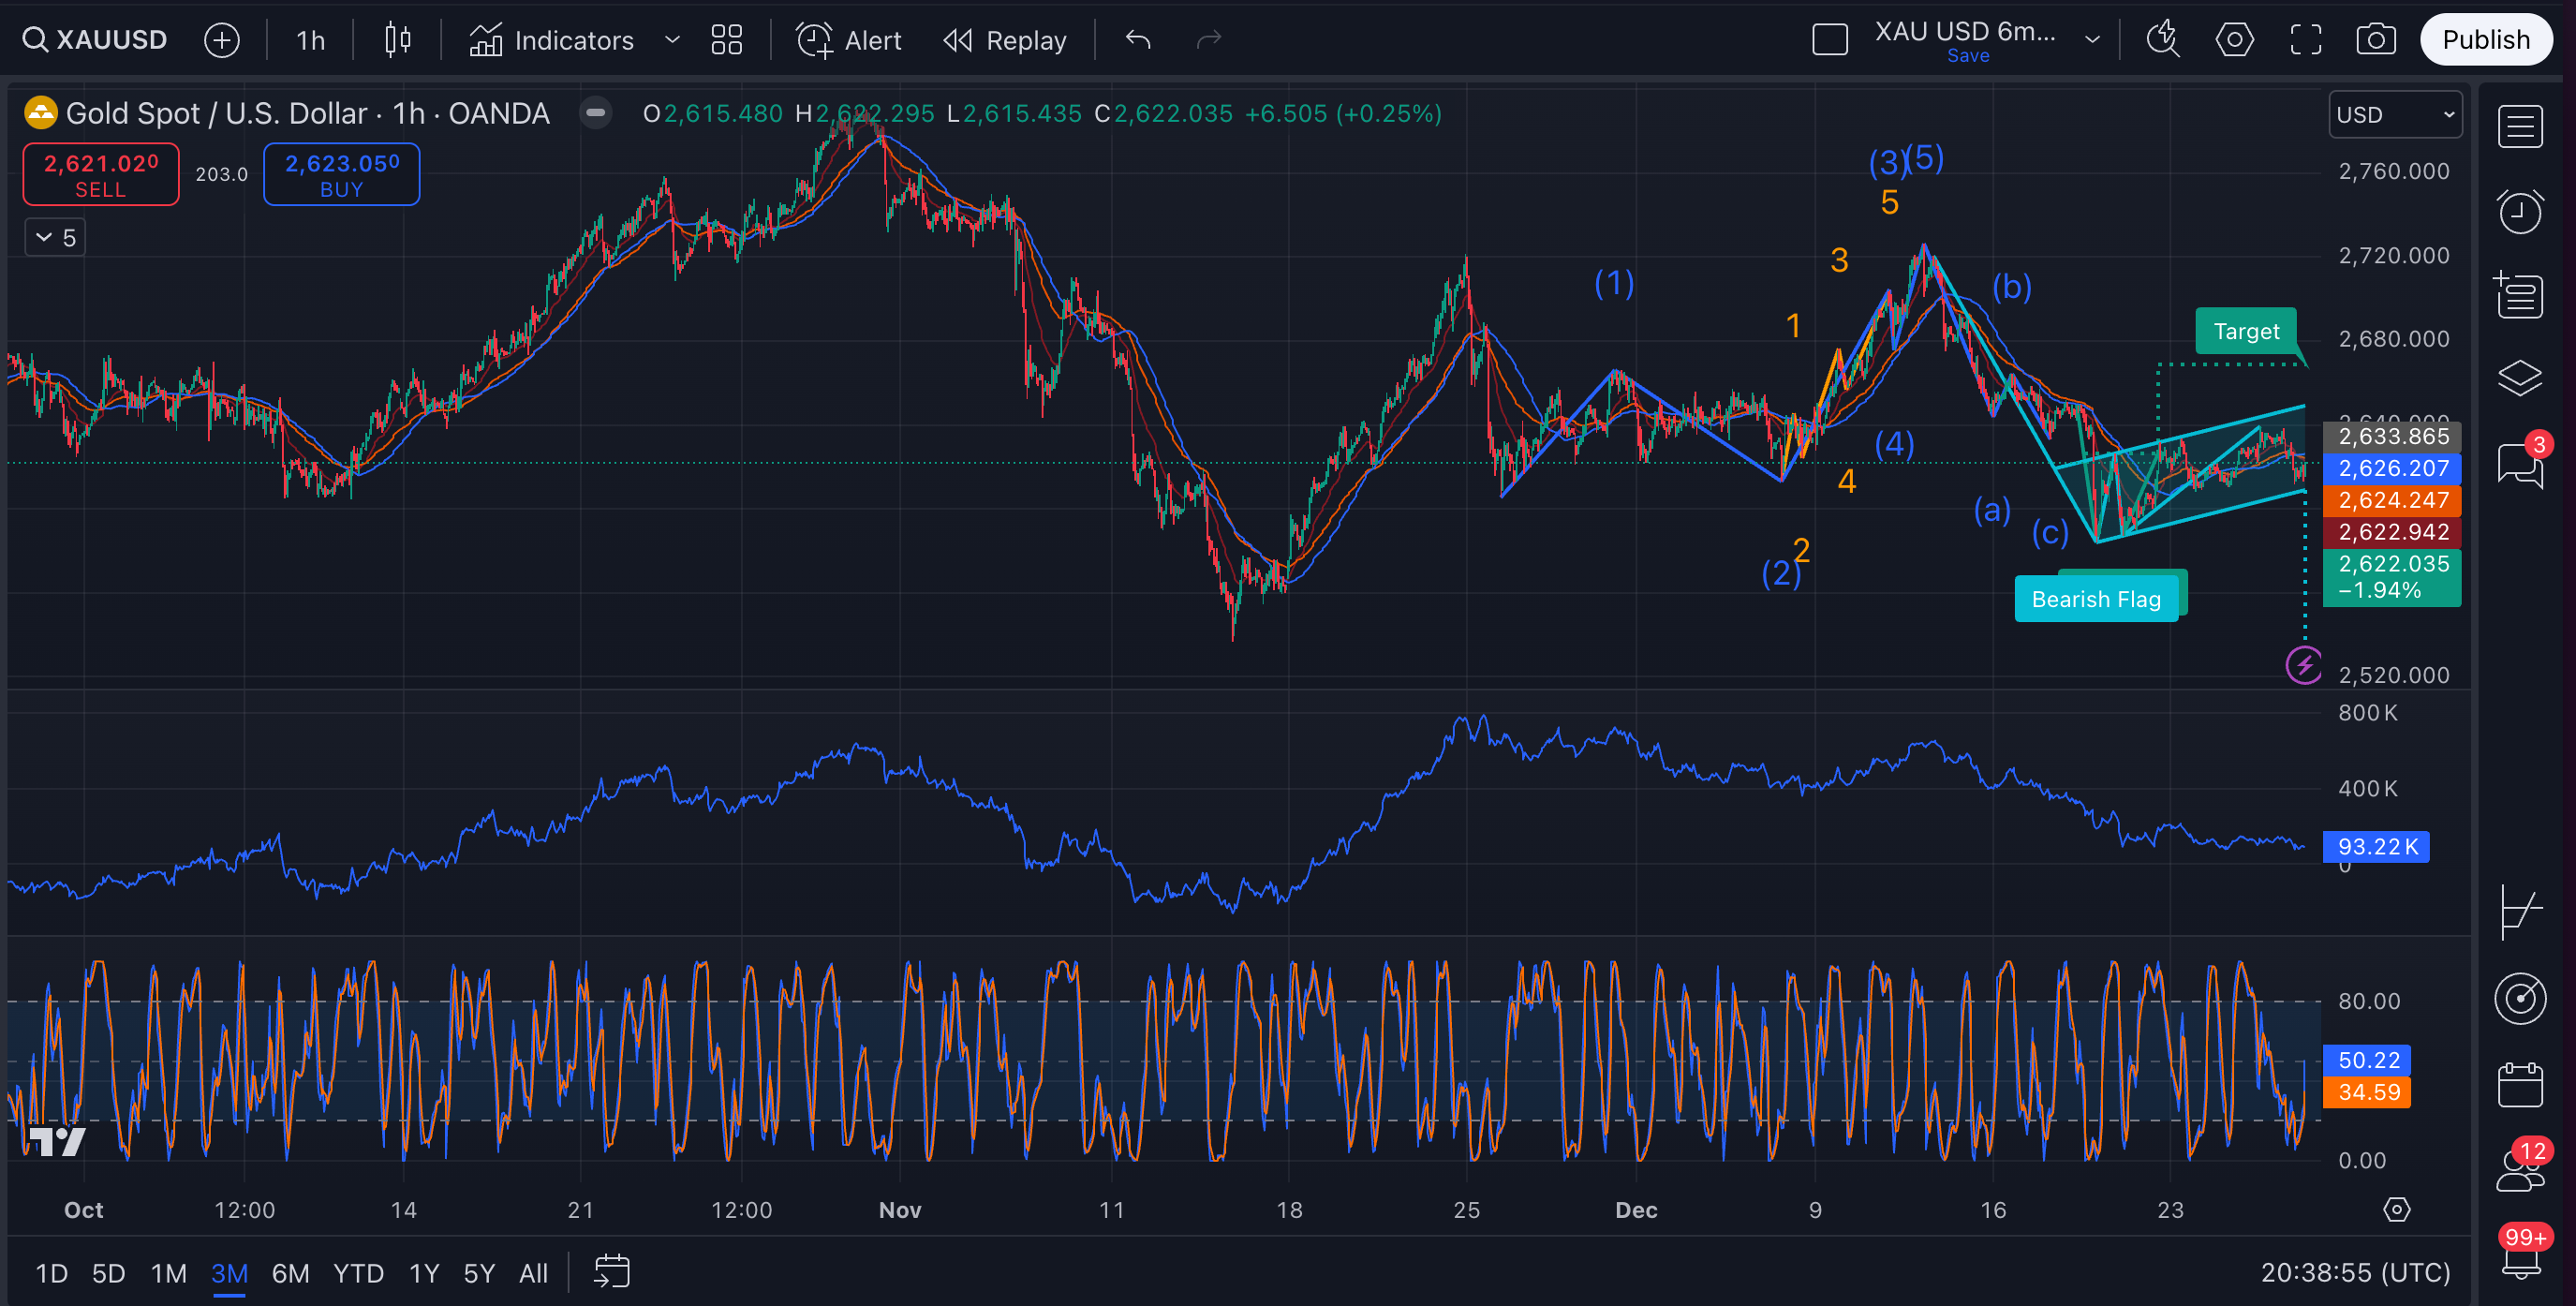
Bearish flag breakdown likely: The current bearish flag aligns with the corrective ABC Elliot Wave structure, suggesting the price might still dip lower. If the flag breaks, price could target as low as 2,560 - 2,540.
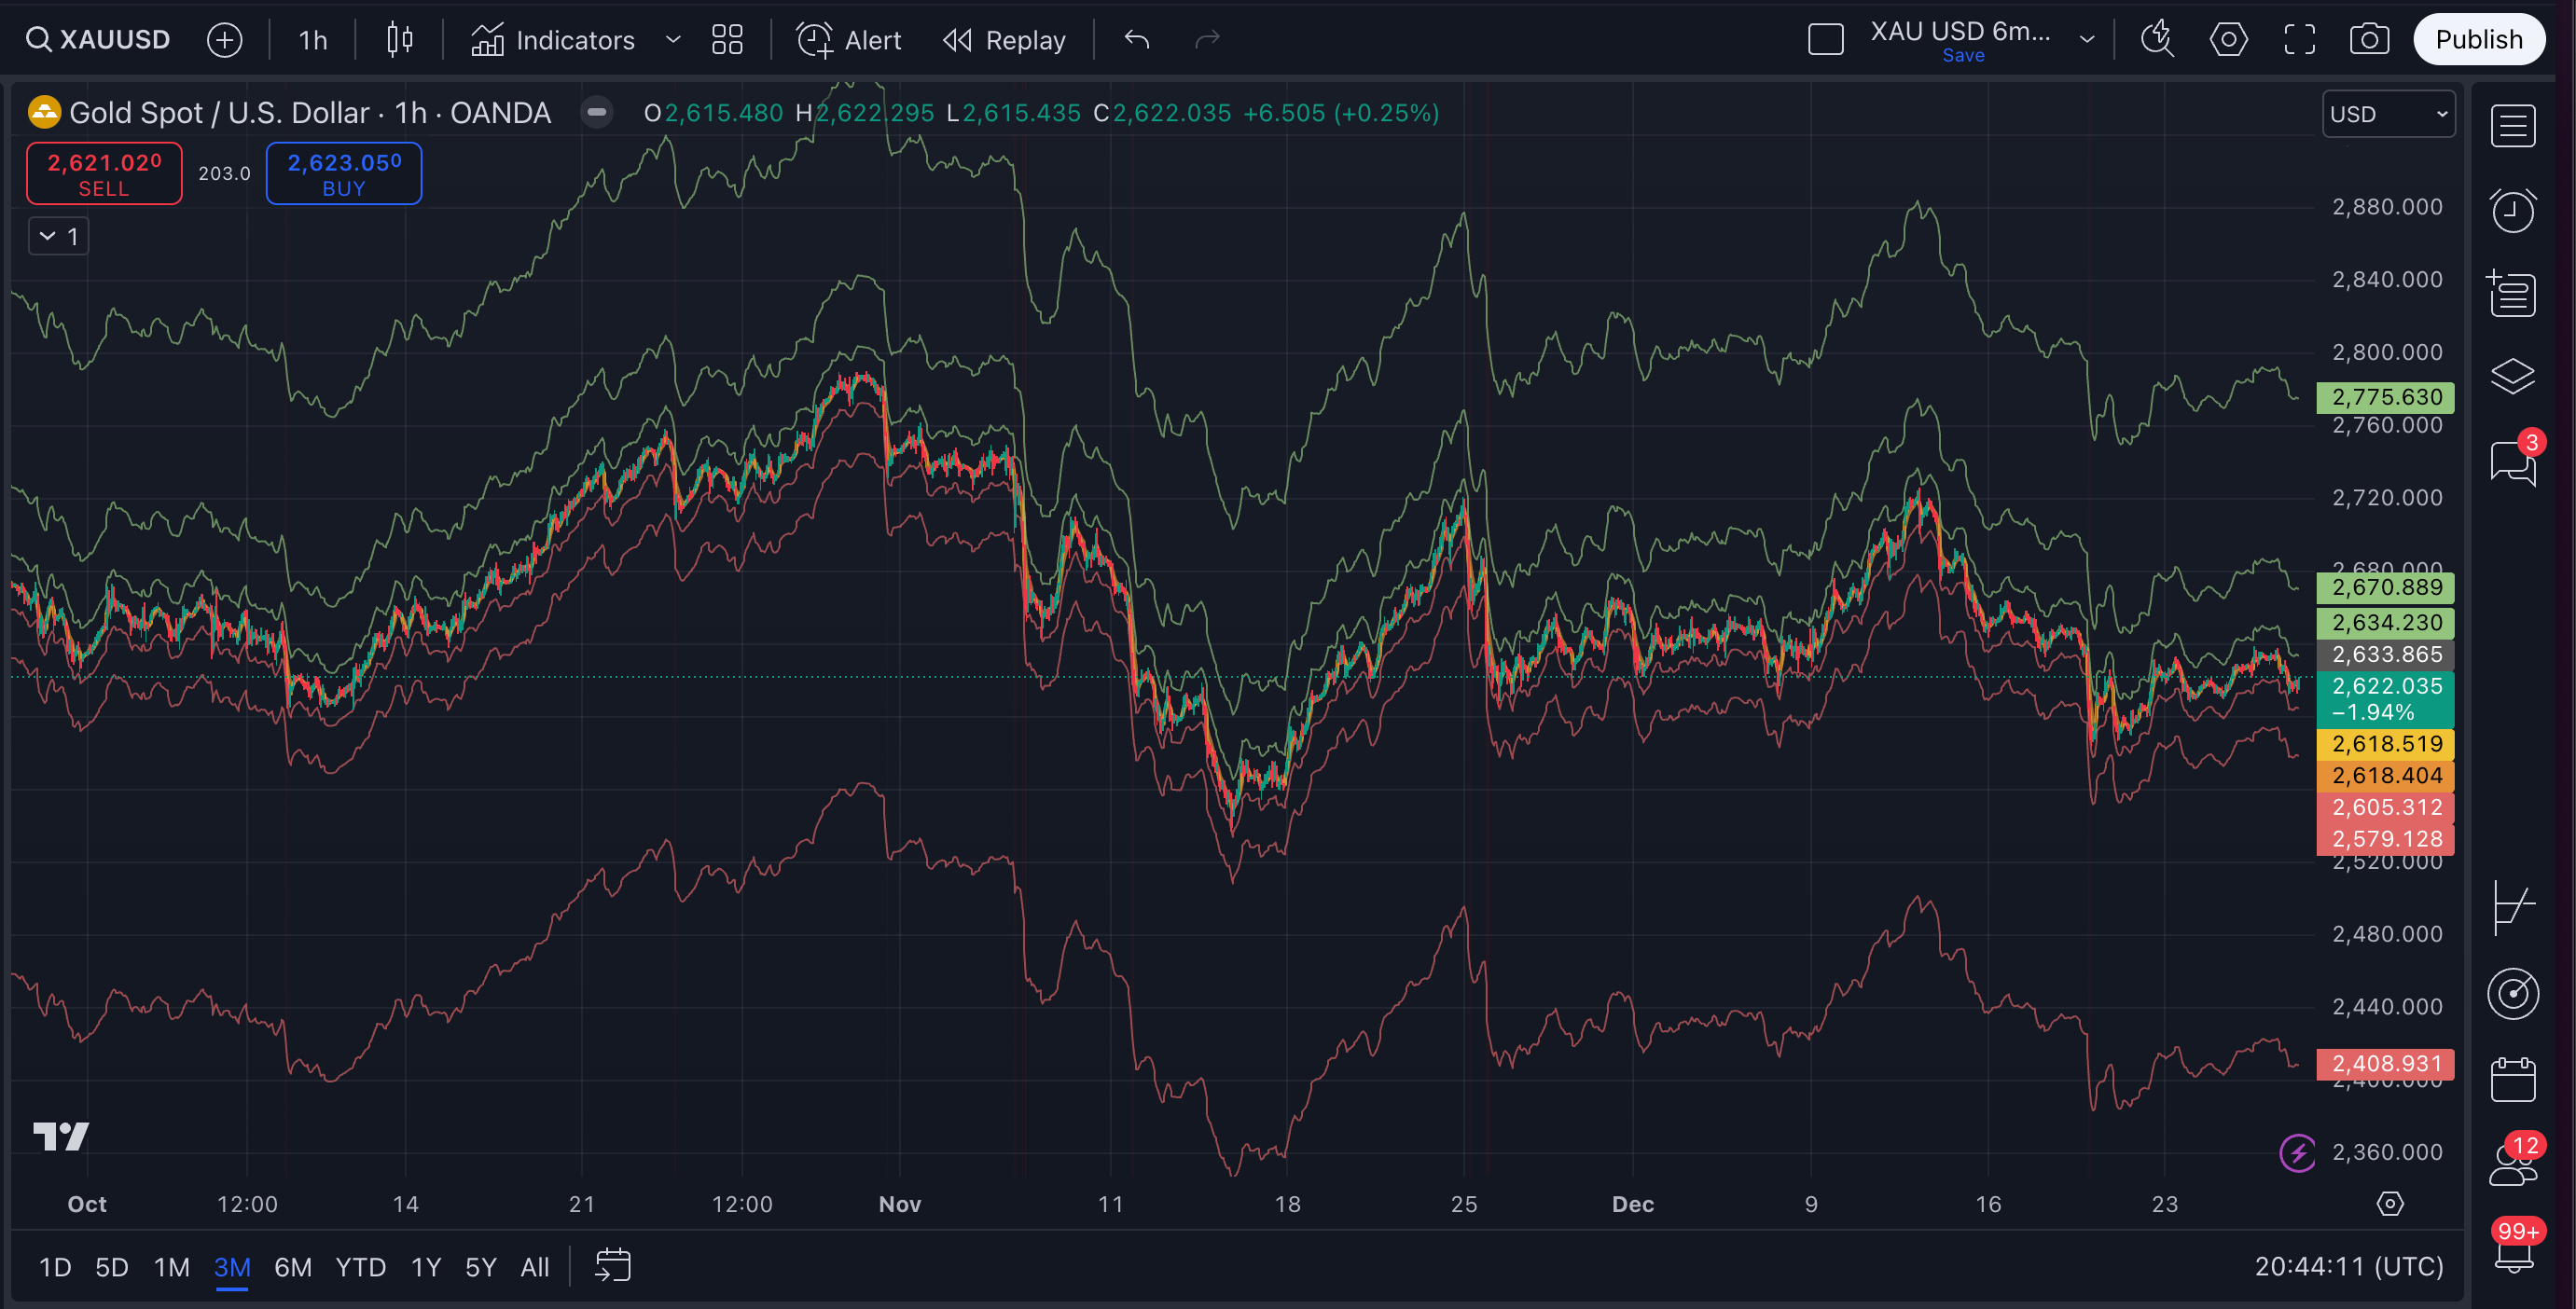
Volume is neutral: OBV is relatively elevated but has not made a strong new high since the main price peak. This suggests volume isn’t super-bullish, yet it’s not collapsing either. Could be a sign of choppy, sideways action until a real directional catalyst appears.
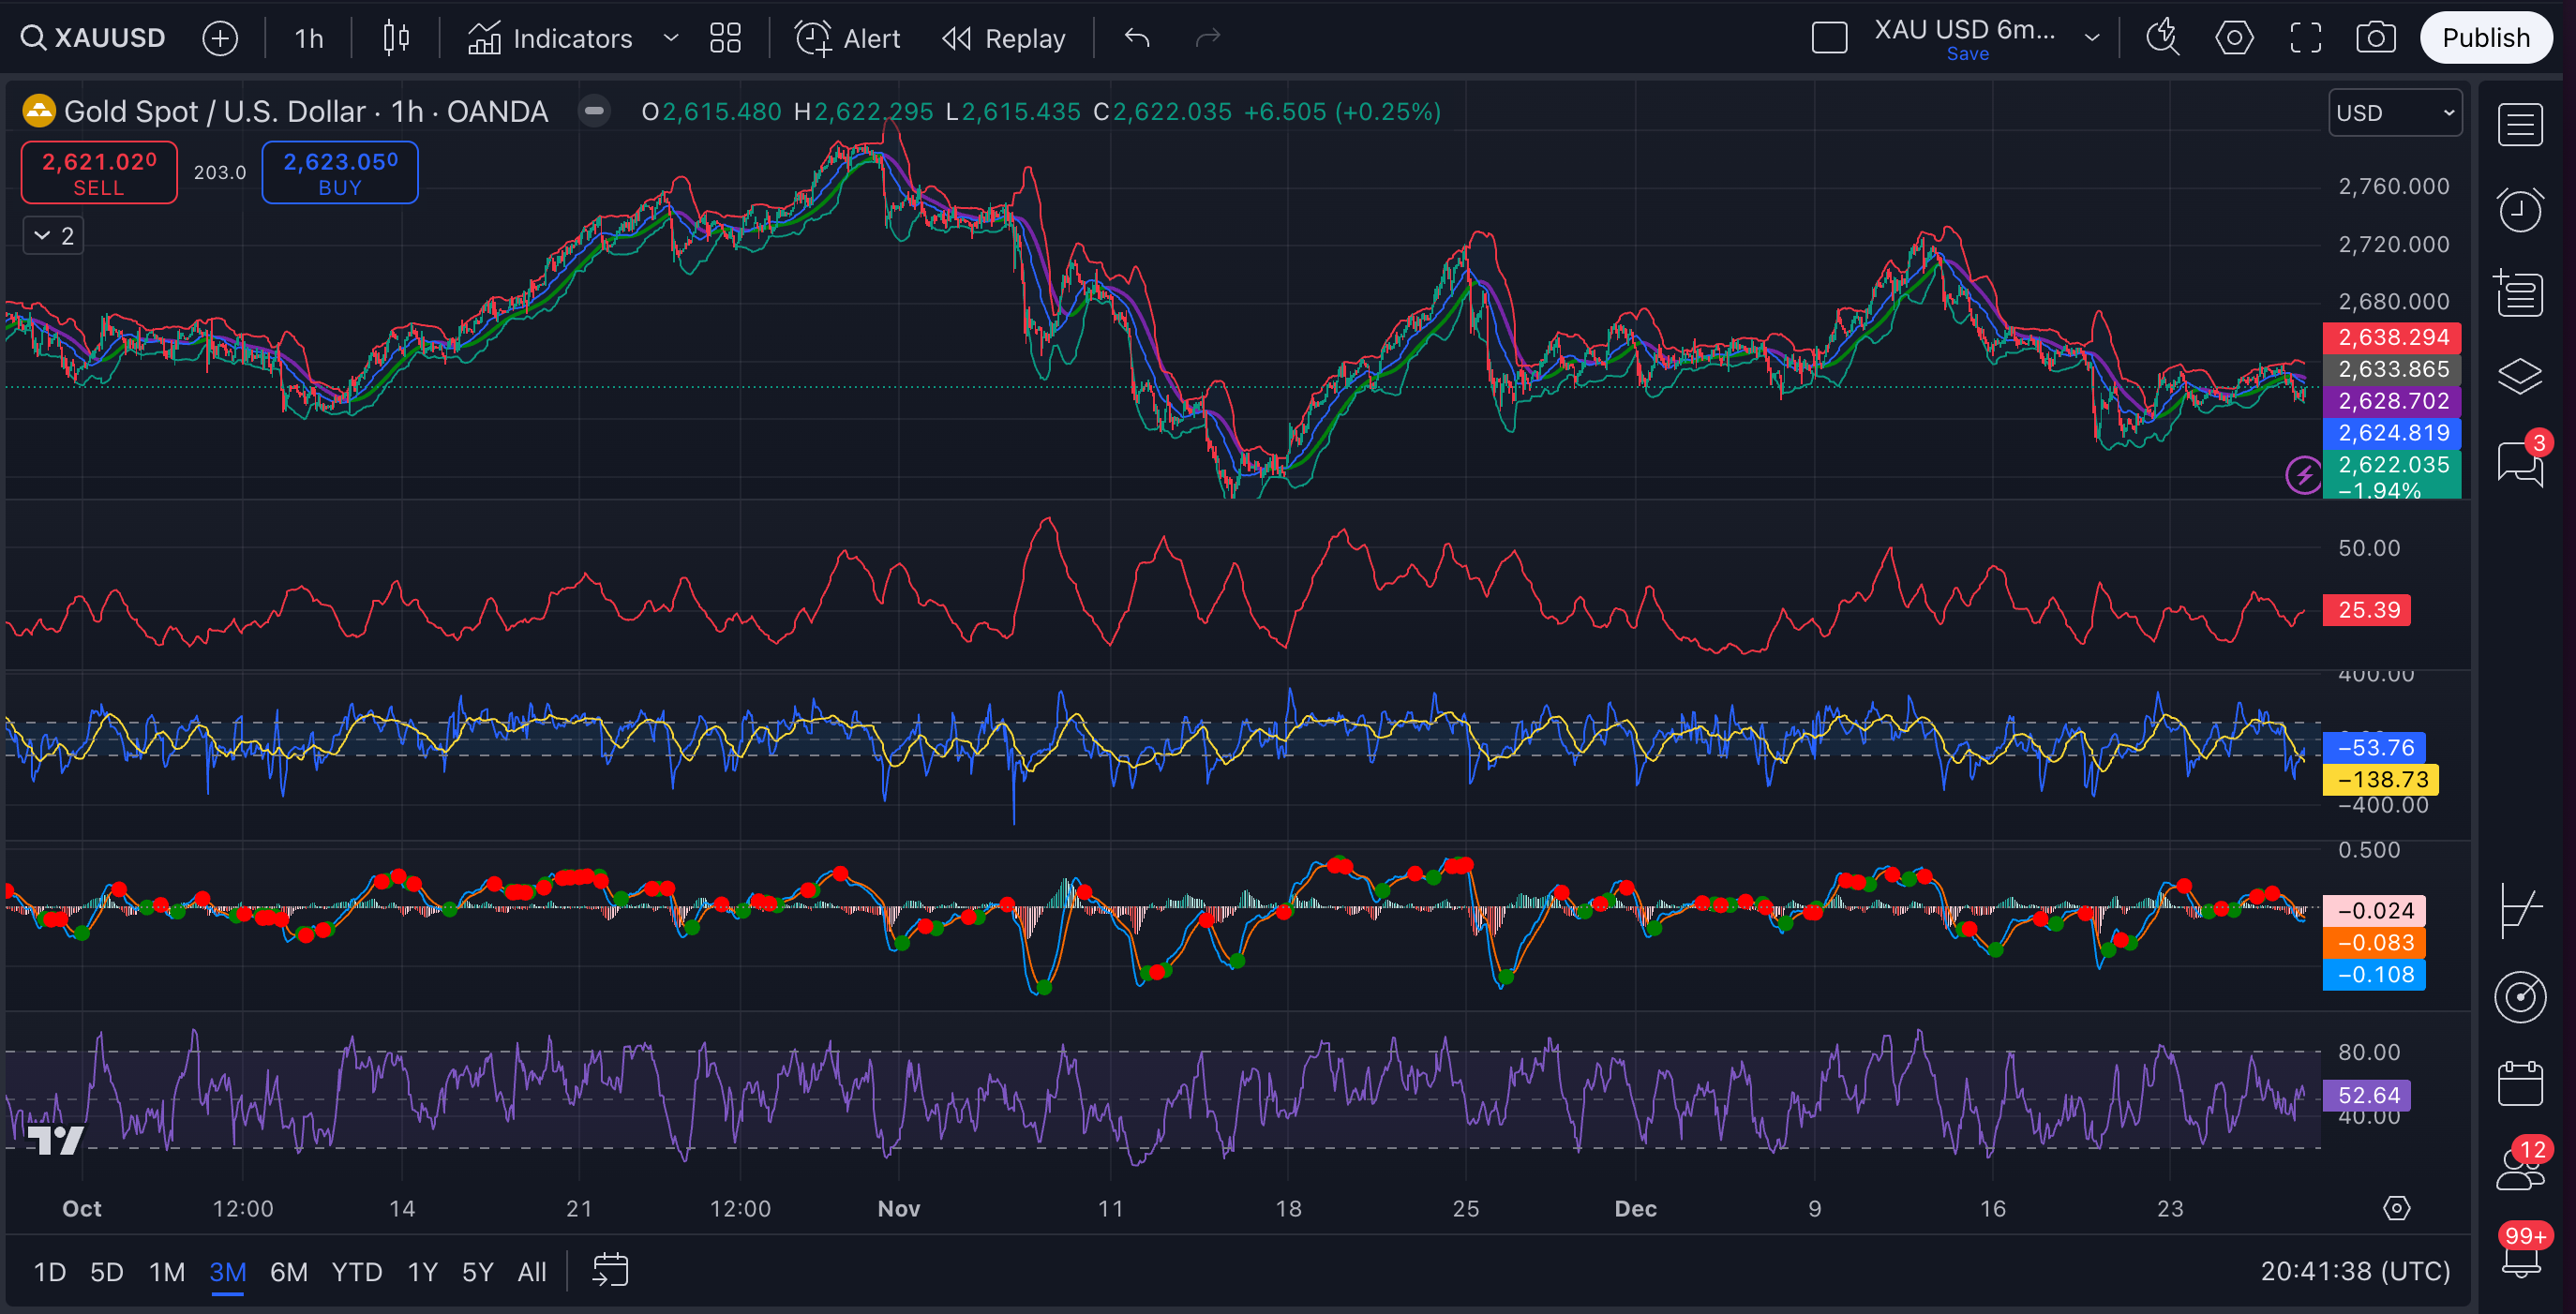
Momentum indicators mixed:
Oversold conditions on Stochastic RSI and CCI suggest a short-term bounce toward 2,650 is possible. A clean break above will likely open the door to retest ~2,680, ~2,700.
However, ADX and PPO favor bearish breakdown. So failure to break above 2,650 will likely result in renewed selling pressure. Look for a retest of the 2,600 handle.
Next move:
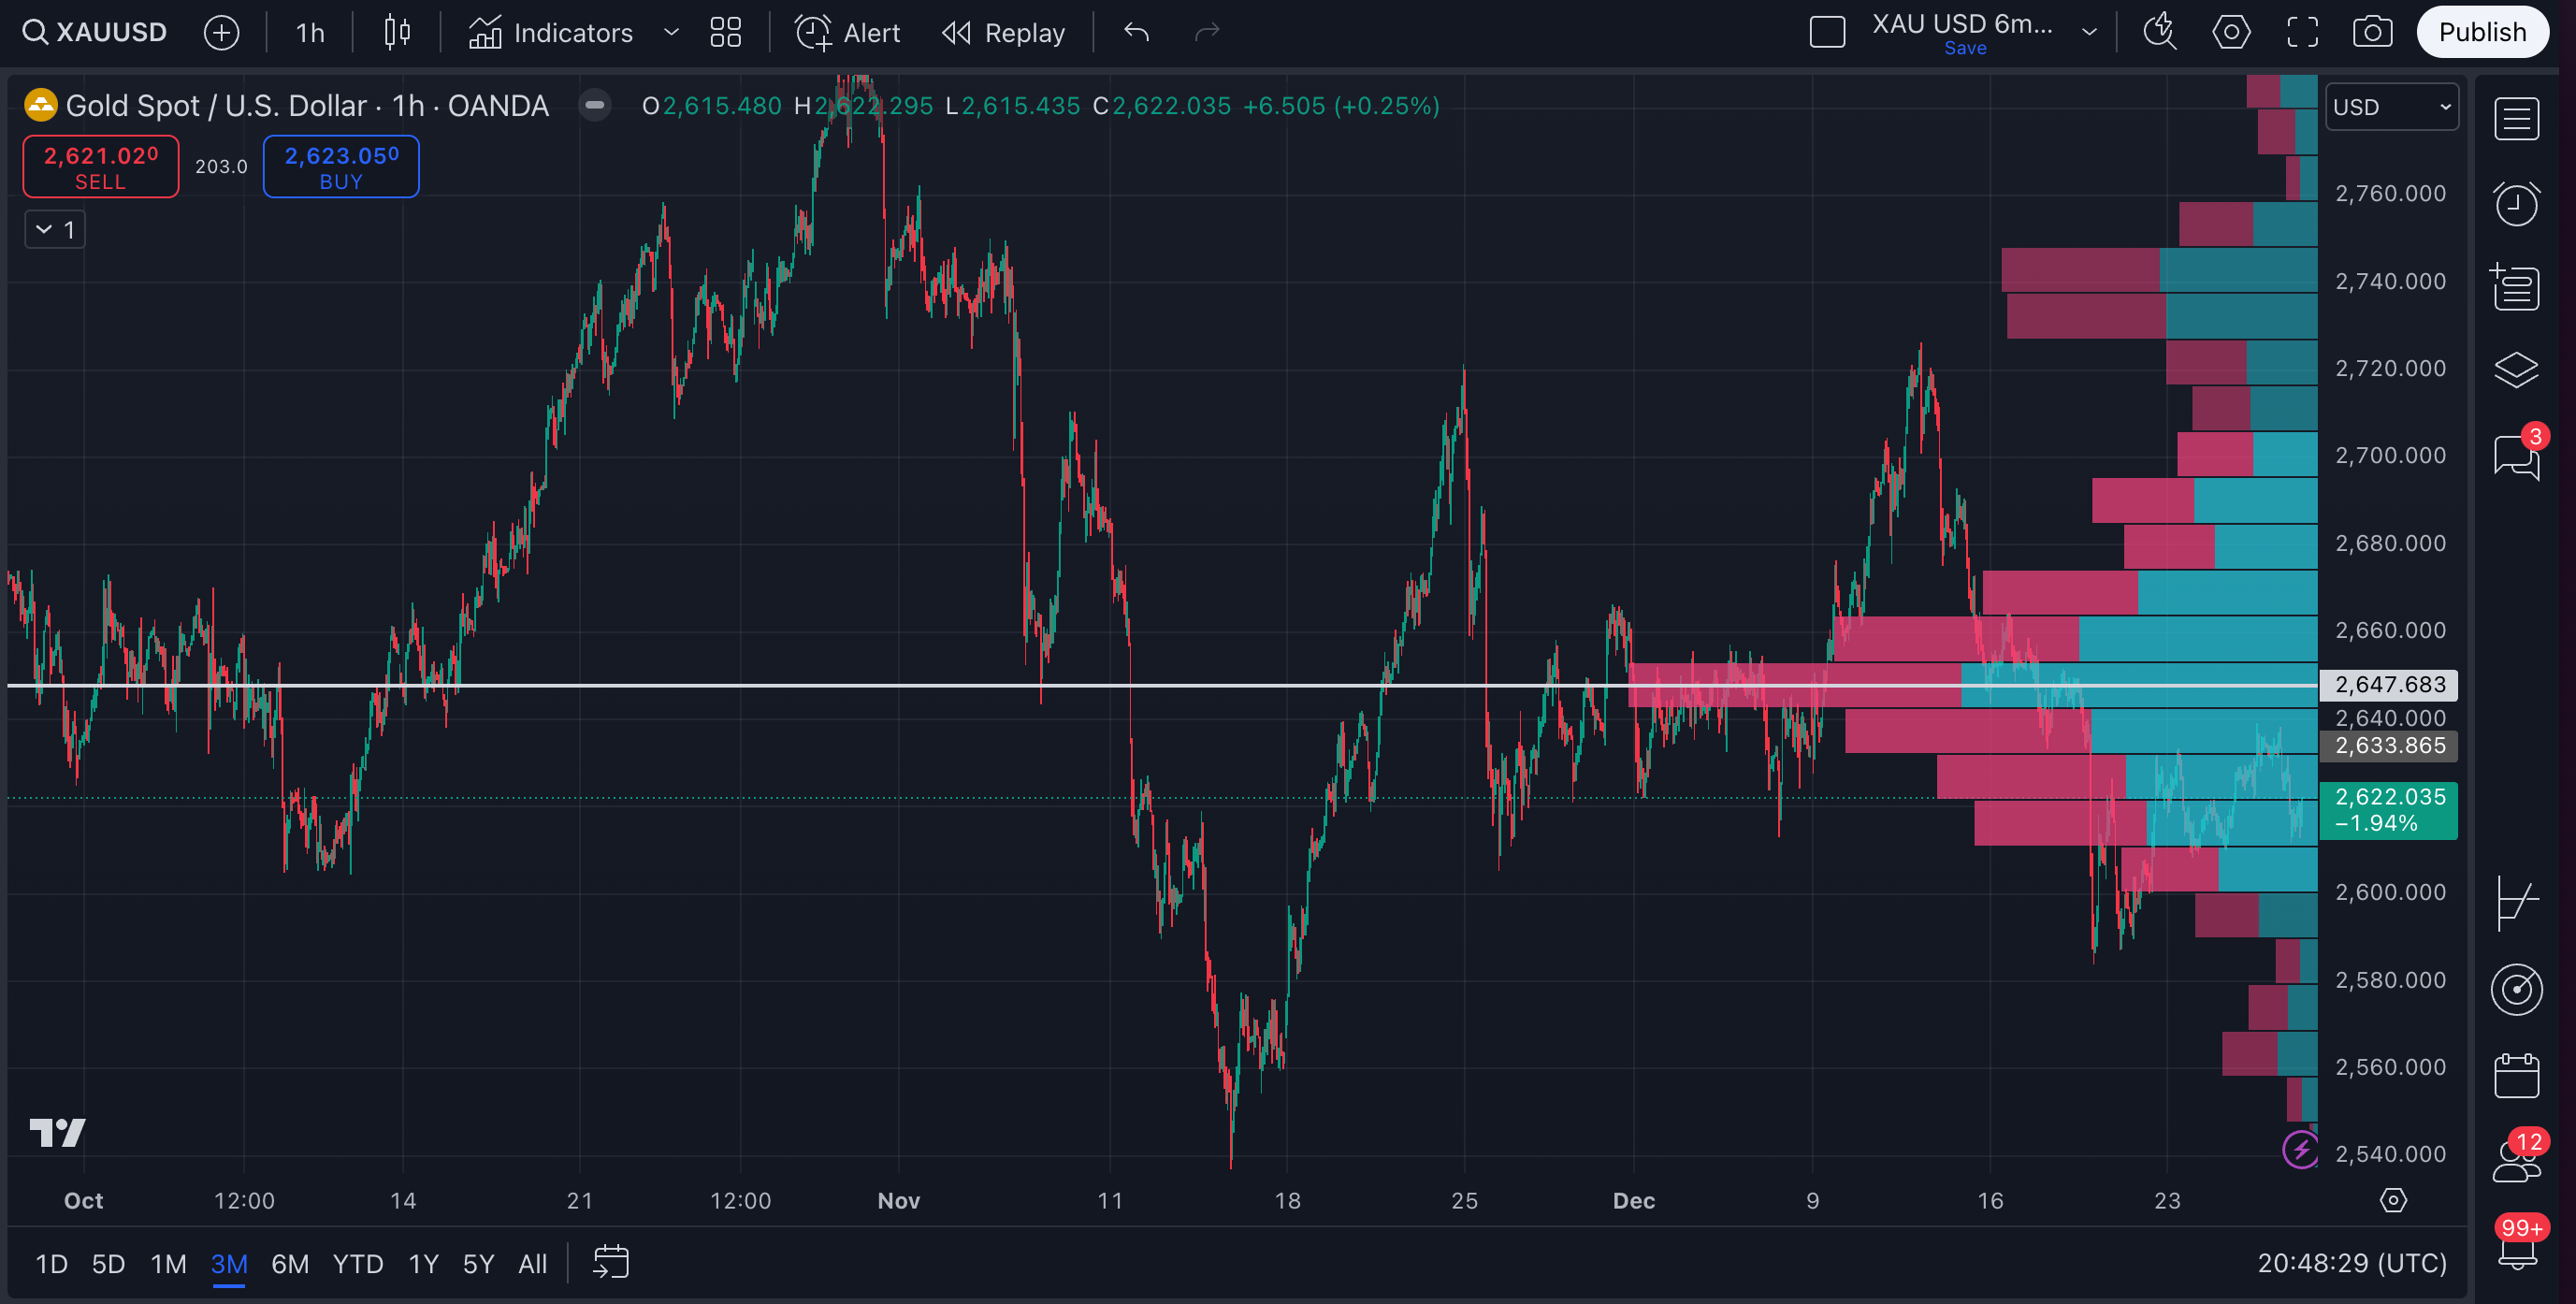
A breakout above 2,650 or below 2,580 will likely determine the next major trend.
Sideways consolidation between 2,600–2,650 is also a possibility if volatility remains low.
Last 30 days - 30min charts
Key takeaway:
The 30-min charts echo the range-bound movement from the higher timeframe. Indicators mostly sit in neutral territory, so short-term trades might be scalps or range plays until we get that bigger breakout (above 2,650) or breakdown (below 2,600). For the next days, expect price to hover between
Keep reading with a 7-day free trial
Subscribe to The Gold Trader to keep reading this post and get 7 days of free access to the full post archives.