Gold’s technicals show weakness: Are central bank buyers and recession fears enough to prop it up?[Weekly XAU/USD analysis + forecast]
Hello, fellow traders!
Gold hit a new high above $2,750, boosted by China’s rate cut and some safe-haven demand due to rising tensions abroad. By midweek, though, a stronger dollar and higher yields led to a pullback, with some profit-taking adding to the dip.
On Thursday, solid U.S. business data signaled decent economic growth, making it tough for Gold to bounce back much. Prices stayed pretty flat on Friday, with a bit of up-and-down trading as the week wrapped up.
In this week’s update, I’ll:
Look at the technical setup of XAU/USD and what it tells us about potential future price action.
Highlight the recent key support and resistance levels.
Break down this week’s key economic data from around the world (audio available!) and how it might affect XAU/USD in the mid term.
Explain the latest shift in the market sentiment as to the COT report and what it means for Gold's outlook.
Share my short-term and mid-term predictions on XAU/USD price action and trajectory.
📊 Let’s look at the technical data
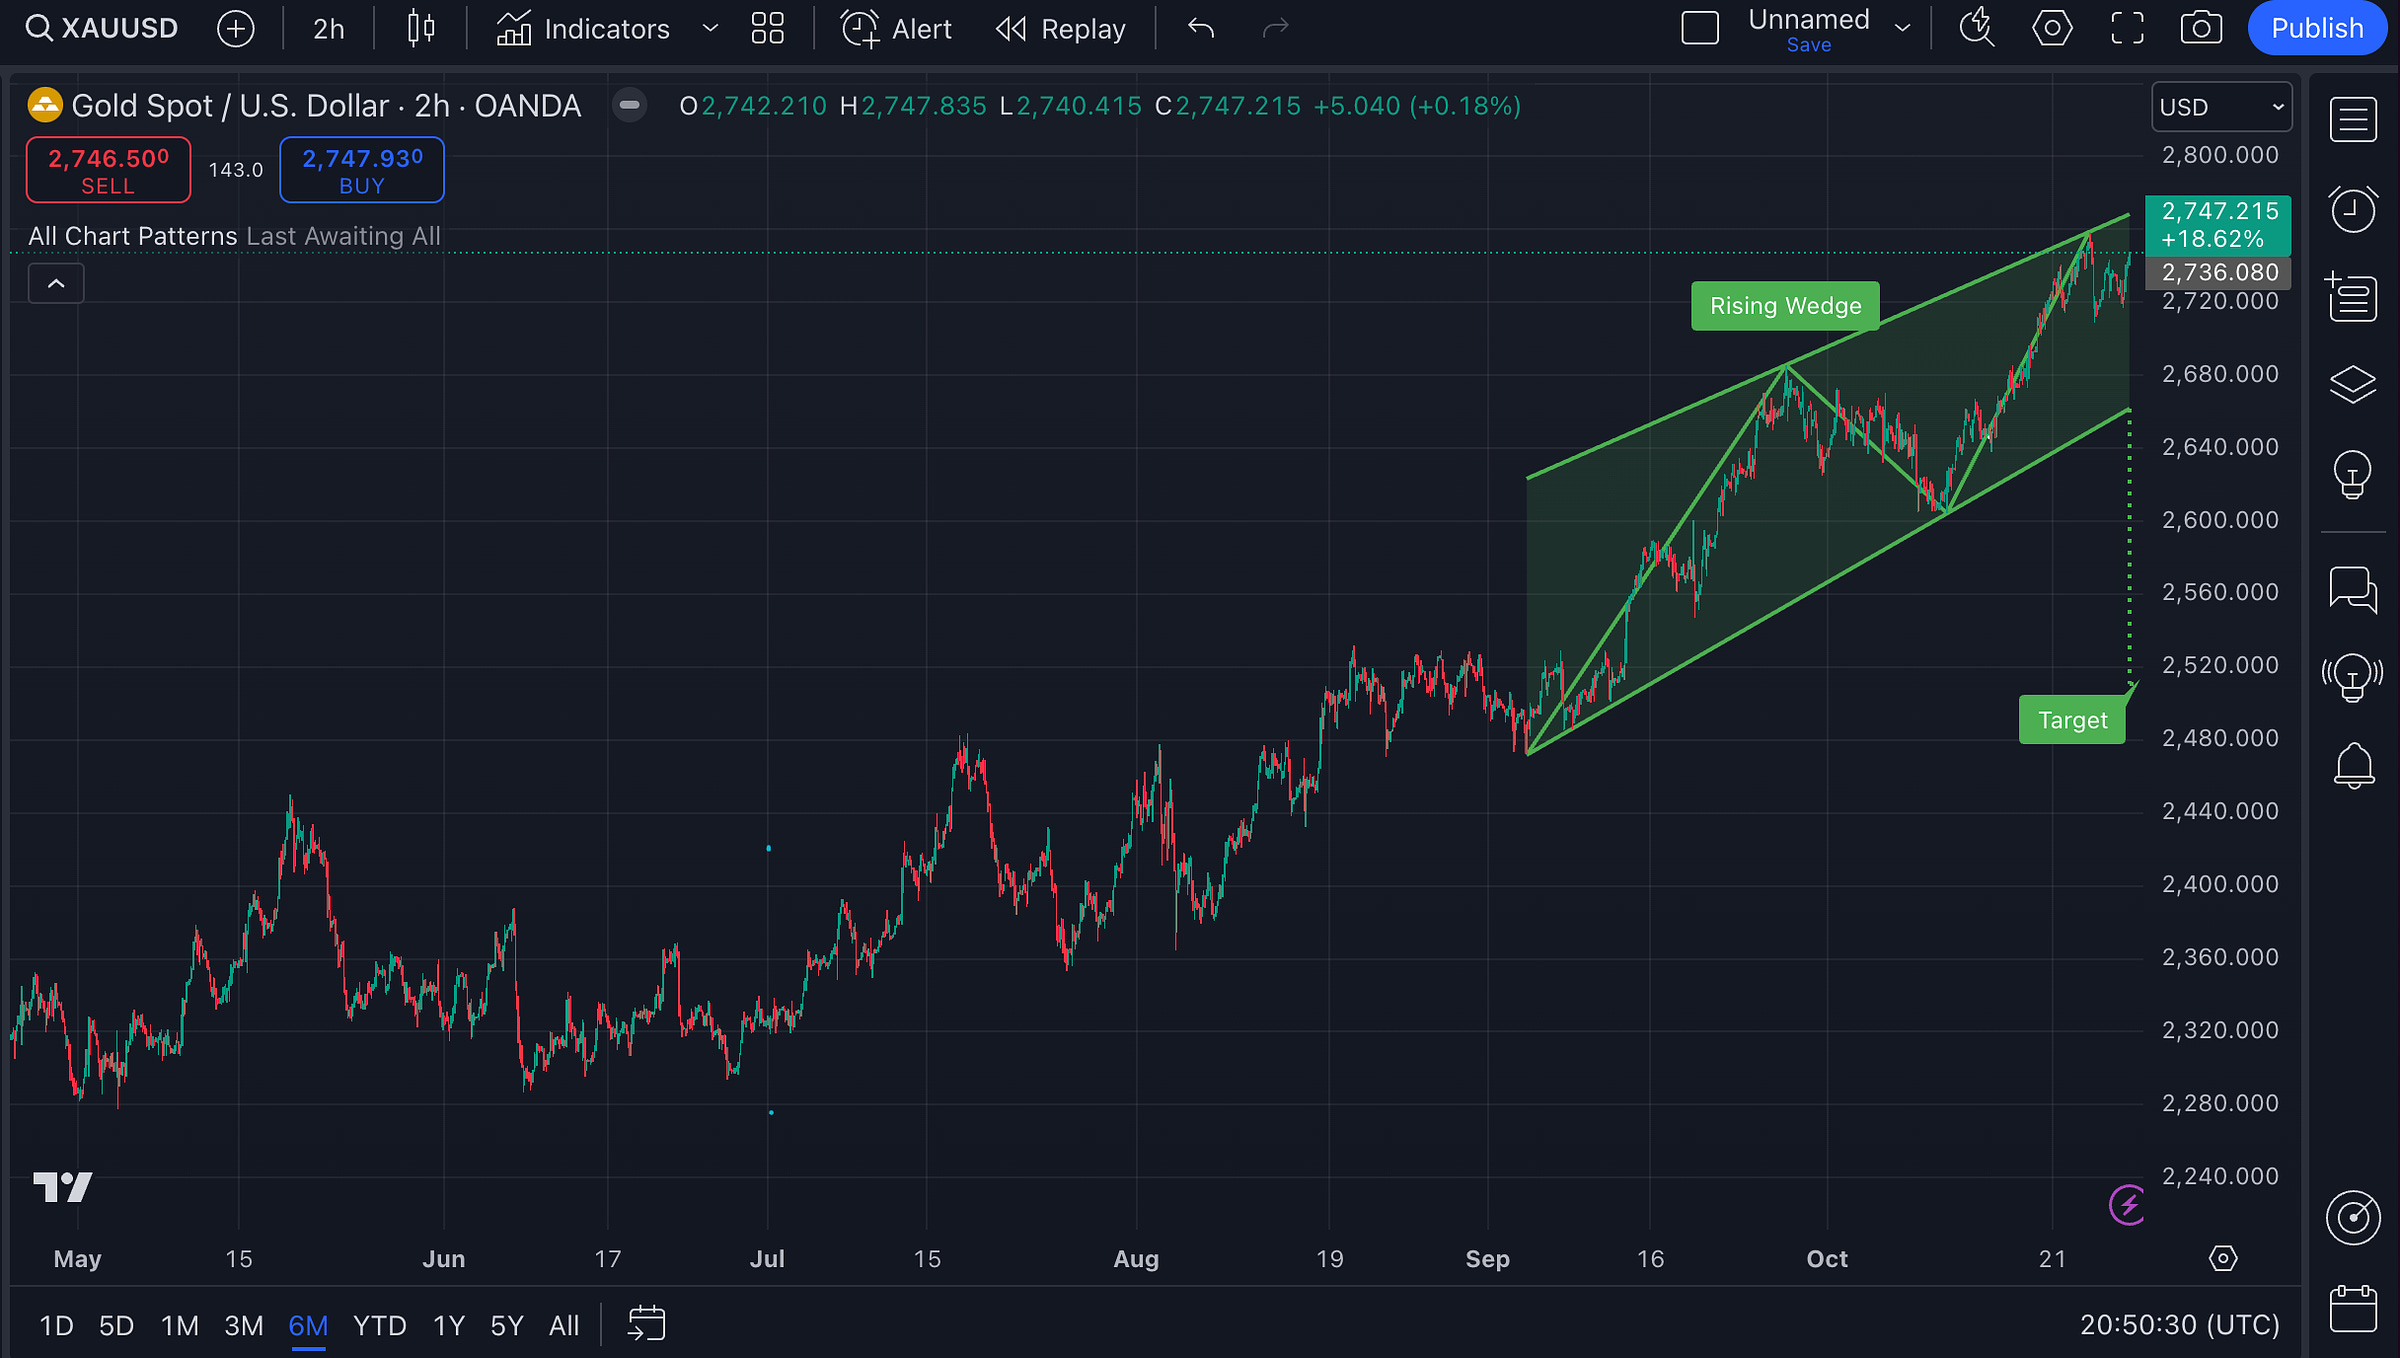
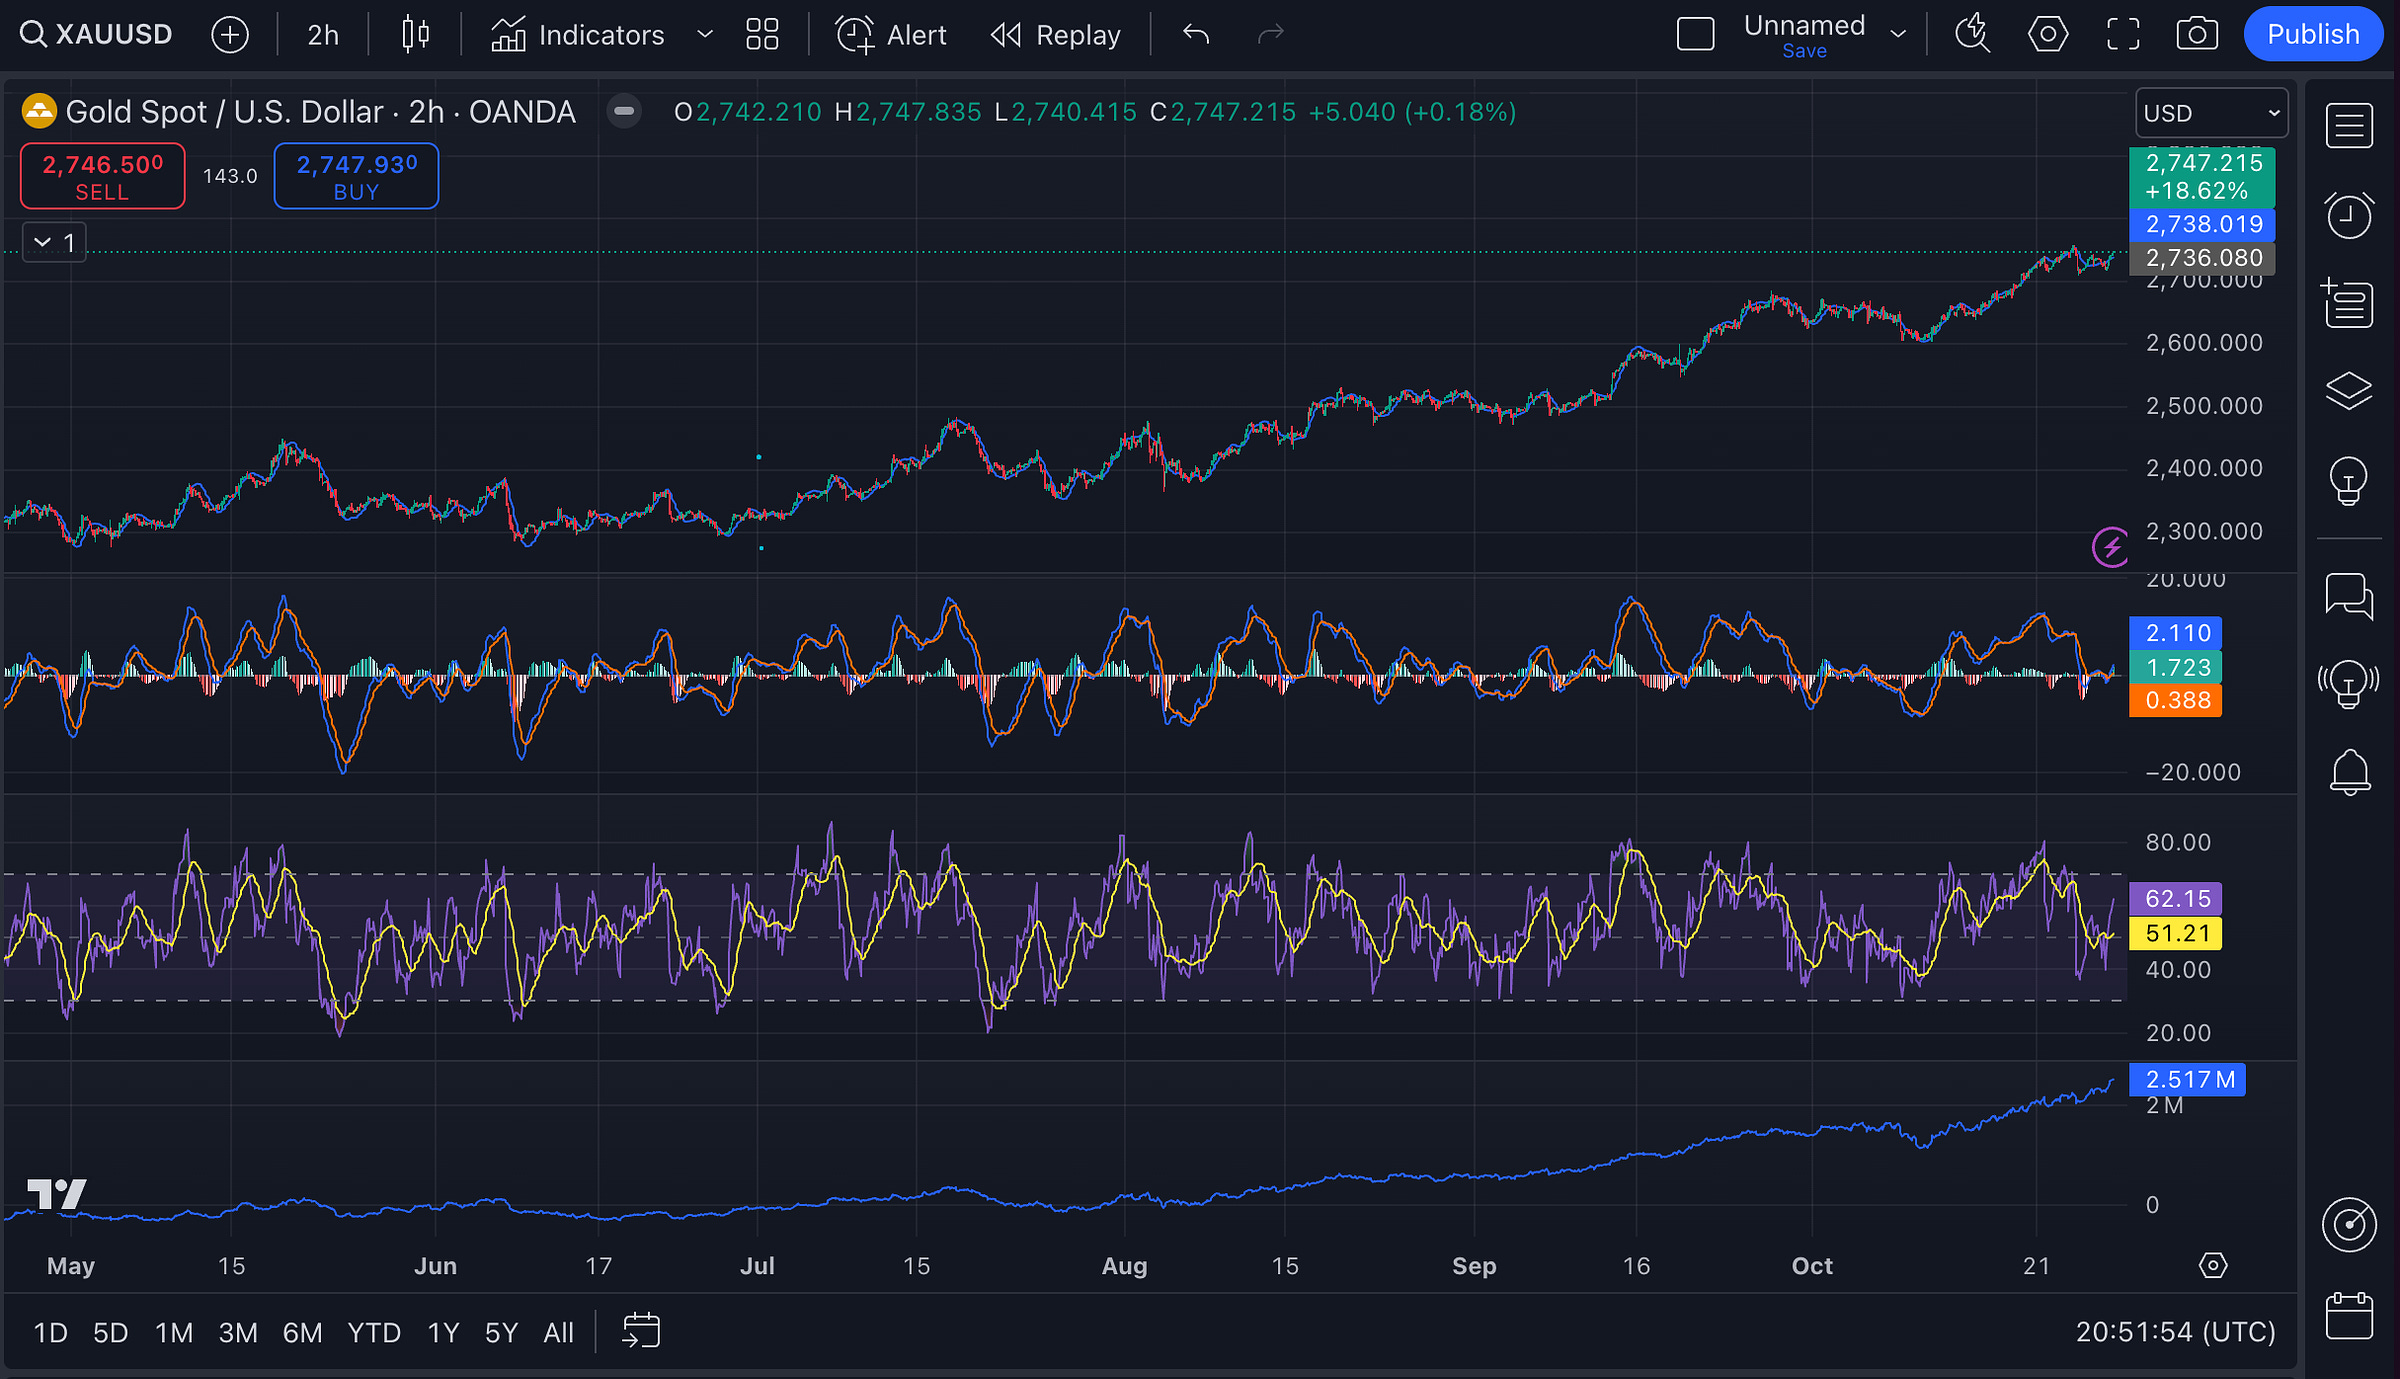
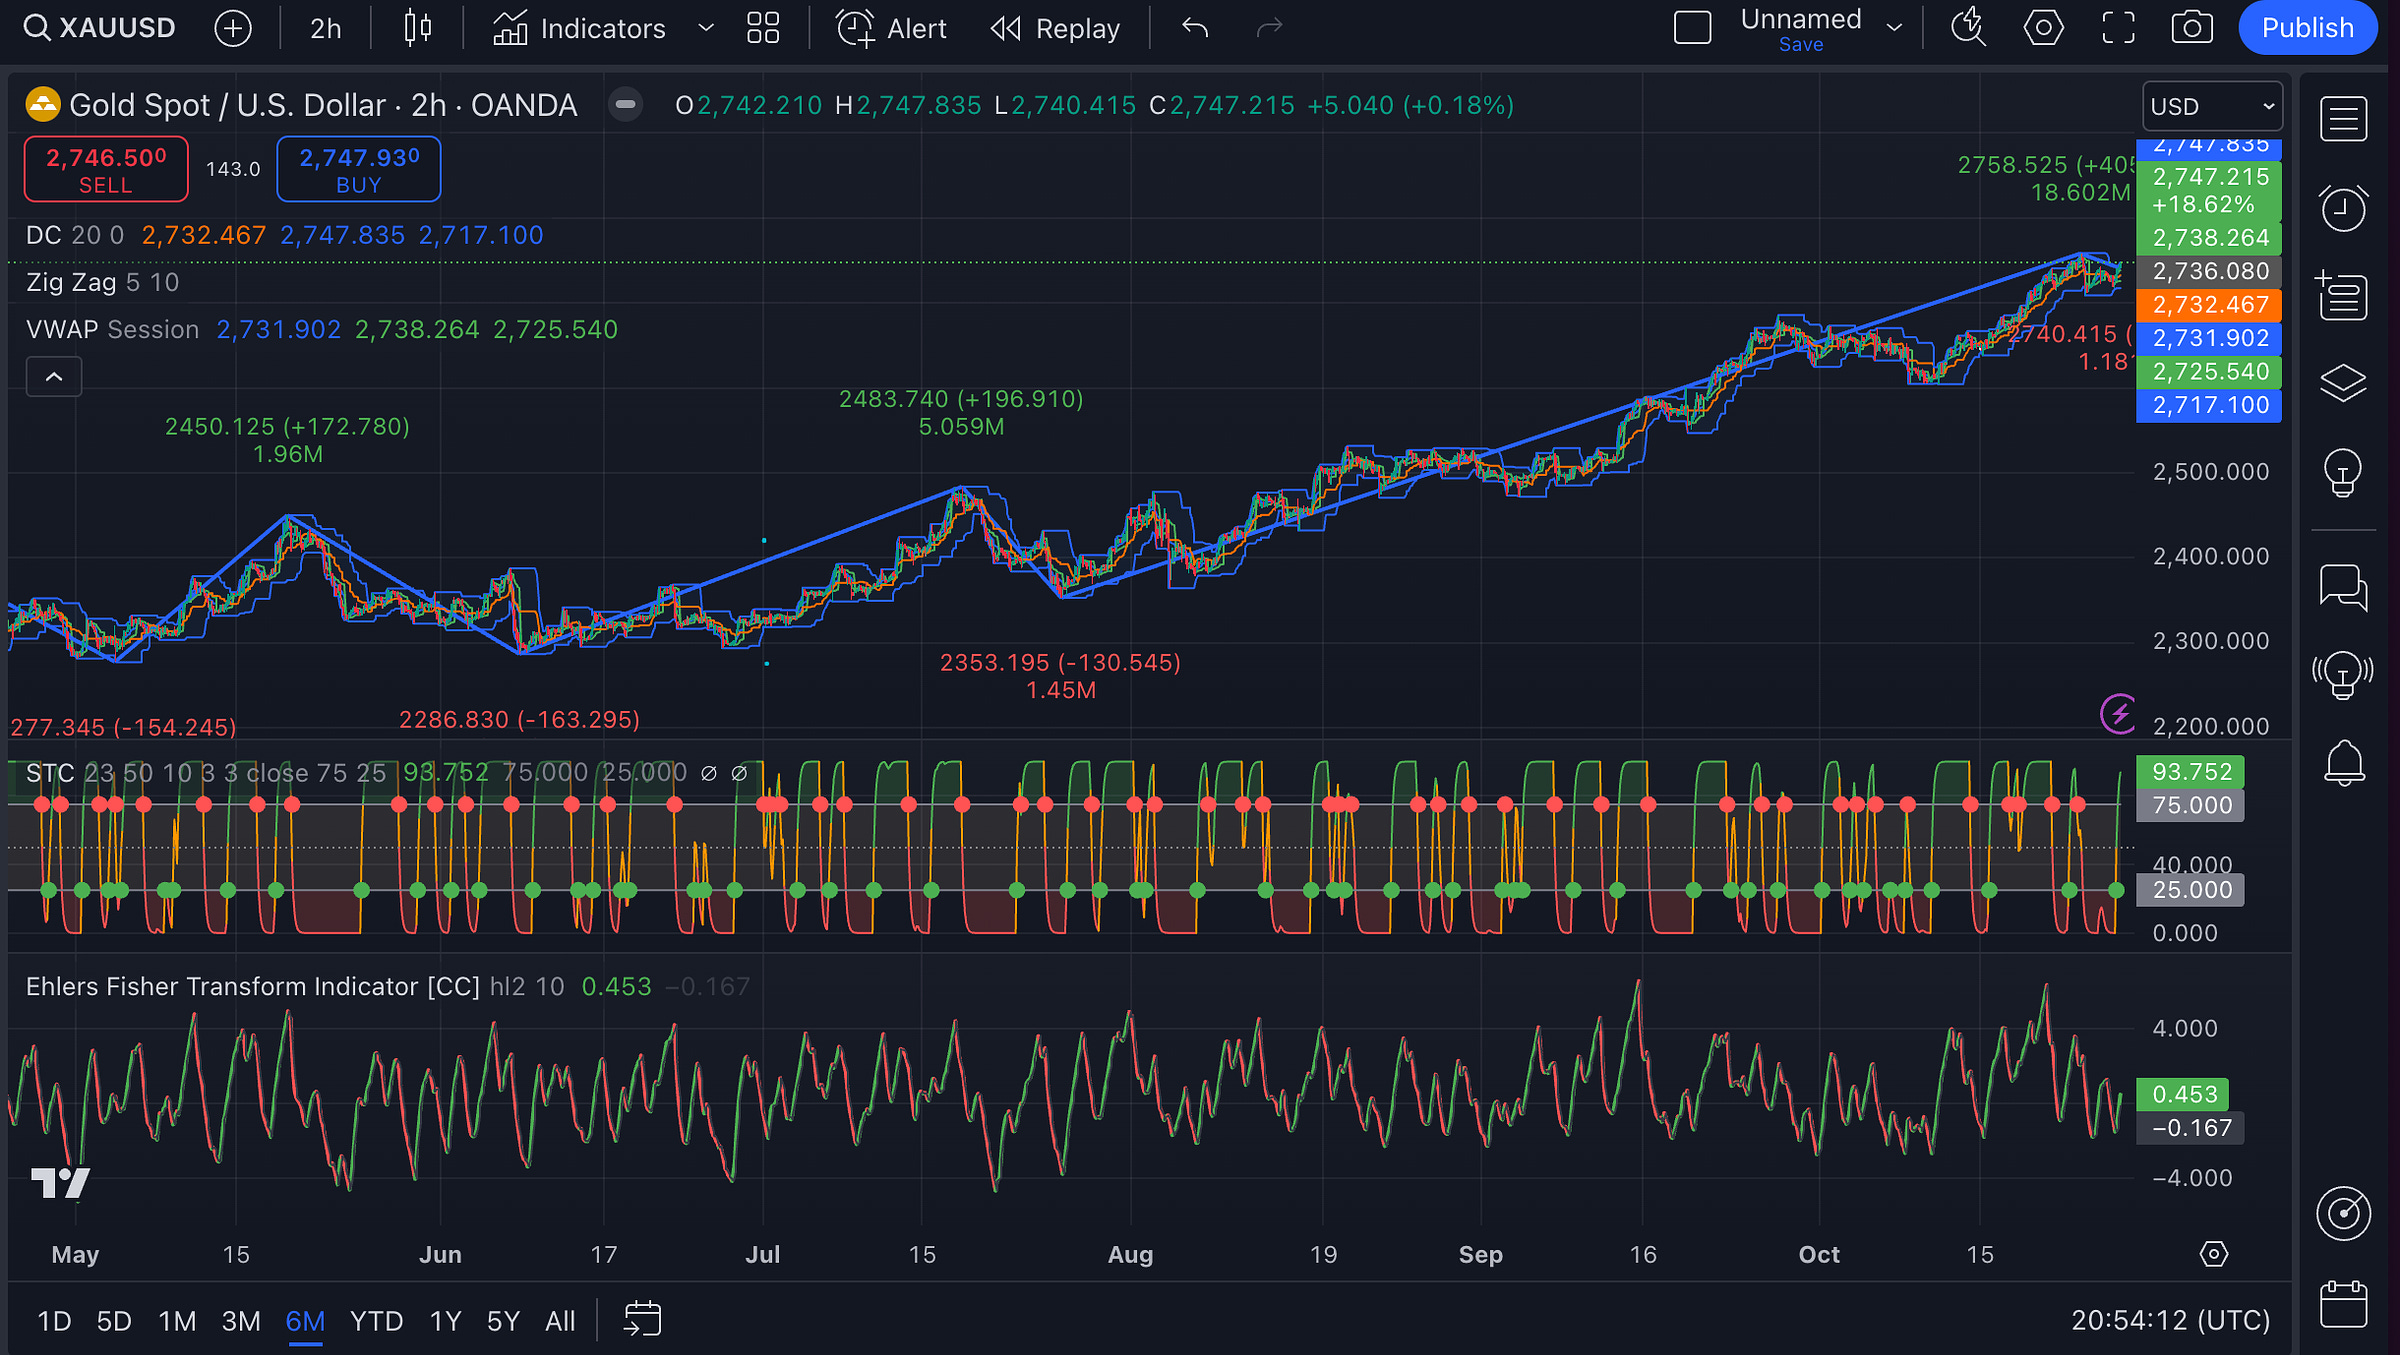
Last 6 months - 2h charts
Key takeaway:
The overall sentiment looks cautiously bullish but on the edge of turning bearish if key support levels break. Right now, the indicators are telling us that the uptrend has been strong, but momentum is fading. If Gold holds within the wedge and above its moving averages, we could see further upside. But if it breaks below, the market might correct lower.
Bearish pattern in play: The rising wedge points to a possible bearish reversal, with the narrowing price range signaling weaker buying strength. If Gold breaks below this wedge, we could see a significant correction, potentially down to the 2,500 level.
Weakening momentum: Both the MACD and RSI show a loss in momentum. The MACD lines are close to converging, and the RSI is near overbought levels, which could limit further upside.
Volume supports uptrend (for now): OBV remains strong, showing buyer activity is still present, but any decline in OBV would be a strong bearish sign.
Potential short-term pullback: The STC is in the overbought zone, indicating the uptrend may be nearing exhaustion and a pullback could be likely.
Key support levels: Key support lies around the 2,738 LSMA and the 2,731 VWAP. A dip below these levels could bring additional selling pressure.
Last 3 months - 1h charts
Key takeaway:
One-hour charts show clear signs of
Keep reading with a 7-day free trial
Subscribe to The Gold Trader to keep reading this post and get 7 days of free access to the full post archives.


