Gold’s technical setup: Where prices could be headed next [Weekly XAU/USD analysis + forecast]
Hello, fellow traders!
Gold took a hit this November, dropping about 9% in just a couple of weeks and sinking to a two-month low around $2,540. The selloff is mostly due to the U.S. dollar gaining strength after Trump’s re-election and talk of big policy shifts.
Ongoing conflicts in Ukraine and Gaza have kept some support under Gold since it’s still seen as a safe haven. But with rising inflation and the Fed’s next steps up in the air, things are looking pretty uncertain. For now, Gold seems to be stabilizing, but all eyes are on the key levels to see where it heads next.
In this week’s update, I’ll:
Look at the technical setup of XAU/USD and what it tells us about potential future price action.
Highlight the recent key support and resistance levels.
Break down this week’s key economic data from around the world (audio available!) and how it might affect XAU/USD in the mid term.
Explain the latest shift in the market sentiment as to the COT report and what it means for Gold's outlook.
Share my short-term and mid-term predictions on XAU/USD price action and trajectory.
📊 Let’s look at the technical data
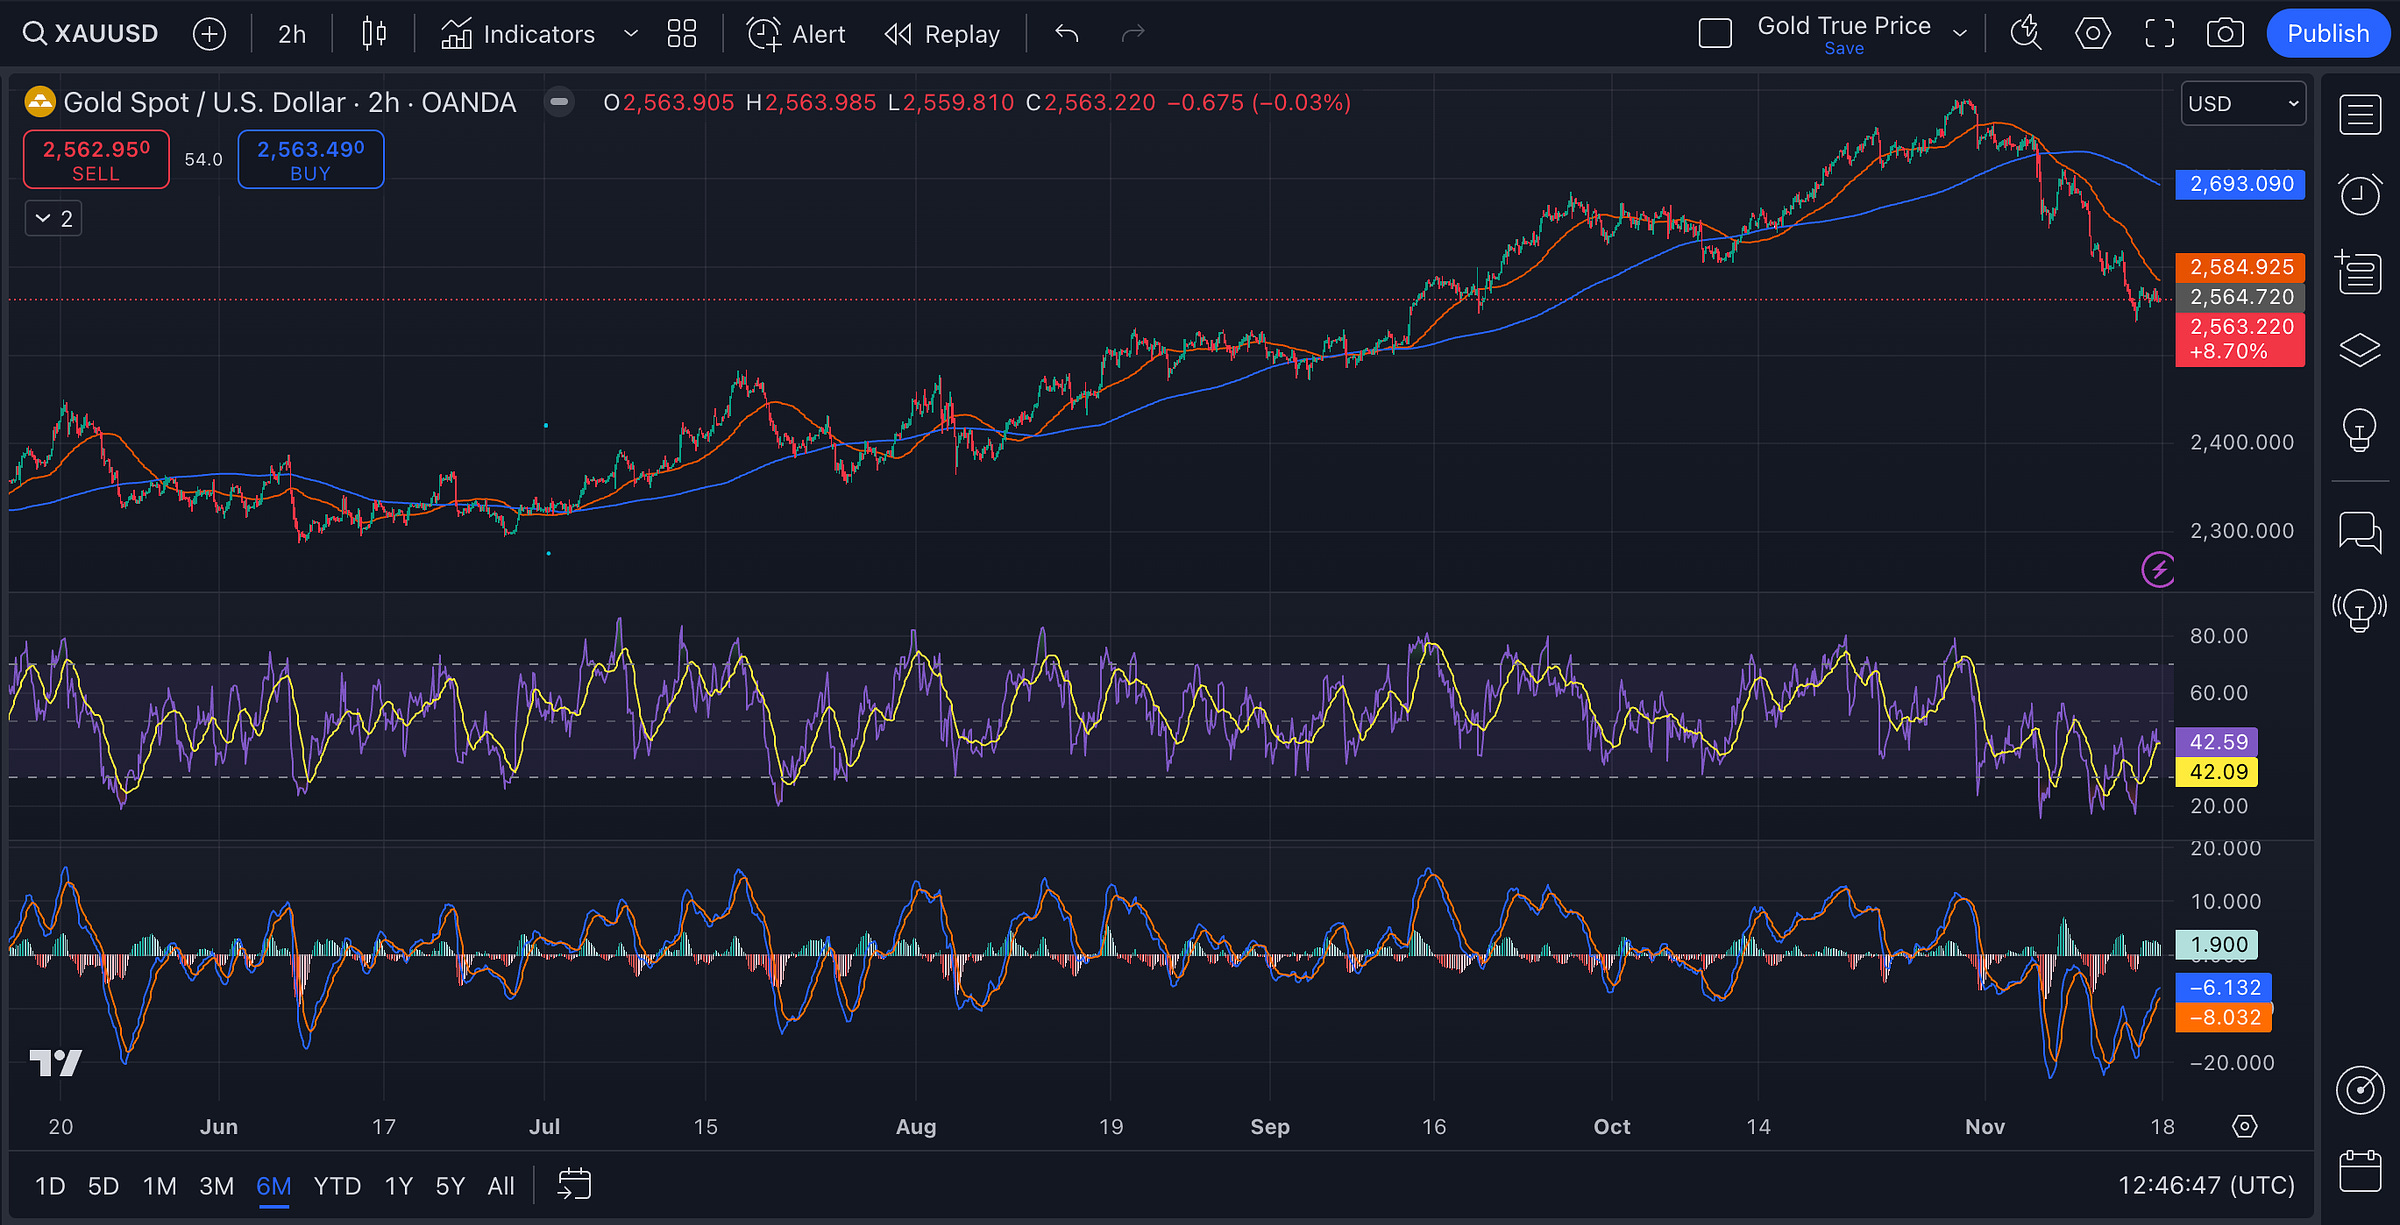
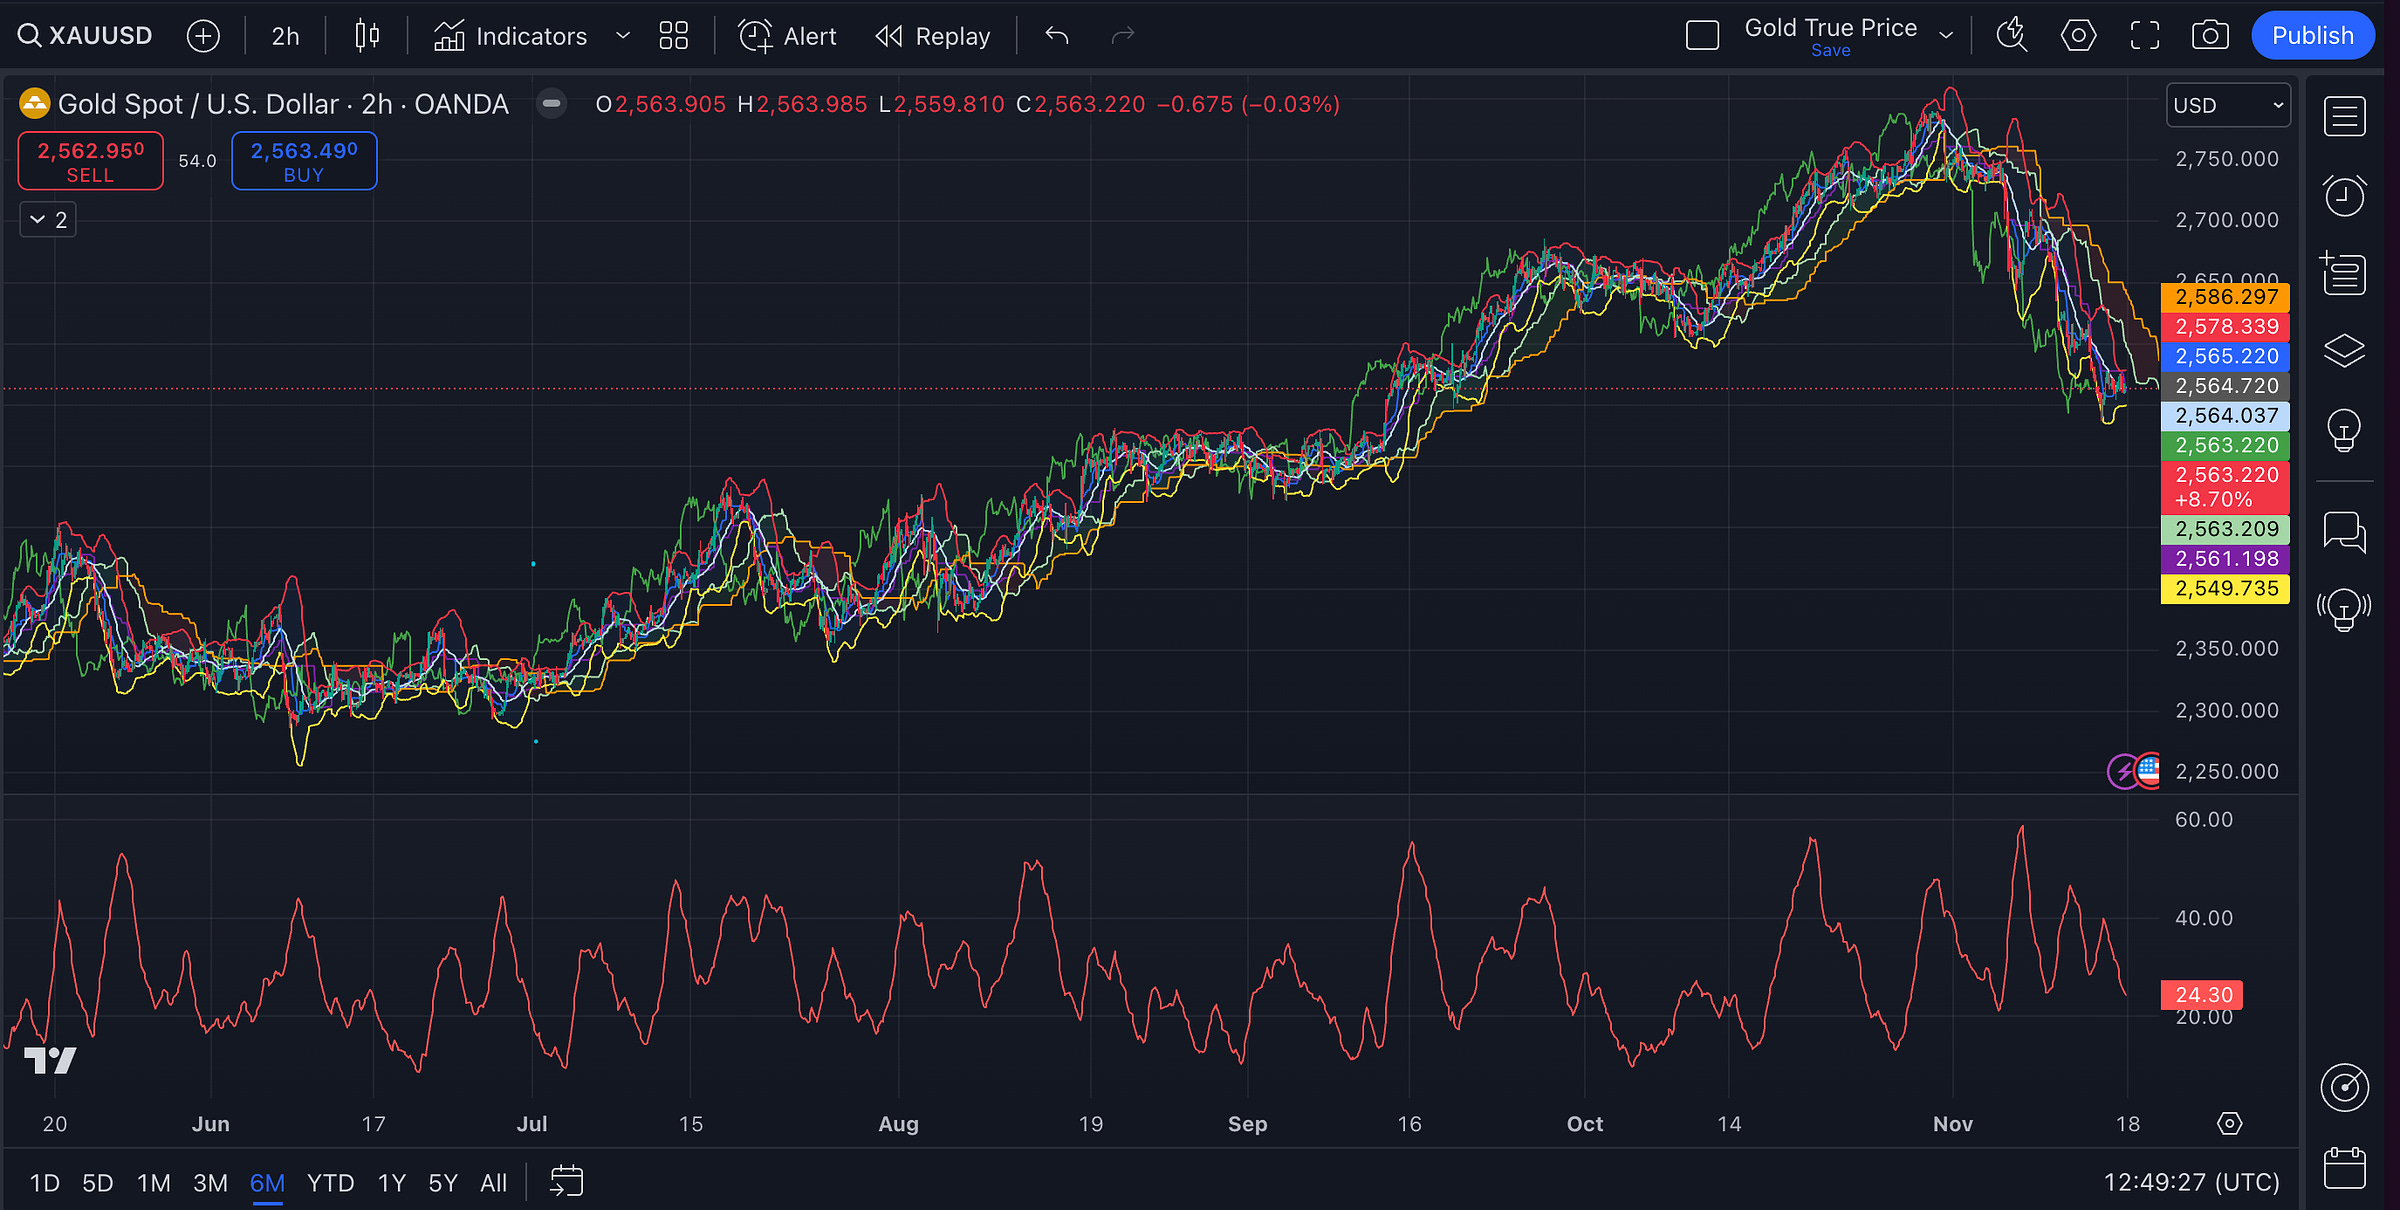
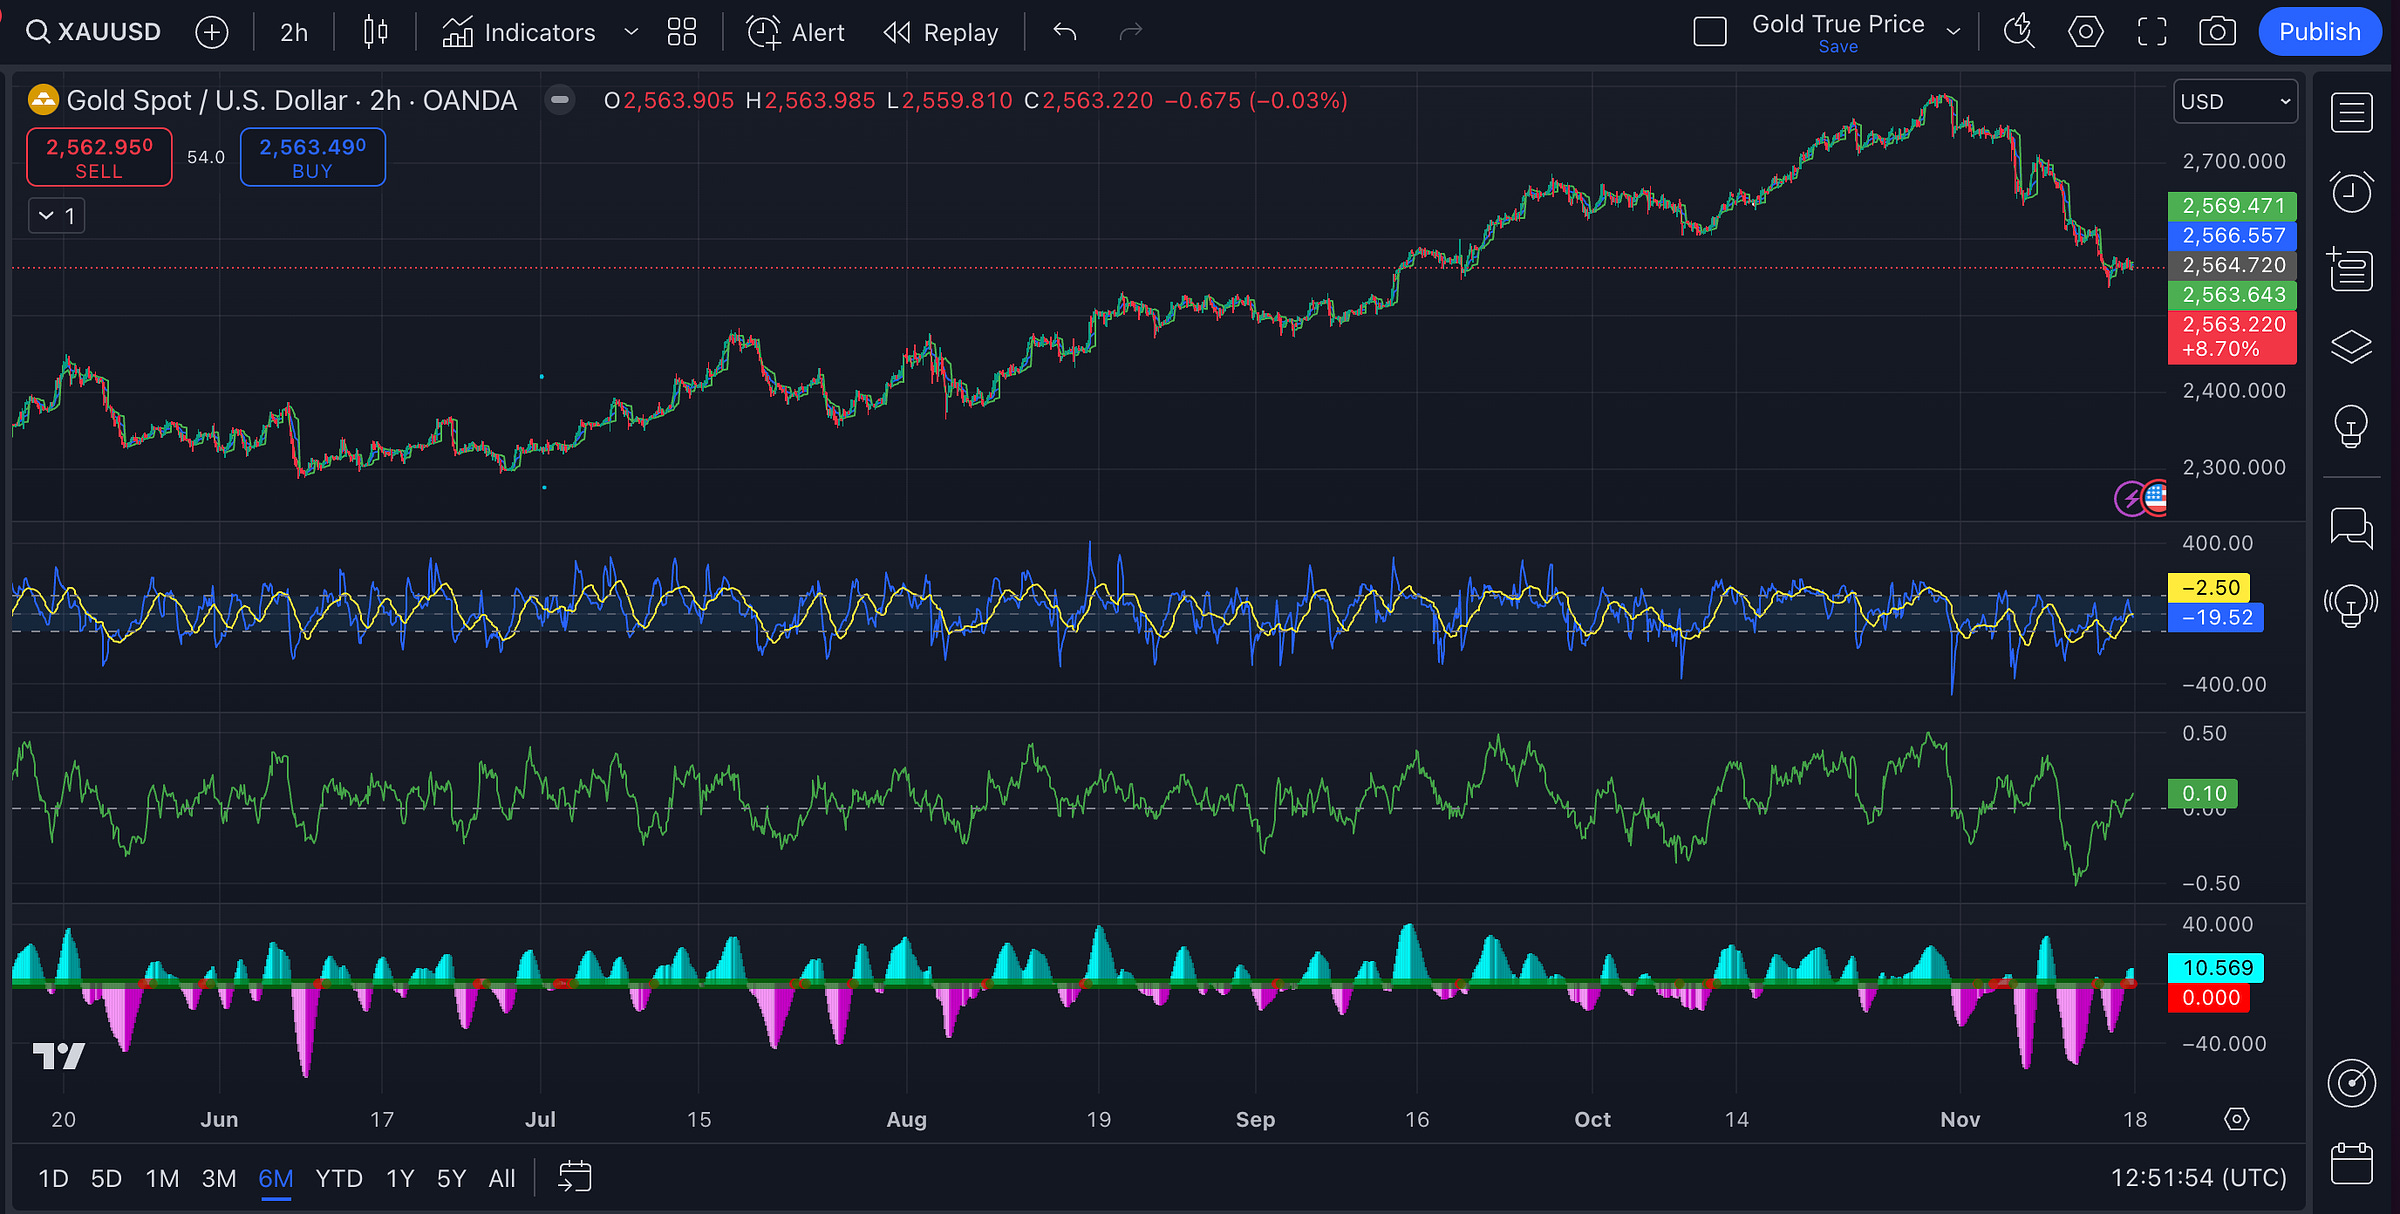
Last 6 months - 2h charts
Key takeaway:
Gold has been in a downtrend, but it’s starting to show some signs that it might be stabilizing. The current price action is a mix of consolidation and bearish pressure. Watch the 2,565–2,584 zone. If it breaks above, we might see a push higher, but if it struggles there, the downtrend could continue.
Sellers in control: Gold is trading below 200/50 averages and the Ichimoku cloud, meaning the short-term trend is weaker than the long-term trend. If Gold can reclaim the 50 SMA around 2,584 if might signal potential recovery. If not, expect more downside.
An upward bounce possible: The CMF and TTM Squeeze suggest some buyers are stepping in. The BB shows the price is oversold and while the MACD is bearish, the histogram’s shrinking red bars suggest momentum is waning. If this continues, we might see Gold stabilize or even attempt a bounce.
Last 3 months - 1h charts
Key takeaway:
Gold remains firmly in a downtrend across multiple timeframes. Yet, selling pressure might be slowing. Short-term bounce is likely, but the overall trend remains bearish unless key resistance levels such as
Keep reading with a 7-day free trial
Subscribe to The Gold Trader to keep reading this post and get 7 days of free access to the full post archives.


