

Gold's roller coaster ride: in-depth weekly analysis and my mid-term outlook for XAU/USD
Gold's roller coaster ride: in-depth weekly analysis and my mid-term outlook for XAU/USD


Hello, fellow traders!
This week has been eventful for XAU/USD, marked by significant price fluctuations and shifting market dynamics. Trump's assassination attempt, disappointing Chinese economic data, a stronger US dollar and a major global IT outage caused by CrowdStrike's update have all contributed to a highly volatile market and sharp price swings.
In this week’s update, I’ll:
Recap Gold’s weekly price action.
Look closely at Gold’s technical performance over the last 30 days, last week, and last trading day.
Highlight crucial support and resistance levels.
Update you on key economic events that influenced Gold prices this week.
Assess the current market sentiment by breaking down long/short positions of different trader categories
Share my mid-term predictions and speculations for XAU/USD movements next week and the coming month.
⚡ Gold reaches all-time high, faces resistance and settles at $2,400
Gold started the week at around $2,390 and quickly began an uptrend, breaking above the previous resistance of $2,410 and reaching an all-time high of $2,483.60 on Wednesday. After that, the price moved sideways between $2,420 and $2,450, with minor pullbacks and small percentage drops.
On Friday, XAU/USD started to decline sharply in Asian trade due to profit-taking and speculation over Trump's potential return to the presidency. The price continued its downward trend, breaking below $2,400 and reaching lows around $2,390. After an attempted rebound, Gold faced resistance around $2,410 and settled at the current level of $2,400.
Despite the volatility, there’s growing optimism that the Federal Reserve will cut rates as early as September. According to the CME FedWatch Tool, the probability of a Fed rate cut in September has surged to 95%, up from 69.7% the previous week.
📊 Let’s look at the technical data
Last 30 days
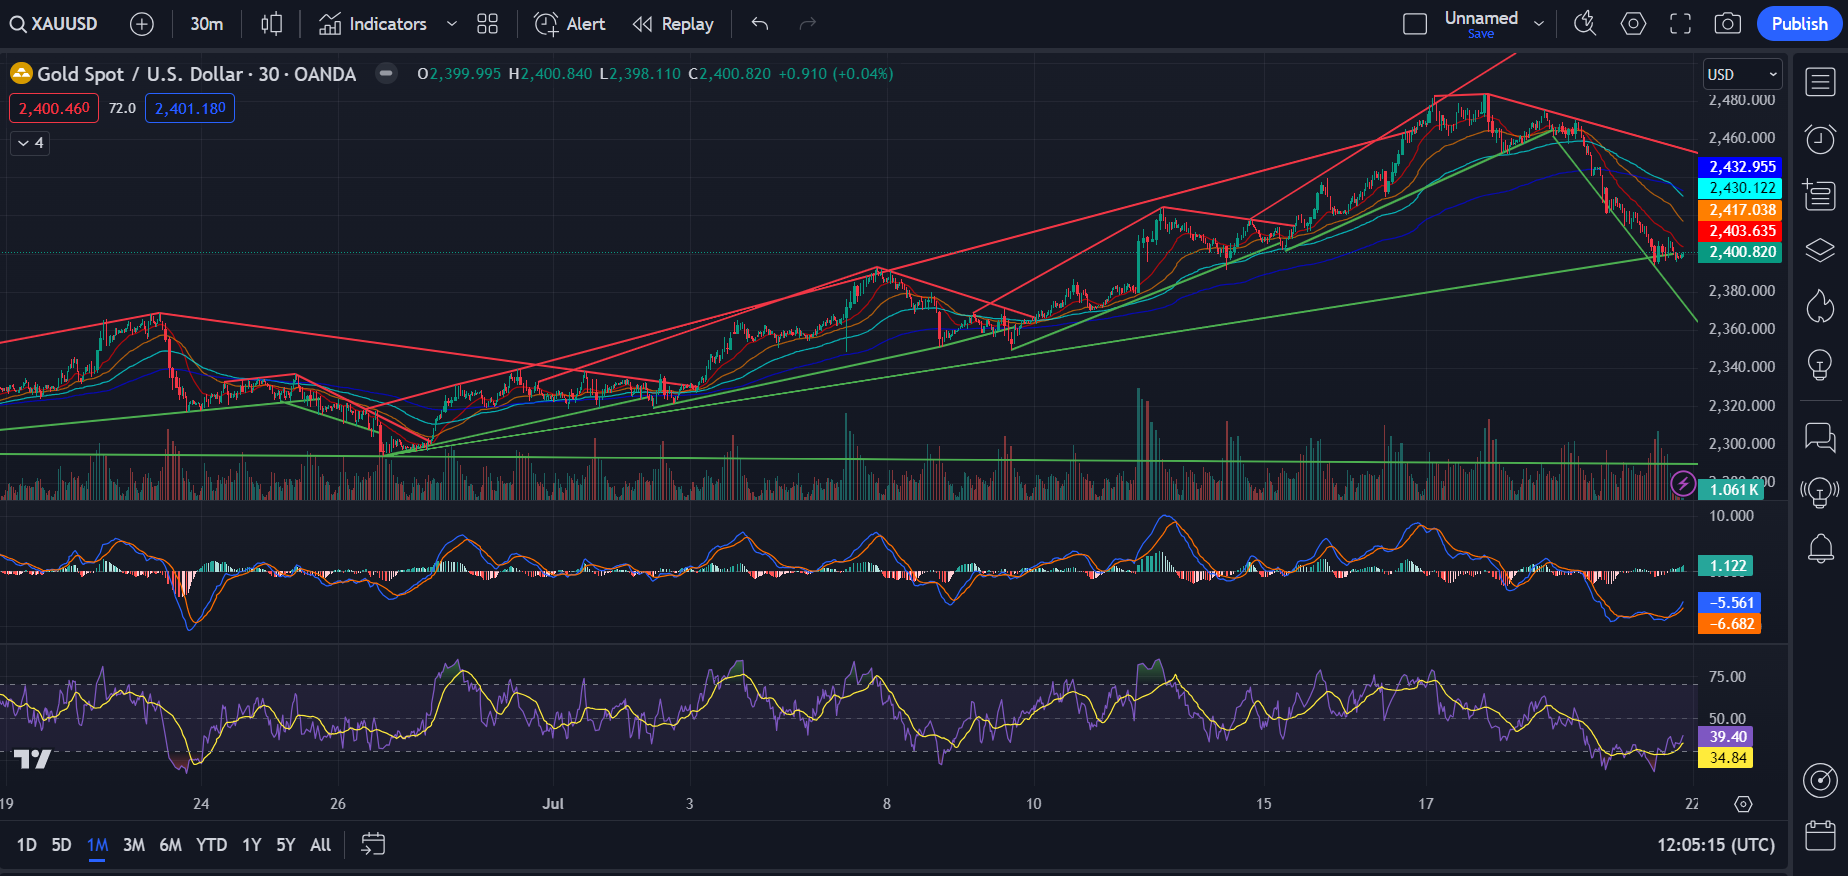
Over the last month, Gold has shown significant volatility. There was a strong upward trend that peaked on July 17, followed by a sharp decline. The price reached an all-time high of $2,483.60 before dropping to the current level of around $2,400.82.
Current technical indicators suggest that the bears are taking control:
EMAs: The price is below all the EMAs, and bearish crossovers have occurred, with the shorter-term EMA crossing below the longer-term EMAs.
MACD: The MACD is below the signal line, and the negative histogram indicates bearish momentum, although it may be weakening as the MACD line moves closer to the signal line.
RSI: The RSI is at 39.40, not yet in the oversold territory but getting close.

Last 5 days
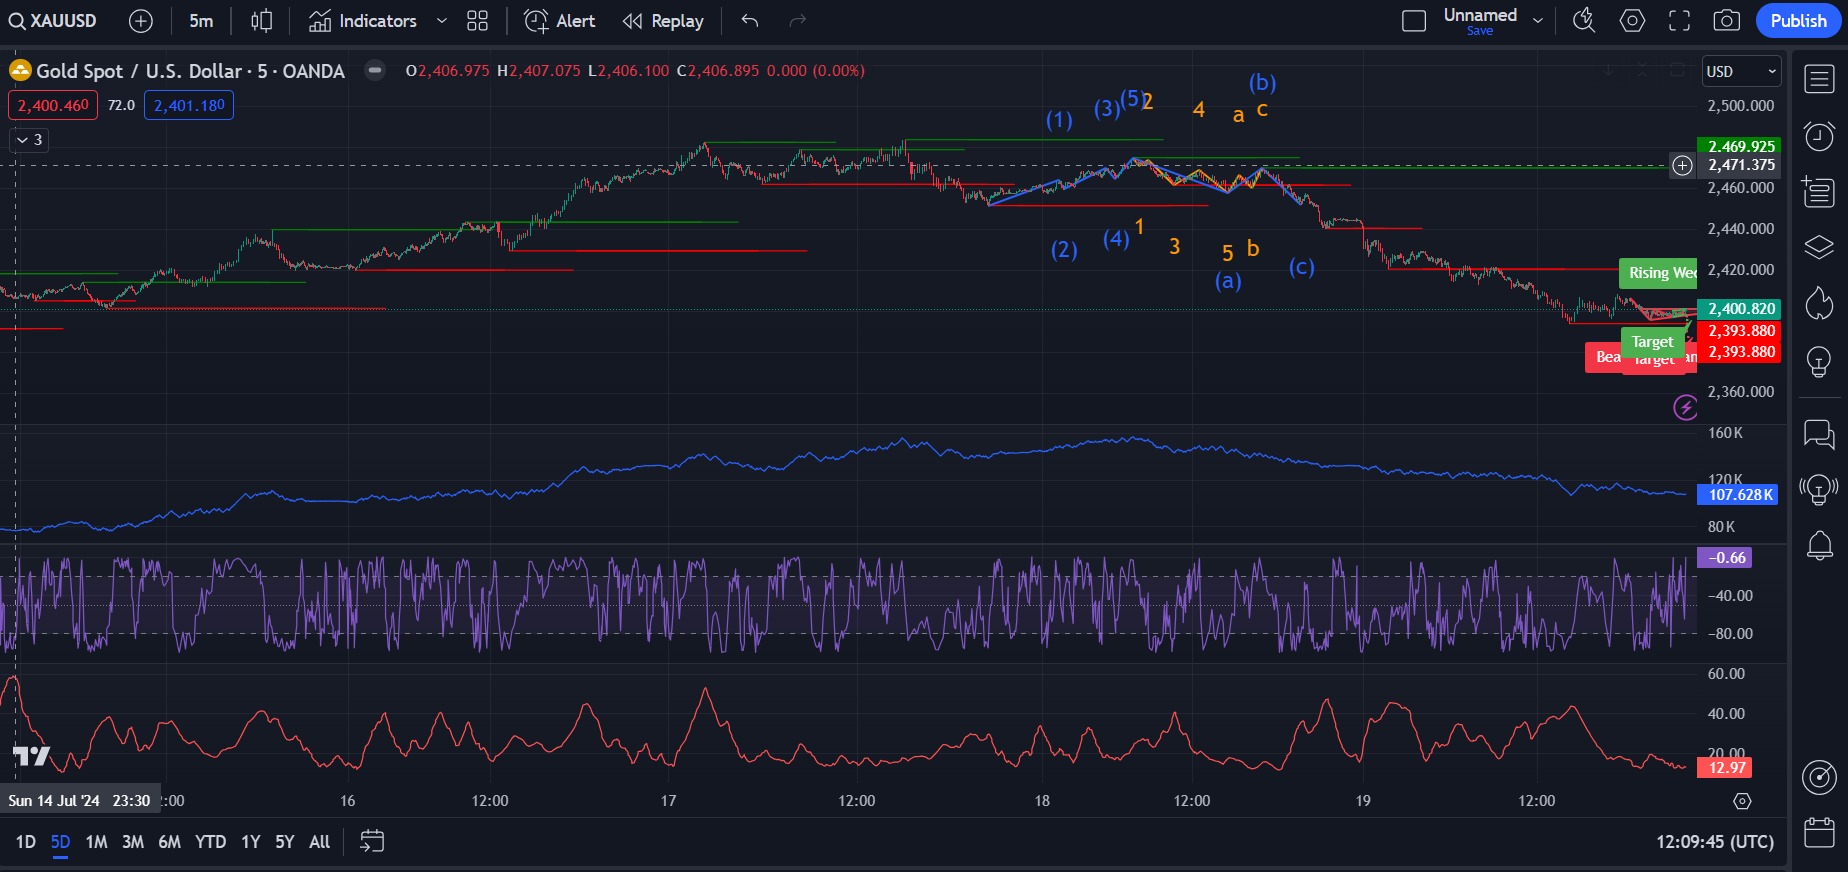
The 5-day technical setup for XAU/USD shows a market in a state of indecision. After a notable uptrend, the price has recently hovered around $2,400, with significant resistance at $2,420 and support near $2,390.
The On-Balance Volume (OBV) is stable around 107.628K, indicating a lack of strong buying or selling pressure at the moment.
Williams %R is in the neutral zone, suggesting Gold is neither overbought nor oversold in the very short term. It's hovering around the middle range, indicating no immediate extreme pressure on the price.
The low ADX reading suggests the current trend isn't strong, so we might see sideways movement or a lack of strong directional momentum in the next few days.
Overall sentiment appears bearish, but there's potential for a reversal.
Keep reading with a 7-day free trial
Subscribe to The Gold Trader to keep reading this post and get 7 days of free access to the full post archives.