


Gold’s Overbought and Stalling — Here’s the Exact Price Zone I’m Targeting for Reentry [Weekly XAU/USD Analysis + Forecast]

Hello, fellow traders!
Gold had a big week — it started off weak under $3,000 but then took off, hitting a new record high above $3,200 by Friday, up around 6%. Even with stocks bouncing back, there’s still a defensive tone in the market. Investors are loading up on Gold as a safe place to park money, with worries about currency drops, policy shifts, and overall financial stress in the background.
The surge also came as US-China trade tensions flared up again and soft US inflation data pressured the dollar. Heading into next week, all eyes are on China’s economic numbers and any fresh headlines from the ongoing trade drama.
In this week’s update, I’ll:
Decode the technicals: pinpoint the hidden technical clues that could signal a sudden breakout—or a ruthless selloff.
Offer trading setup ideas in the current market.
Unpack the global data: highlight the global economic numbers making waves and where they could push Gold’s price in the mid term.
Identify strategic “make-or-break” price zones.
Spot the sentiment shifts: what’s brewing beneath the surface and why this matters for Gold’s future direction.
⚡ NEW SECTION ⚡: Intermarket spotlight: Gold market performance against major assets.
Predict what’s next for Gold: give away my short-term and mid-term calls for where XAU/USD is headed next week and how to position yourself.


📊 Let’s look at the technical data
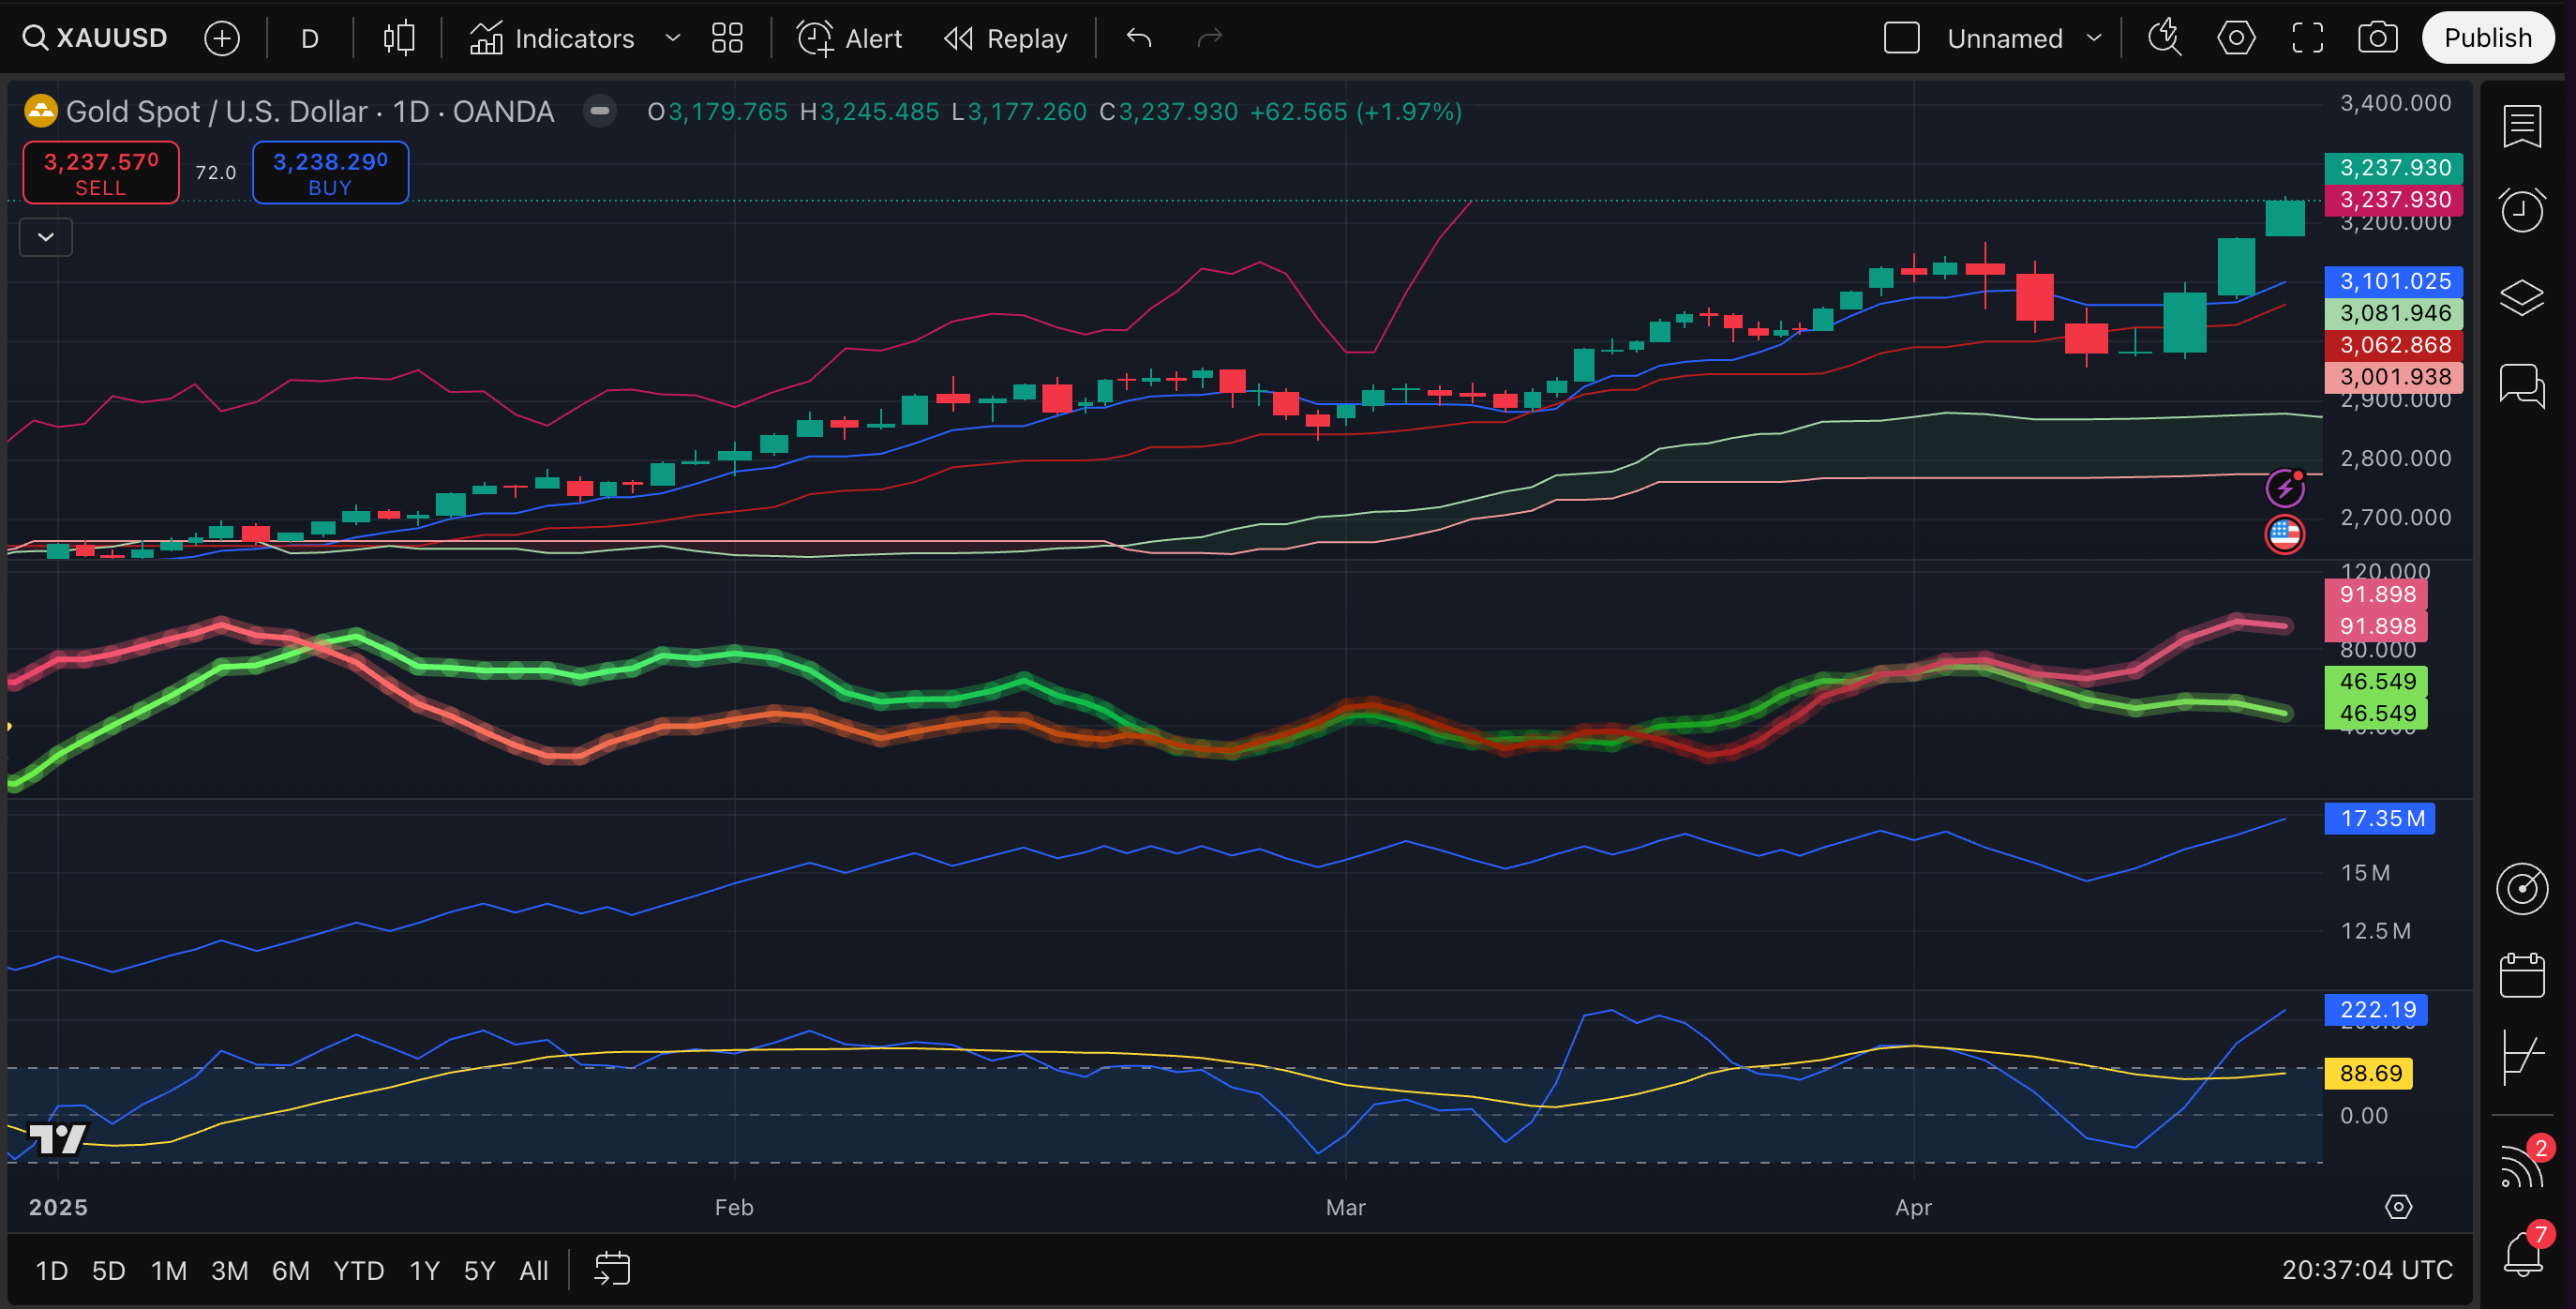


📅 Current Price: 3,237.93
Long-term: 🟡 bullish but overbought
Price is trading well above the Ichimoku Cloud & holding firm above Kijun (baseline) and Tenkan (conversion) lines.
Gold Spotter signals:
Exotics Index >91 → risk-off flows from EM currencies likely exhausted soon.
Pegged Index climbing (~46) → often leads to 3–5 more days of continuation.
Suggests macro drivers (e.g., USD weakness, risk aversion) are still in play, but near short-term limits.
OBV rising → confirms volume backing the breakout. Buying pressure remains institutional and strong.
CCI >200 → signals price is overextended. Historically implies either a pullback or sideways consolidation

Medium-term: 🟡 bullish but overextended
Elliott Wave count: Wave (5) likely completed at $3,245, setting the stage for an ABC corrective pattern.
0.382: $3,135.11
0.5: $3,101.02
0.618: $3,066.93
→ Most probable bounce zone:
$3,100–$3,135 → aligns with Ichimoku Conversion Line and EMA 50.
RSI & MFI: Both overbought.
Chaikin Oscillator: Flattening → signals momentum is peaking.
High probability of a short-term pullback or sideways consolidation.
Correction likely shallow if dip buyers step in near key support zones.
Short-term: 🟡 sideways, breakout pending
VWAP + Donchian Channels: Price coiling tightly between $3,230–$3,245.
Stoch RSI curling up from oversold → suggests relief bounce likely, but not confirmed.
A/D line flat-to-positive → no aggressive selling, steady accumulation.
Volatility compressing + historical volatility falling → breakout setup building, but direction unclear.
Wait for resolution — either breakout above 3,245 to resume trend or a breakdown below 3,218 to confirm correction.
Micro-term: 🔴 bearish
MA ribbon is flat and compressed → classic sign of market indecision / transition.
VWMACD & Fisher trying to turn bullish, but lack volume confirmation → momentum weak.
Clear chart patterns (rectangle, rising wedge, double top) all lean bearish — rising wedge breakdown and rectangle rejection are possible within hours.
Volume profile: Heavy node at $3,233 — failure to hold this level could send price down to $3,218 or lower.
🔮 What to expect
👉 Most likely scenario:
I’d expect choppy price action + downside break toward $3,218 if buyers fail to reclaim $3,245.
Bigger picture is still bullish, but there’s a risk of a larger correction after a strong rally + Gold is overbought territory on the daily and 4H.
❌ If 3,218 fails → 3,204 → 3,135 within 1–2 sessions.
✅ Bulls must break and hold 3,245 on volume → 3,260 → 3,280.
👁️ Key levels to watch
🔺 Resistance - where sellers might step in
3,245–3,250:
Previous swing high (Wave 5 peak) + double top (15M)
A breakout above could trigger momentum buying.
3,275–3,280:
Prior price rejections seen on intraday timeframes.
3,300 (psychological number)
Big round numbers often act like magnets or ceilings. Expect a battle around here if price surges past 3,280.

🔻 Support - where buyers may step in
3,218–3,220:
Rectangle base on 15M chart + volume shelf (point of control)
3,204:
VWAP lower band (1H) + rising wedge measured move target
3,135:
0.382 Fibonacci from 4H Elliott Wave structure (Wave A target)
Prior consolidation zone
3,100
Key psychological level + 0.5 Fib retracement + Ichimoku Kijun-sen on 1D + EMA 50 on 4H.
Could be a major pivot point if a deeper pullback happens.
3,066
0.618 Fib retracement level + near the base line (Kijun) on Ichimoku calculations.
A deeper correction could head here.
💰 Trading Ideas
Quick takeaways:
Midterm:
Hold longs → as long as price stays between 3,101 and 3,237.
Add to position or go long → if price dips to 3,100 - 3,080 + strong bounce off 3,100
Tighten stops → 3,245–3,250 - strong resistance here.
Take partial profits → 3,280–3,300
Watch for reversal → drop < 3,060; the trend might be breaking. Be ready to close longs or open a hedge.
Intraday:
Scalp long → break above 3,245.50 (Donchian upper bound) → TP 3,260/3,280.
Short-term long → if price dips to 3,216–3,218 (VWAP + mid Donchian support).
Quick short → if breaks < 3,204 → target 3,135 (Start of Elliott Wave retracement).
Scalp short → if price breaks below 3,233 (rising wedge breakdown, MACD rollover risk) → Target 3,218/3,204.
Trade setups
1/ 📉 Short trading idea (swing trading)
The daily and 4H charts show big-time overbought signals and a possible 5th Elliott wave completion near 3,245–3,250.
Entry: Gold fails to break above 3,245–3,250 (e.g., a double top or rising wedge break) + bearish reversal candle on the 4H or 1H chart.
SL: just above 3,255–3,260
🎯 Target: 1/ 3,218 (the local support zone) 2/ ~3,201 3/ ~3,135.
2/ 📉 Short trading idea (intraday)
Short the rising wedge breakdown. Bearish chart pattern confirmed across multiple timeframes; volume shelf at 3,233 adds confluence; MACD and Stoch RSI showing fatigue.
Entry: 3,232–3,233
SL: just above 3,247
🎯 Target: 1/ 3,218 (the local support zone) 2/ ~3,204
3/ 📈 Long trading idea (swing trading)
Elliott Wave correction likely ending around 3,101; confluence of support from Fib, Ichimoku, and 4H EMA; re-entry point for mid-term bulls.
Entry: 3,135 and 3,101
SL: below 3,066
🎯 Target: 1/ 3,245 2/ 3,280 3/ 3,300+
4/ 📈 Long trading idea (intraday)
A breakout above 3,245–3,250 could spark a wave of fresh buying.
Entry: Wait for a 15-min candle to close above 3,246/7 on solid volume. You’re looking for a decisive break, not just a quick spike.
SL: under the most recent swing low—somewhere around 3,230 (i.e., about 20 points below the breakout).
🎯 Target: 1/ 3,275 2/ 3,300
📰 Key economic updates
🇺🇸 The United States
🧩 FOMC Minutes
Fed policymakers nearly unanimous in flagging risks of:
Stubborn inflation, and
Slowing growth
Trump’s April tariff plans added uncertainty to the economic outlook
Fed maintained a cautious stance
Open to holding rates higher for longer, or
Cutting if economic weakness accelerates
📊 Forecast Adjustments (as of March):
Growth outlook cut
2025 inflation forecast revised upward
🔄 QT slowdown:
Fed slowed balance sheet runoff
Seen as insurance to avoid reserve shocks, especially amid debt ceiling uncertainty
Investors now expect more rate cuts
Combo of slower QT + rate cut bets = potential for renewed bond buying if economy deteriorates.
The Fed’s dovish tilt + tariff risks + weaker growth forecasts → bullish backdrop for Gold.
🧩 Core Inflation Rate MoM - ↓0.1% vs. expected 0.3%
🧩 Core Inflation Rate YoY - ↓2.8% vs. expected 3%
🧩 Inflation Rate MoM - ↓-0.1% vs. expected 0.1%
🧩 Inflation Rate YoY - ↓2.4% vs. expected 2.6%
What drove prices down:
Gasoline↓6.3%.
Used car ↓0.7%, expected to reverse soon due to vehicle tariffs.
Travel-related items also fell:
Airfare ↓5.3%
Hotel & motel rooms ↓3.5%
Price gains:
Food: +0.4%, groceries: +0.5%, eggs: +5.9%
Personal care: +1.0%
Rent: +0.4%
While the latest CPI print showed a surprise decline, the relief is misleading — driven mostly by temporary, volatile categories like gasoline and used cars.
Core inflation remains sticky, signaling no clear disinflation trend in underlying prices.
Tariffs & market impact:
Trump raised tariffs on Chinese goods to 125% (from 104%)
China retaliated with 84% tariffs on U.S. exports
Ongoing 10% blanket import tariff, 25% on vehicles, and looming pharma tariffs add more pressure
Traders now pricing in up to 100 bps of Fed rate cuts in 2025, expecting growth to weaken under the weight of inflationary tariffs and demand drag.
🧩 Initial Jobless Claims - ↑223,000
Layoffs remain historically low, but hiring is weakening
Continuing claims ↓43,000 to 1.85 million (week ending March 29)
→ Suggests some re-employment, but underlying job creation remains tepidLabor market dynamics shifting:
Those laid off are taking longer to find new jobs
Hiring softness is emerging and may become more visible in April–May
Tariffs are a growing drag:
Higher input costs (metals, imported goods)
Lower business confidence
Hiring freezes or budget cuts as uncertainty mounts
💥 Trump’s tariff policy impact:
10% universal import tariff + 125% duties on China
Sectors at risk: manufacturing, retail, import-heavy industries
Worsening labor market trends + tariff-induced economic uncertainty = a rising case for Fed policy easing & bullish setup for Gold.
🧩 Producer Price Inflation (PPI) MoM - ↓-0.4%
YoY PPI ↑2.7% vs 3.2% in February.
Biggest drop in goods prices since October
Gasoline: ↓11.1%
Food (wholesale): ↓2.1%
70% of decline driven by goods deflation
Steel mill products ↑7.1% → likely tariff-driven cost pressure
Core PCE ↑0.1% in March (vs 0.4% prior)
Annualized core inflation: now 2.6%, down from 2.8%
🧩 Michigan Consumer Sentiment Index - ↓50.8, below expectations
The decline was broad and unanimous across political affiliations, income levels, education, and regions.
Consumers are worried about:
Rising inflation
Economic slowdown
Job market stability
Inflation expectations spike:
1-year outlook: 6.7% → highest since 1981
5-year outlook: 4.4% → highest since 1991
Expectations rising 0.5%+ for four straight months
Signals a self-reinforcing inflation mindset – a major red flag for the Fed
Disinflationary headline PPI data might ease immediate Fed pressure, but soaring inflation expectations + tariff-related cost spikes point to long-term inflation risk
Rising fear + weakening consumer sentiment = bullish tailwind for Gold, especially if real yields soften.
🇩🇪 Germany
🧩 Balance of Trade - ↑17.7B, trade surplus
Exports ↑1.8% vs. 1.5% expected → driven by a temporary surge in U.S. demand before tariffs.
Exports to the U.S. ↑8.5%.
Exports to EU ↑ by 0.5%
Exports to non-EU ↑3.2%.
Imports ↑0.7%.
Trade surplus looks strong now, but it may be short-lived.
The U.S. is Germany’s top trading partner, and new tariffs threaten to raise costs and hurt competitiveness. With Germany’s export-heavy economy, this could weigh on growth in H2 2025.
🇨🇳 China
🧩 Inflation Rate YoY -0.1%, deflation persists
Second consecutive monthly decline, missing expectations for flat CPI
PPI fell 2.5% YoY – weakest since November, signaling deepening factory price pressure
Key drivers:
Falling global oil prices
Seasonal energy demand drop post-winter
Weak export demand tied to U.S. trade war tensions
⚠️ Why it matters:
Ongoing deflation hurts corporate profits and debt servicing
Risk of a deflationary spiral as unsold goods pile up
Slower Chinese exports could drag on global trade and commodity prices (oil, metals)
Core CPI rose 0.5% YoY → some stability in essentials, but consumer demand remains weak
Policy focus still on supply-side support (factories, infrastructure), not direct consumer stimulus — raising doubts about the strategy’s ability to counter export-driven slowdown
Persistent deflation in China could weigh on commodity demand, but also increase global economic uncertainty → stronger safe-haven flows into Gold.
🇯🇵 Japan
🧩 Consumer Confidence - ↓34.1, the lowest level in two years
Breakdown of sub-indices:
Overall livelihood: ↓ to 30.9 → growing concern over cost of living
Employment outlook: ↓ to 39.2 → rising job insecurity
Income growth expectations: ↓ to 38.8 → fears earnings won’t keep up with inflation
Willingness to buy durable goods: ↑ to 27.3, but still extremely low
Inflation outpacing wage growth → real wages falling. ~94% of households expect continued price increases
Cautious consumers are pulling back on big purchases → Weak consumer sentiment could drag on retail, autos, and travel sectors.
Bank of Japan projections:
GDP growth: 1.1%
CPI: 2.4%
For gold traders: a soft Japan outlook adds to global macro uncertainty, which may reinforce Gold's safe-haven appeal, especially if it feeds into broader recession concerns across Asia.
🇨🇦 Canada
🧩 Ivey PMI s.a. - ↓51.3
The economy is still growing, but slowing quickly
Employment index: ↓ from 53.7 to 48.2 → Signals job losses or weaker hiring, which may dampen consumer spending and broader demand
Price index: ↑ to 75.6 from 71.5 → Inflationary pressure remains high, despite slowing activity
Unadjusted PMI: ↑ to 55.6 from 53.6 → some regional or sectoral strength, but seasonal adjustment reveals a downtrend
Slowing employment + rising prices = stagflation risk.
🇦🇺 Australia
🧩 Westpac Consumer Confidence Change - ↓ -6.0% (vs +4% in March)
Index now at 90.1, still 9.3% higher YoY, but sentiment is clearly deteriorating
Rising cost of living and trade tensions are weighing heavily on households
🧩 NAB Business Confidence - ↓-3
A red flag — when businesses lose confidence, they cut hiring, delay investment, and reduce spending
Highlights growing concern over economic uncertainty and shrinking margins
Trump’s 10% tariff on Aussie exports isn’t just symbolic — it’s hitting sentiment, trade outlook, and bottom lines
Markets now pricing in a 0.25% cut in May, with some odds on a deeper 0.50% cut.
🇬🇧 The UK
🧩 GDP MoM - ↑0.5% vs. 0.1% expected
YoY growth: +1.4%
Driven by:
Manufacturing output: +2.2%
Services sector: +0.3%
Construction: also up
Retail sales and wages beat forecasts → signs of consumer recovery
UK exports to US↑£0.5B, highest since Nov 2022 → Likely driven by pre-tariff shipping surge as Trump’s 10% tariffs on UK goods loom
UK exports skew heavily toward services, which may cushion tariff impact somewhat
2025 GDP forecast cut from 2% to 1% due to 2024’s weak base and looming trade headwinds. 2026 growth forecast: more upbeat at 1.9%
Strong GDP print + rising exports + wage growth = less urgency for BoE to cut in 2025.
🎭 Market sentiment
🧩 Gold ETF market showing serious strength, driven by macro fears
ETF inflows confirm strong conviction behind Gold’s rally, especially above the $3,000 level. Inflows remain heavily skewed toward North America, but Europe and Asia are playing important supporting roles.
With macro risk high and speculative positioning still not overextended, Gold remains well-supported, and ETFs continue to reflect both fear and forward-looking positioning.
📊 Key highlights (March / Q1 2025):
Global ETF inflows: +$8.6B in March, +$21B (226 tonnes) in Q1 → 2nd-highest quarter ever
Total holdings: 3,445 tonnes ↑ 3% MoM
AUM: $345B → ↑ 13% in March, 28% in Q1
Gold trading volume: $266B/day (up from 2024 avg of $113B/day)
COMEX Futures:
Net longs down 3% to 804t
Fund manager positioning stable (~599t)
Late-March re-risking after Feb de-grossing as geopolitical tensions returned

🌎 Regional breakdown
🇺🇸 North America (76% of March flows):
+$6.5B in March, +$12.9B Q1
+67.4 tonnes in March
Driven by:
Breakout above $3,000/oz
Safe-haven demand amid tariffs, weak dollar
Stable yields
Options expiry boost (22t)
🇪🇺 Europe:
+$1B March, +$4.6B Q1
AUM: $134.4B
+13.7t demand, but sentiment mixed (rising yields, weak equities)
🇨🇳 Asia:
+$1B March, +$3.3B Q1
+9.5t in March
Strongest flows from China, Japan despite some Indian profit-taking
🌍 Other Regions:
+$98M inflows, +1.3t
Small, but steady interest

📊 Fund Flows – Top Performers
Top 3 by dollar inflow:
SPDR Gold Shares (US): $2.86B (+29t, +3.2%)
SPDR Gold MiniShares (US): $1.34B (+13.9t, +11.7%)
iShares Gold Trust (US): $1.29B (+13.6t, +3.3%)

Strongest % growth in holdings:
iShares Gold Trust Micro (US): +14.2%
SPDR Gold MiniShares: +11.7%
Huaan Yifu Gold ETF (China): +11.2%

📈 What this all means
✅ Momentum above $3,000/oz is attracting institutional and retail capital
✅ North American ETF demand is leading sentiment globally
✅ Macro fears (tariffs, inflation, policy uncertainty) are sustaining inflows
✅ If price holds above $3,000 and COMEX net longs rebuild, another leg higher is likely
⚠️ Caution:
COMEX net longs slipping → signs of speculative cooling
OTC volumes softening → some consolidation under the surface
Mixed European sentiment could temper broader global demand
🧩 The Commitments of Traders (COT) report
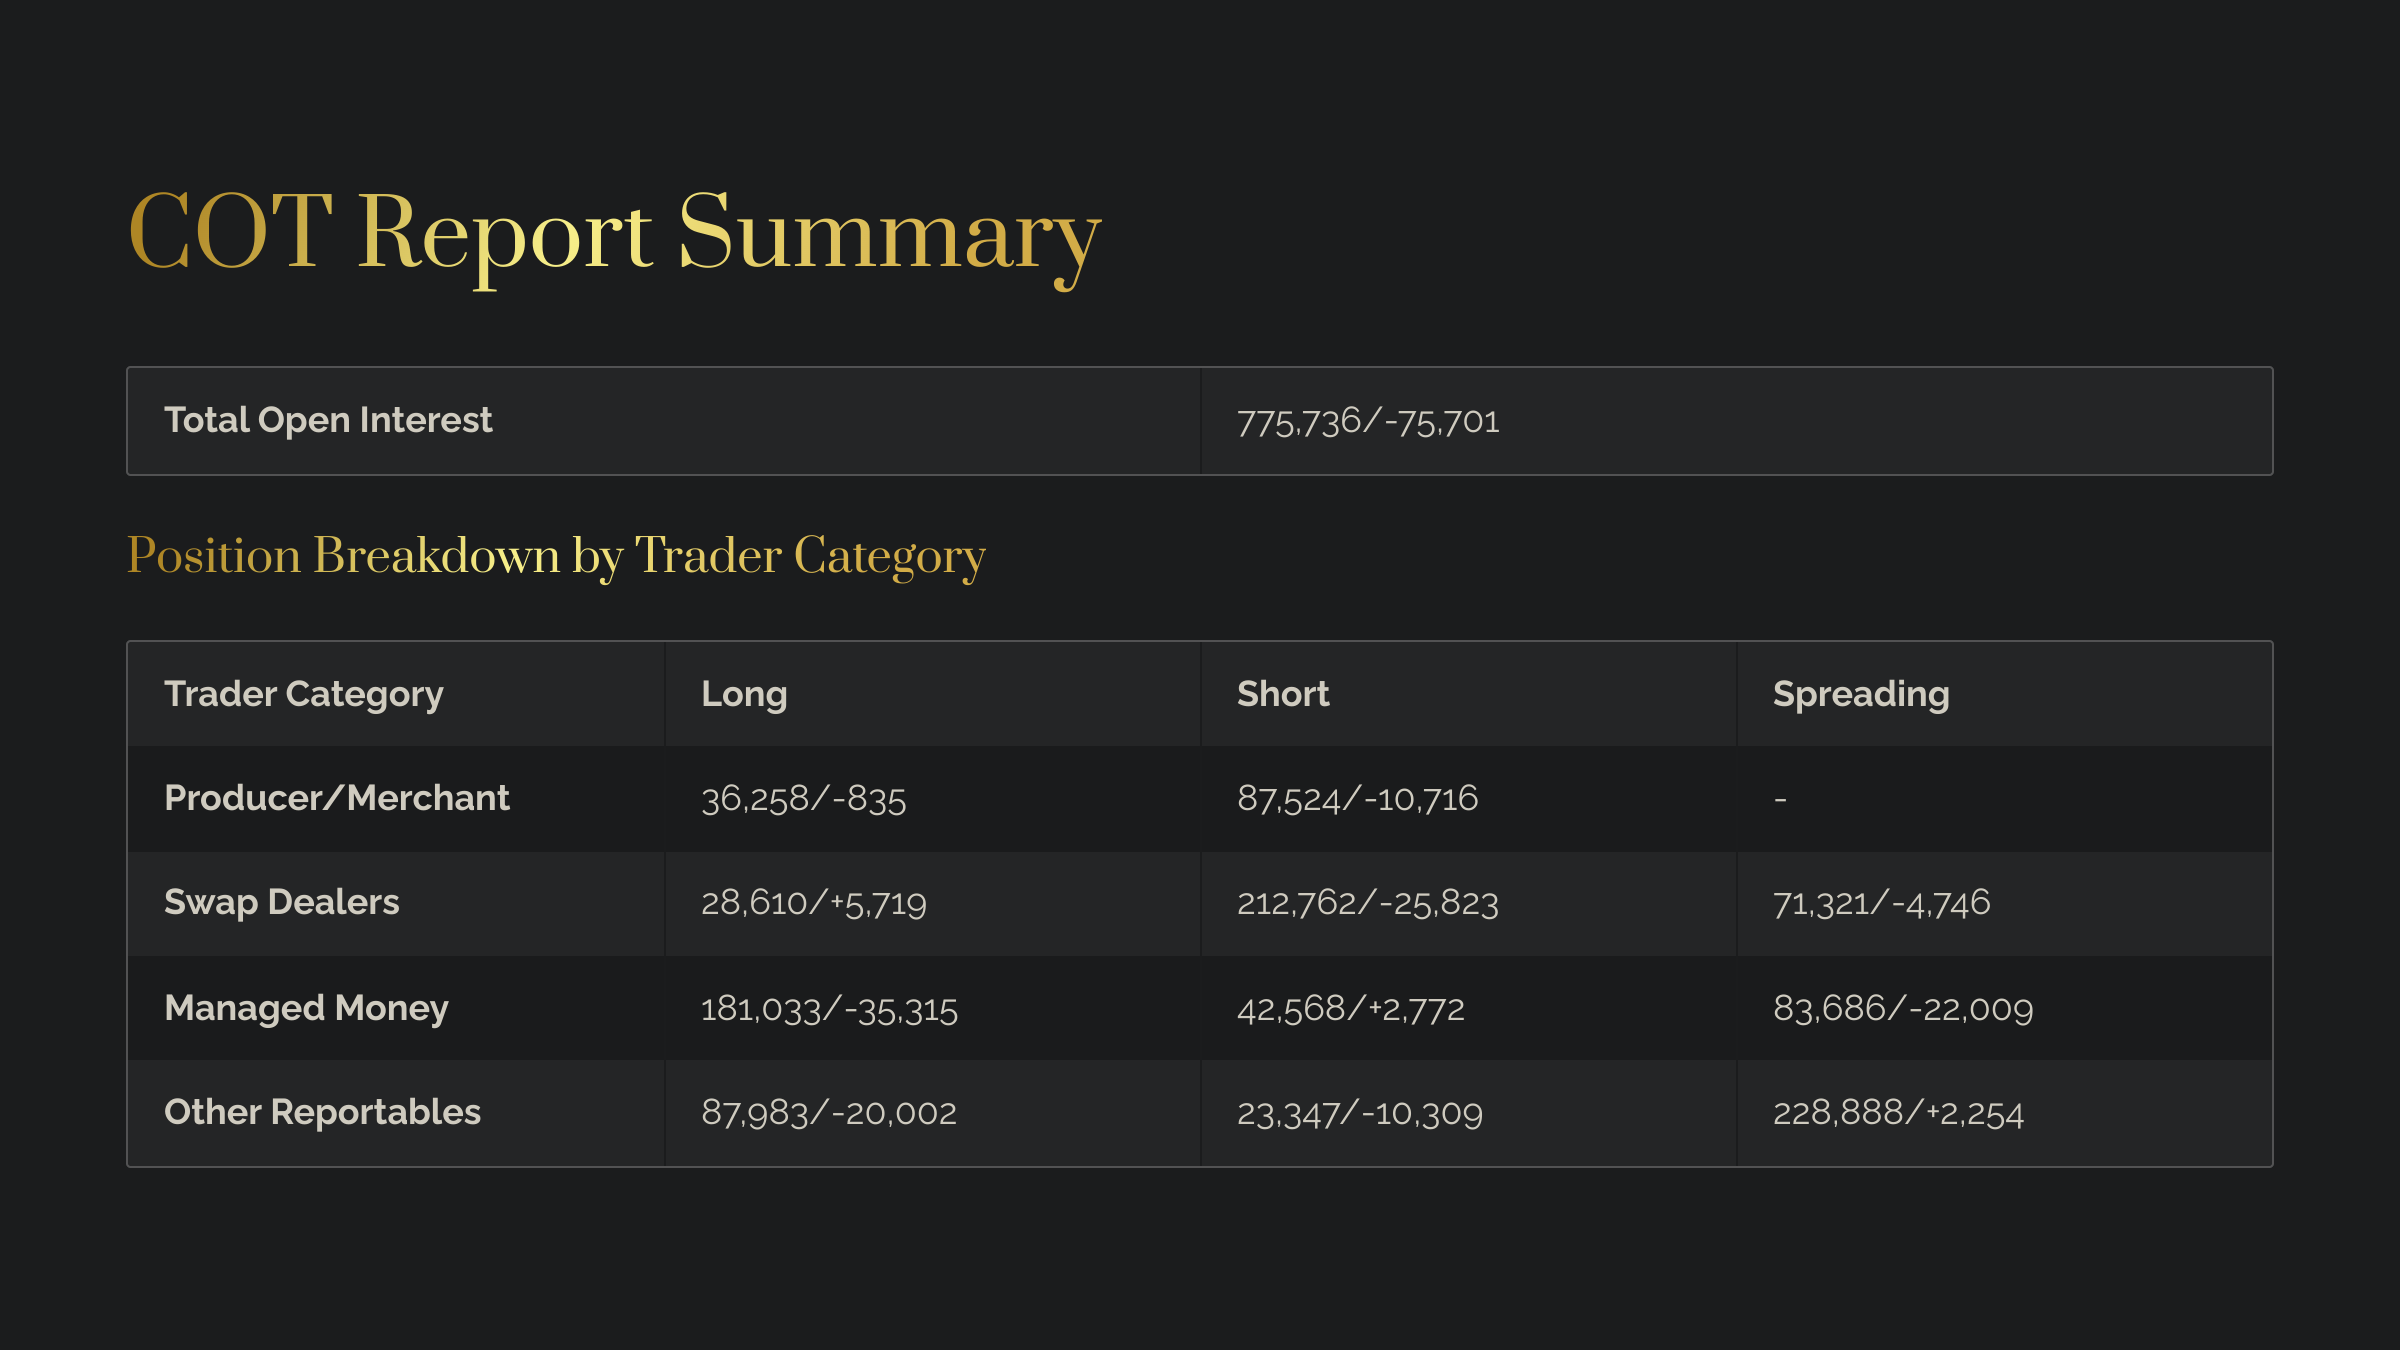
Key takeaways
Overall Open Interest drop:
Traders are exiting positions, signaling uncertainty or profit-taking
This often follows strong price moves and can lead to reduced volatility, unless a surprise catalyst reignites action.
Managed money bearish:
Big speculators are cutting long positions
This may cap short-term upside or lead to further selling if the unwind continues.
Producers & Swap Dealers less short:
Commercial hedgers are covering shorts → could help cushion downside
But without speculative inflows, a fresh rally is unlikely to sustain.
Watch for choppy action:
With fewer committed positions on both sides, Gold may range-trade while the market awaits a new directional catalyst.
💵 🔗 Intermarket spotlight: Gold market correlations
Gold surged this week, outperforming nearly every major asset class amid heightened volatility and macro uncertainty.
Despite a rebound in risk assets, investors continued rotating into Gold as a hedge — underscoring a deep bid for safety.
📊 Weekly asset performance overview:
Gold (XAU/USD): +6%
Hit record highs near $3,245/oz on strong safe-haven demandUS Dollar Index (DXY): –3%
Fell to a 3-year low, its worst week since 2022 — boosting GoldBitcoin (BTC): ~0%
Flat near $82,000, after midweek whiplash (crash then recovery)S&P 500: +5.8%
Snapped back hard despite ongoing trade tensions — sentiment still fragileCrude Oil (WTI): –1%
Ended near $61.5, at yearly lows — reflects growth fearsUS 10-Year Treasury Yield: ↑ ~50 bps
Spiked to ~4.50%, the largest weekly rise in decades — bond prices tanked.

🧩 Gold vs. U.S. dollar – inverse correlation intact
DXY fell 5 days straight, hitting a 6-month low below 100
Global investors are unloading U.S. assets — both Treasuries and dollars — in response to Trump’s policies
A weaker dollar mechanically lifts Gold prices. But more than that, the dollar decline is a sentiment shift — investors are increasingly seeking non-dollar stores of value like Gold and other currencies.
📌 Takeaway:
Until trust in U.S. policy stabilizes, this inverse correlation is likely to persist — supporting Gold as a preferred hedge in a dollar-unfriendly environment.

🧩 Gold vs. bond yields – divergence from the norm
In a classic risk-off environment, investors typically flee to both Gold and Treasuries, causing bond yields to fall.
But this week, the opposite happened:
Treasuries were aggressively sold off, pushing yields to multi-month highs
Analysts called it a "bond market liquidation" — triggered by Trump’s unpredictable tariff policies.

What’s driving the yield spike:
Foreign holders dumping U.S. debt
Concerns about heavy government borrowing
Rising fears of tariff-driven inflation damaging bond returns
Potential loss of faith in U.S. fiscal credibility.
Normally, higher yields hurt Gold by raising the opportunity cost of holding a non-yielding asset. But in this case, the context of the yield spike actually reinforced Gold demand:
Yields surged for the wrong reasons — signaling systemic stress, not growth
This “bad yield rise” was seen as a confidence crisis, not an economic boom
As a result, Gold and yields rose together — an atypical but telling correlation breakdown.
📌 Takeaway:
When yields rise because of growth, Gold suffers.
But when yields spike from panic selling and policy distrust, Gold thrives as the safety valve.
If bond-market volatility persists, expect Gold to stay well supported. A stabilization in yields, however, could cool Gold’s momentum in the short term.
🧩 Gold vs. equities – correlation shift
The S&P 500 surged +5.8% this week — a sharp rebound from bear-market lows.
Early week: Extreme volatility (Dow swung 2,500+ pts intraday) on tariff rumors
Late week: Sentiment improved on hopes of trade negotiations and strong bank earnings
But Gold also hit record highs, even as equities surged — a rare but telling signal.
Normally, stock rallies = Gold pullback. But this time, both rose together:
Stocks rallied on Fed backstop hopes & trade deal talk
Gold rallied on rate cut expectations, weaker dollar, and underlying systemic risks.
🔁 This marked a shift in correlation → from negative (fear-driven selloff) to mildly positive (policy-driven relief).
Investors allocated to both:
Risk assets (to play short-term bounce)
Safe havens (to hedge unresolved macro risks)
⚠️ This equity rebound may be a bear-market rally, not a full risk-on shift. Equity risk premium hasn’t improved → valuations remain unattractive with rising yields. That could limit equity upside and keep Gold well supported.
📌 Takeaway:
This week highlighted a rare market moment where Gold and equities both rallied, not in contradiction, but in response to shared expectations of monetary easing.
It’s a reminder: Gold can thrive even in rising markets, as long as uncertainty and policy risk remain elevated.
🧩 Gold vs crude oil
Oil weakness reflects growth fears → WTI flirted with $60, Brent dipped to mid-$60s.
Selling was driven by fears of tariff-driven global slowdown → weaker energy demand.
Friday bounce was brief — fueled by a weaker dollar and short-covering. Overall, oil ended flat on the week and remains well below Q1 levels.
Soft oil prices tend to dampen inflation expectations, which might normally be a negative for Gold’s inflation-hedge appeal. ECB explicitly cited falling energy prices as a factor slowing inflation
Gold still rallied – why?
Monetary policy expectations (rate cuts, stimulus) and
Geopolitical/fiscal risk were stronger forces
Had oil spiked, Gold’s rally may have been even sharper due to inflation fears. Instead, low oil:
Tempered short-term inflation concern
Gave central banks room to ease, which is indirectly bullish for Gold.
📌 Takeaway:
Gold’s strength during oil weakness shows it’s less about near-term inflation and more about systemic fears and policy responses.
For now, both markets are reflecting a fragile macro outlook — oil through growth pessimism, Gold through the flight to safety.
🧩 Gold vs Bitcoin
Early week: BTC held above $82K, showing resilience amid equity carnage. But during peak tariff panic, BTC plunged 10%+ to ~$74.4K, behaving like a risk asset, not a safe haven.
Altcoins fared worse, and crypto funds saw heavy outflows.
As the U.S. dollar tanked, Bitcoin rebounded → By Friday, BTC had recovered to ~$82K, tracking Gold’s rally.
Bitcoin’s late-week recovery, despite volatility, suggests it’s increasingly seen as a complementary inflation hedge — but not a replacement.
In the short run, Gold clearly outperformed Bitcoin as the more reliable safe asset. Central bank buying and record ETF inflows underlined institutional conviction.
In contrast, Bitcoin saw $250M+ in realized losses in one 6-hour stretch before stabilizing — indicating capitulation by weaker hands.
📌 Takeaway:
Gold remains the primary safe-haven asset, especially in times of acute market stress. But as systemic trust erodes and the dollar weakens, Bitcoin is emerging as a parallel store-of-value trade.
Both may benefit from the same macro drivers, though Gold continues to lead in institutional trust and defensive positioning.
🧩 Implications for Gold
This week’s intermarket trends show a Gold-positive picture.
Gold outperformed equities, crypto, and commodities, and even held firm amid rising yields — a sign of robust safe-haven demand:
Systemic risk is rising, and markets are pricing in policy easing
Dollar weakness further amplifies Gold’s upside
Gold’s relative strength vs. risk assets signals a defensive rotation — capital is hedging uncertainty, not chasing risk.
The fact that Gold and the S&P 500 rose together reflects a hedged risk-on environment — investors are balancing optimism with protection.
Capital inflows into Gold, even as stocks rebound, suggest deep-seated macro anxiety beneath surface rallies.
So macro tilt still bullish, but... Gold is priced for a lot of risk.
Any positive surprises — a U.S.-China compromise, a confidence boost in U.S. debt management, or even surprisingly strong growth data — could trigger profit-taking.
Watch for correlations normalizing if volatility fades.
If bond yields decline (due to safe-haven flows or Fed intervention), Gold could see a second wind as its usual inverse correlation with yields kicks back in.
However, if bond and stock markets stabilize, Gold’s role may shift from a crisis hedge to an inflation hedge. In that case, its performance would depend more on how inflation expectations evolve — particularly in response to tariffs and oil prices.
Safe trading,
and remember: All that glitters is not Gold,
Joe
Disclaimer:
The information provided here is for educational and informational purposes only. It does not constitute financial or trading advice, and it should not be taken as such. You should conduct your own independent research and consult with a qualified financial professional before making any trading or investment decisions. All forms of trading and investing involve risks, and past performance is not indicative of future results.