Gold’s next move could be big: rate cuts, bearish signals & critical levels -> Weekly XAU/USD analysis + forecast
Another week, another record for Gold.
Hello, fellow traders!
Another week, another record for Gold.
XAU/USD has now risen for the third consecutive week, reaching a new all-time high of $2,685 per ounce on Thursday. This rally is primarily fueled by expectations of further interest rate cuts from the Federal Reserve, a weakening U.S. dollar, and persistent geopolitical tensions in the Middle East and Ukraine.
Let’s break down the technical analysis and key macro events to assess whether Gold can sustain its momentum and potentially reach the much-anticipated $3,000 level.
In this week’s update, I’ll:
Look at the technical setup of XAU/USD and what it tells us about potential future price action.
Highlight the recent key support and resistance levels.
Break down this week’s key economic data from around the world and how it might affect XAU/USD in the mid term.
Explain the latest shift in the market sentiment as to the COT report and what it means for Gold's outlook.
Share my short-term and mid-term predictions on XAU/USD price action and trajectory.
📊 Let’s look at the technical data
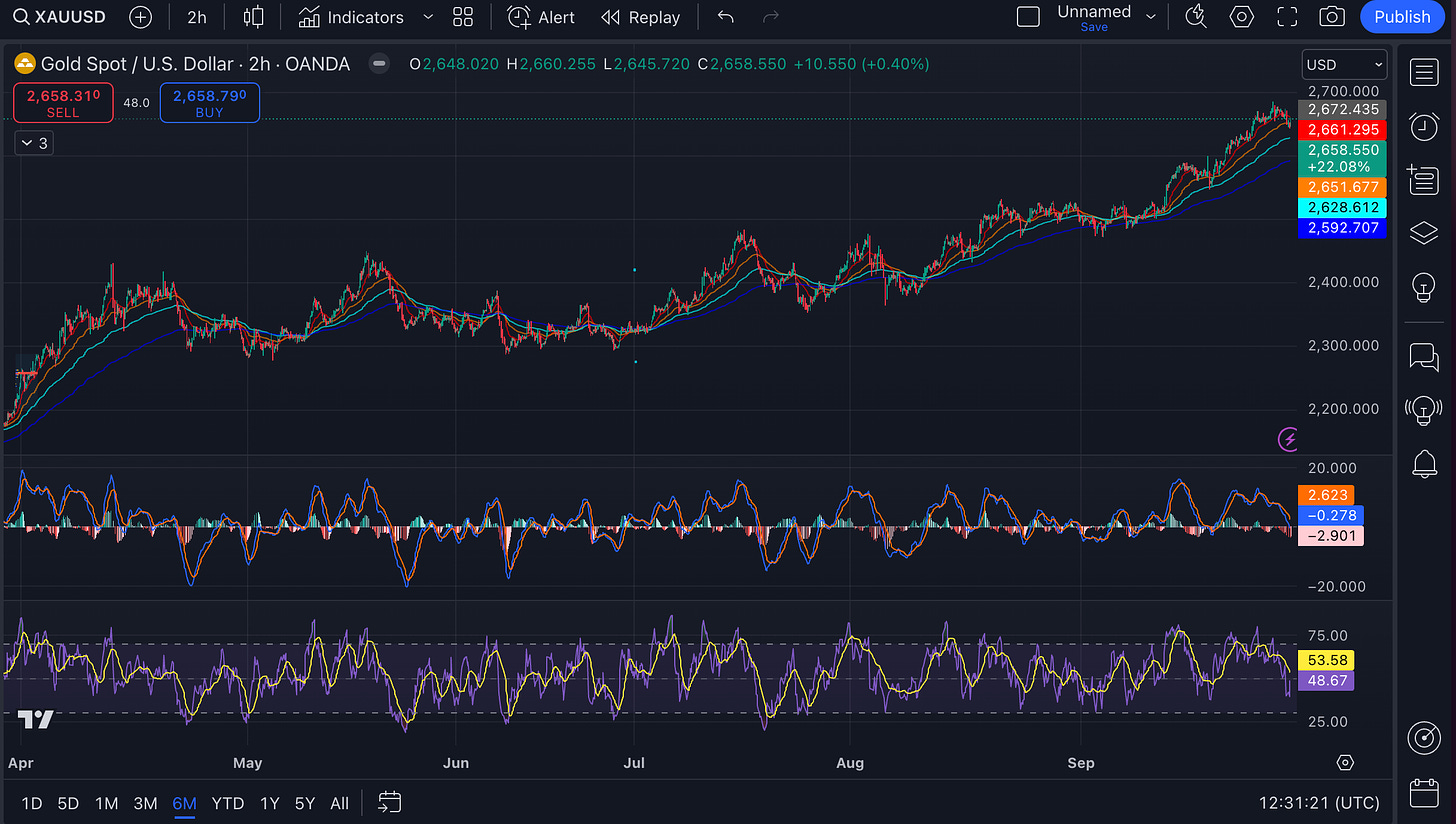
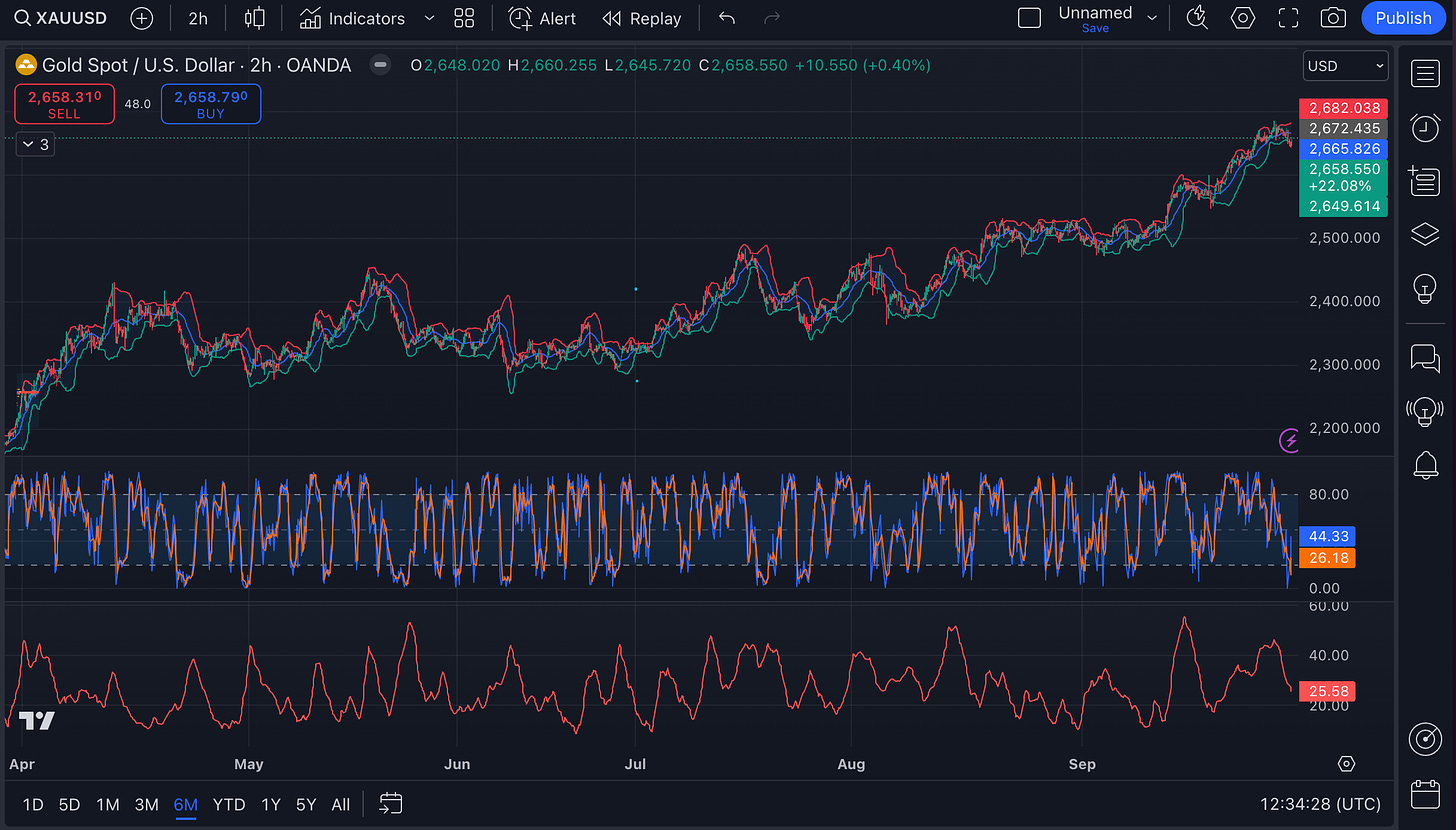
Last 6 months - 2h charts
Key takeaway:
Gold is in an overall uptrend, and the current setup shows there’s still potential for upside. It’s facing some near-term resistance around $2,660. The MACD and Stochastic Oscillator indicate some near-term sideways movement or a small dip before the price can continue higher.
Moving Averages are in a bullish formation → a sign that the market has strong upward momentum.
Gold’s currently at $2,658.55, below the EMA 20, meaning it’s trying to pull back slightly → If price breaks above the EMA 20 soon, we could see further upside.
The MACD suggests bearish momentum is starting to build, but it’s not very strong yet.
The RSI is neutral → price could go either way in the short term, depending on how it reacts to the key levels.
The BB shows Gold is near the higher end of its recent volatility range → it’s approaching it’s resistance.
The Stoch Oscillator is recovering from an oversold zone (below 20) but hasn’t yet crossed into strong bullish territory → Gold might be consolidating after a strong run-up, and it’s possible the market is gathering strength for another move.
The ADX tells us that the current trend is still strong → any pullback/consolidation might be shallow, and the uptrend could continue in the medium term.
Last 3 months - 1h charts
Key takeaway:
Short-term outlook is bearish and selling pressure is increasing.
The more likely scenario for now is
Keep reading with a 7-day free trial
Subscribe to The Gold Trader to keep reading this post and get 7 days of free access to the full post archives.


