

Gold's next move: a deep dive into market signals
Gold's next move: a deep dive into market signals

Hello, fellow traders!
We’ve got the latest scoop on U.S. economic indicators that could shake up our investment strategies. Despite a pretty bullish day for Gold, the news show that Gold prices might face some downward pressure in the coming days.
📰 Key economic updates:
Unemployment Update: Jobless Claims Drop
The latest U.S. Initial Jobless Claims report for June 2024 reveals that 233,000 people filed for unemployment benefits. That’s fewer than the forecasted 236,000 claims and down from last week's 239,000.
Fewer people filing for unemployment typically means the job market is strong, which can boost confidence in the economy. A strong job market might prompt the Federal Reserve to maintain interest rates to keep inflation in check. This could lead to lower Gold prices as investors look for higher returns elsewhere.
Durable Goods Orders: Slight Uptick
In the world of durable goods, the latest report shows a modest increase of 0.1%. This is better than the forecasted 0.5% decrease but lower than the previous month's numbers.
Strong durable goods orders usually suggest that businesses are investing and consumers are spending, signaling a healthy economy. When the economy looks good, investors tend to move away from safe-haven assets like Gold, which could decrease its demand and price.
GDP Growth: Slowing Down
The U.S. Gross Domestic Product (GDP) report shows a quarter-over-quarter growth of 1.4%. This is slightly above the forecasted 1.3% growth but significantly lower than the previous quarter’s 3.4%.
Although the growth rate has slowed, the fact that it still exceeds expectations suggests the economy is stable, albeit not as robust as before. This mixed signal could lead to a stable or slightly bearish outlook for Gold, depending on how confident investors feel and their expectations about future interest rates.
📊 Let’s look at the data:
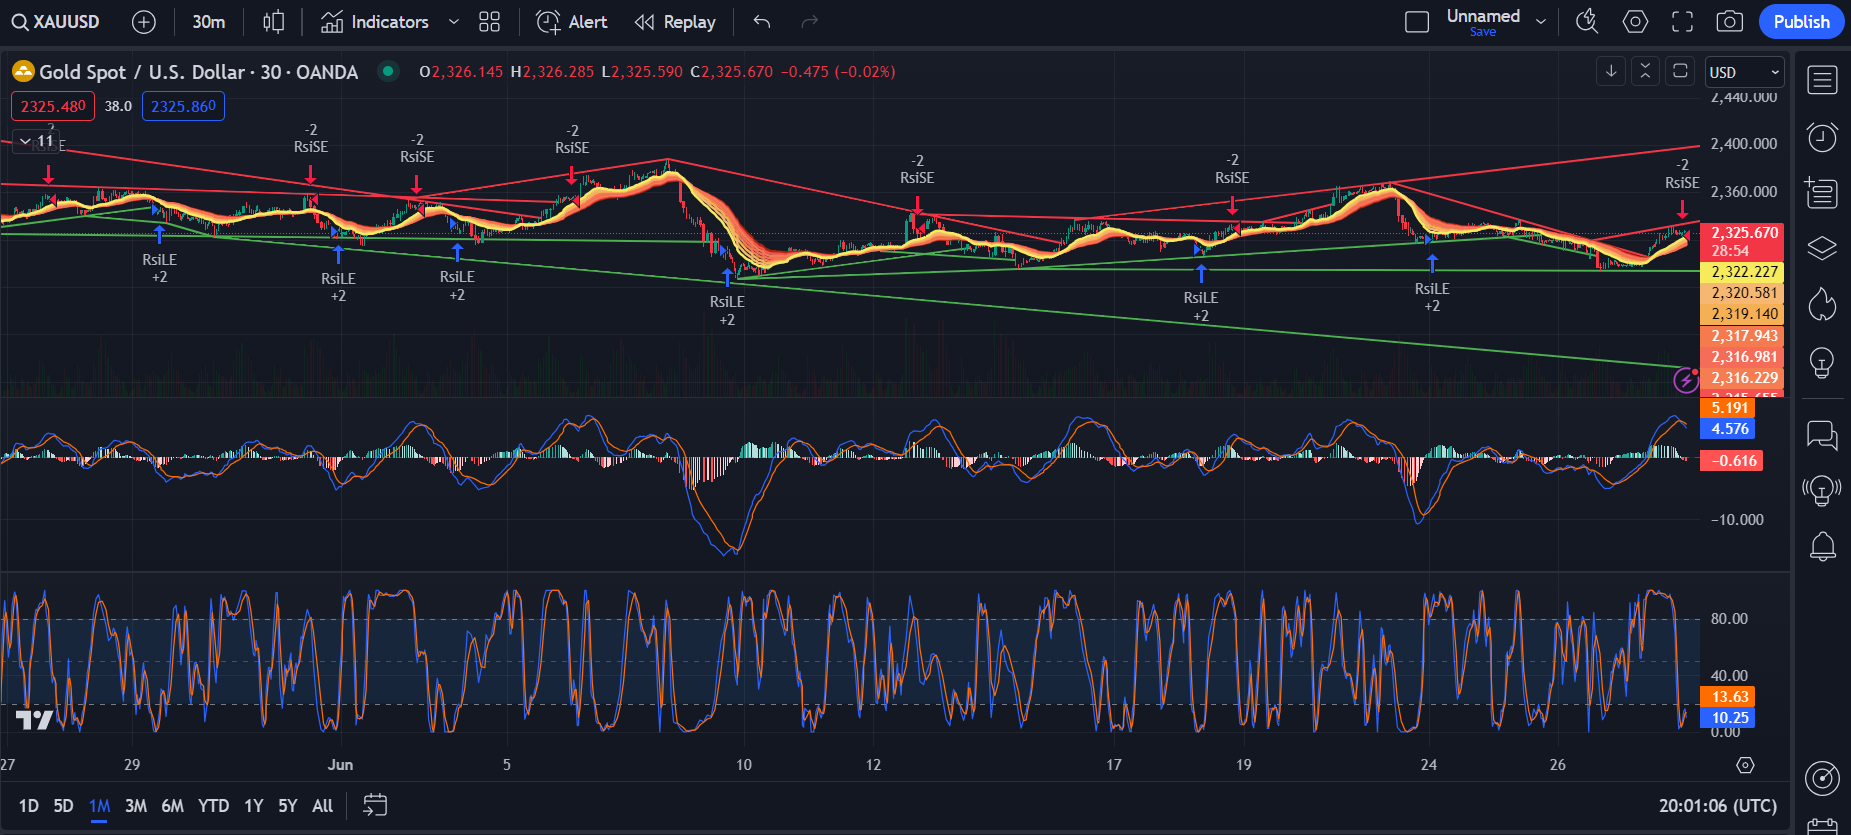
The 30-minute chart covering about 30 days shows a mix of bullish and bearish signals.
The red trend lines connect a series of lower highs, meaning the price keeps getting pushed down, showing persistent selling pressure at higher levels.
On the flip side, the green lines show higher lows, meaning buyers are stepping in at higher prices each time. This could indicate a consolidation phase within a broader downtrend, forming a potential rising wedge pattern. If the price breaks below the lower green trend line, it could confirm the bearish pattern, leading to a potential sell-off.
Keep reading with a 7-day free trial
Subscribe to The Gold Trader to keep reading this post and get 7 days of free access to the full post archives.