


Gold's Fading Momentum: Time to Take Profits or Double Down on the Geopolitical Hedge? [Weekly XAU/USD Analysis + Forecast + Trading Playbook]

Hello, fellow traders!
Gold opened Monday trading at ~$3,440 per ounce, building on a strong prior week. This bullish momentum was fueled by intensified geopolitical tensions in the Middle East, triggering a global flight to safety.
However, early optimism quickly gave way to profit-taking and market rebalancing. By Saturday, Gold closed at $3,368, marking a weekly decline of approximately 1.8%.
The escalating conflict between Israel and Iran, now involving direct U.S. military action, stands as the dominant catalyst for Gold.
Any further escalation—particularly events that threaten critical global energy infrastructure or choke points like the Strait of Hormuz—would almost certainly trigger sharp moves in Gold prices.
🔥 In this week’s premium market breakdown:
Interpret hidden TA signals before they hit the headlines: Pro breakdown of charts with key price action, structure, and warning signals.
Exact price zones to act on: Get clear entries, exits, and invalidation zones, so you can trade with structure.
Trade setups that deliver: High-probability scalping and swing trade ideas with clear take-profit and stop-loss levels.
Global macro gist: Spot which headlines matter for Gold, and which are just noise and understand how real-world policy is shaping the charts.
Sentiment shifts: Decode what the biggest traders in the world are doing right now and how their moves will shape next week’s volatility.
Intermarket intelligence: See how Gold is stacking up against Bitcoin, crude oil, equities, and global yields - understand correlations, breakouts, and capital rotations.


📊 Let’s look at the technical data

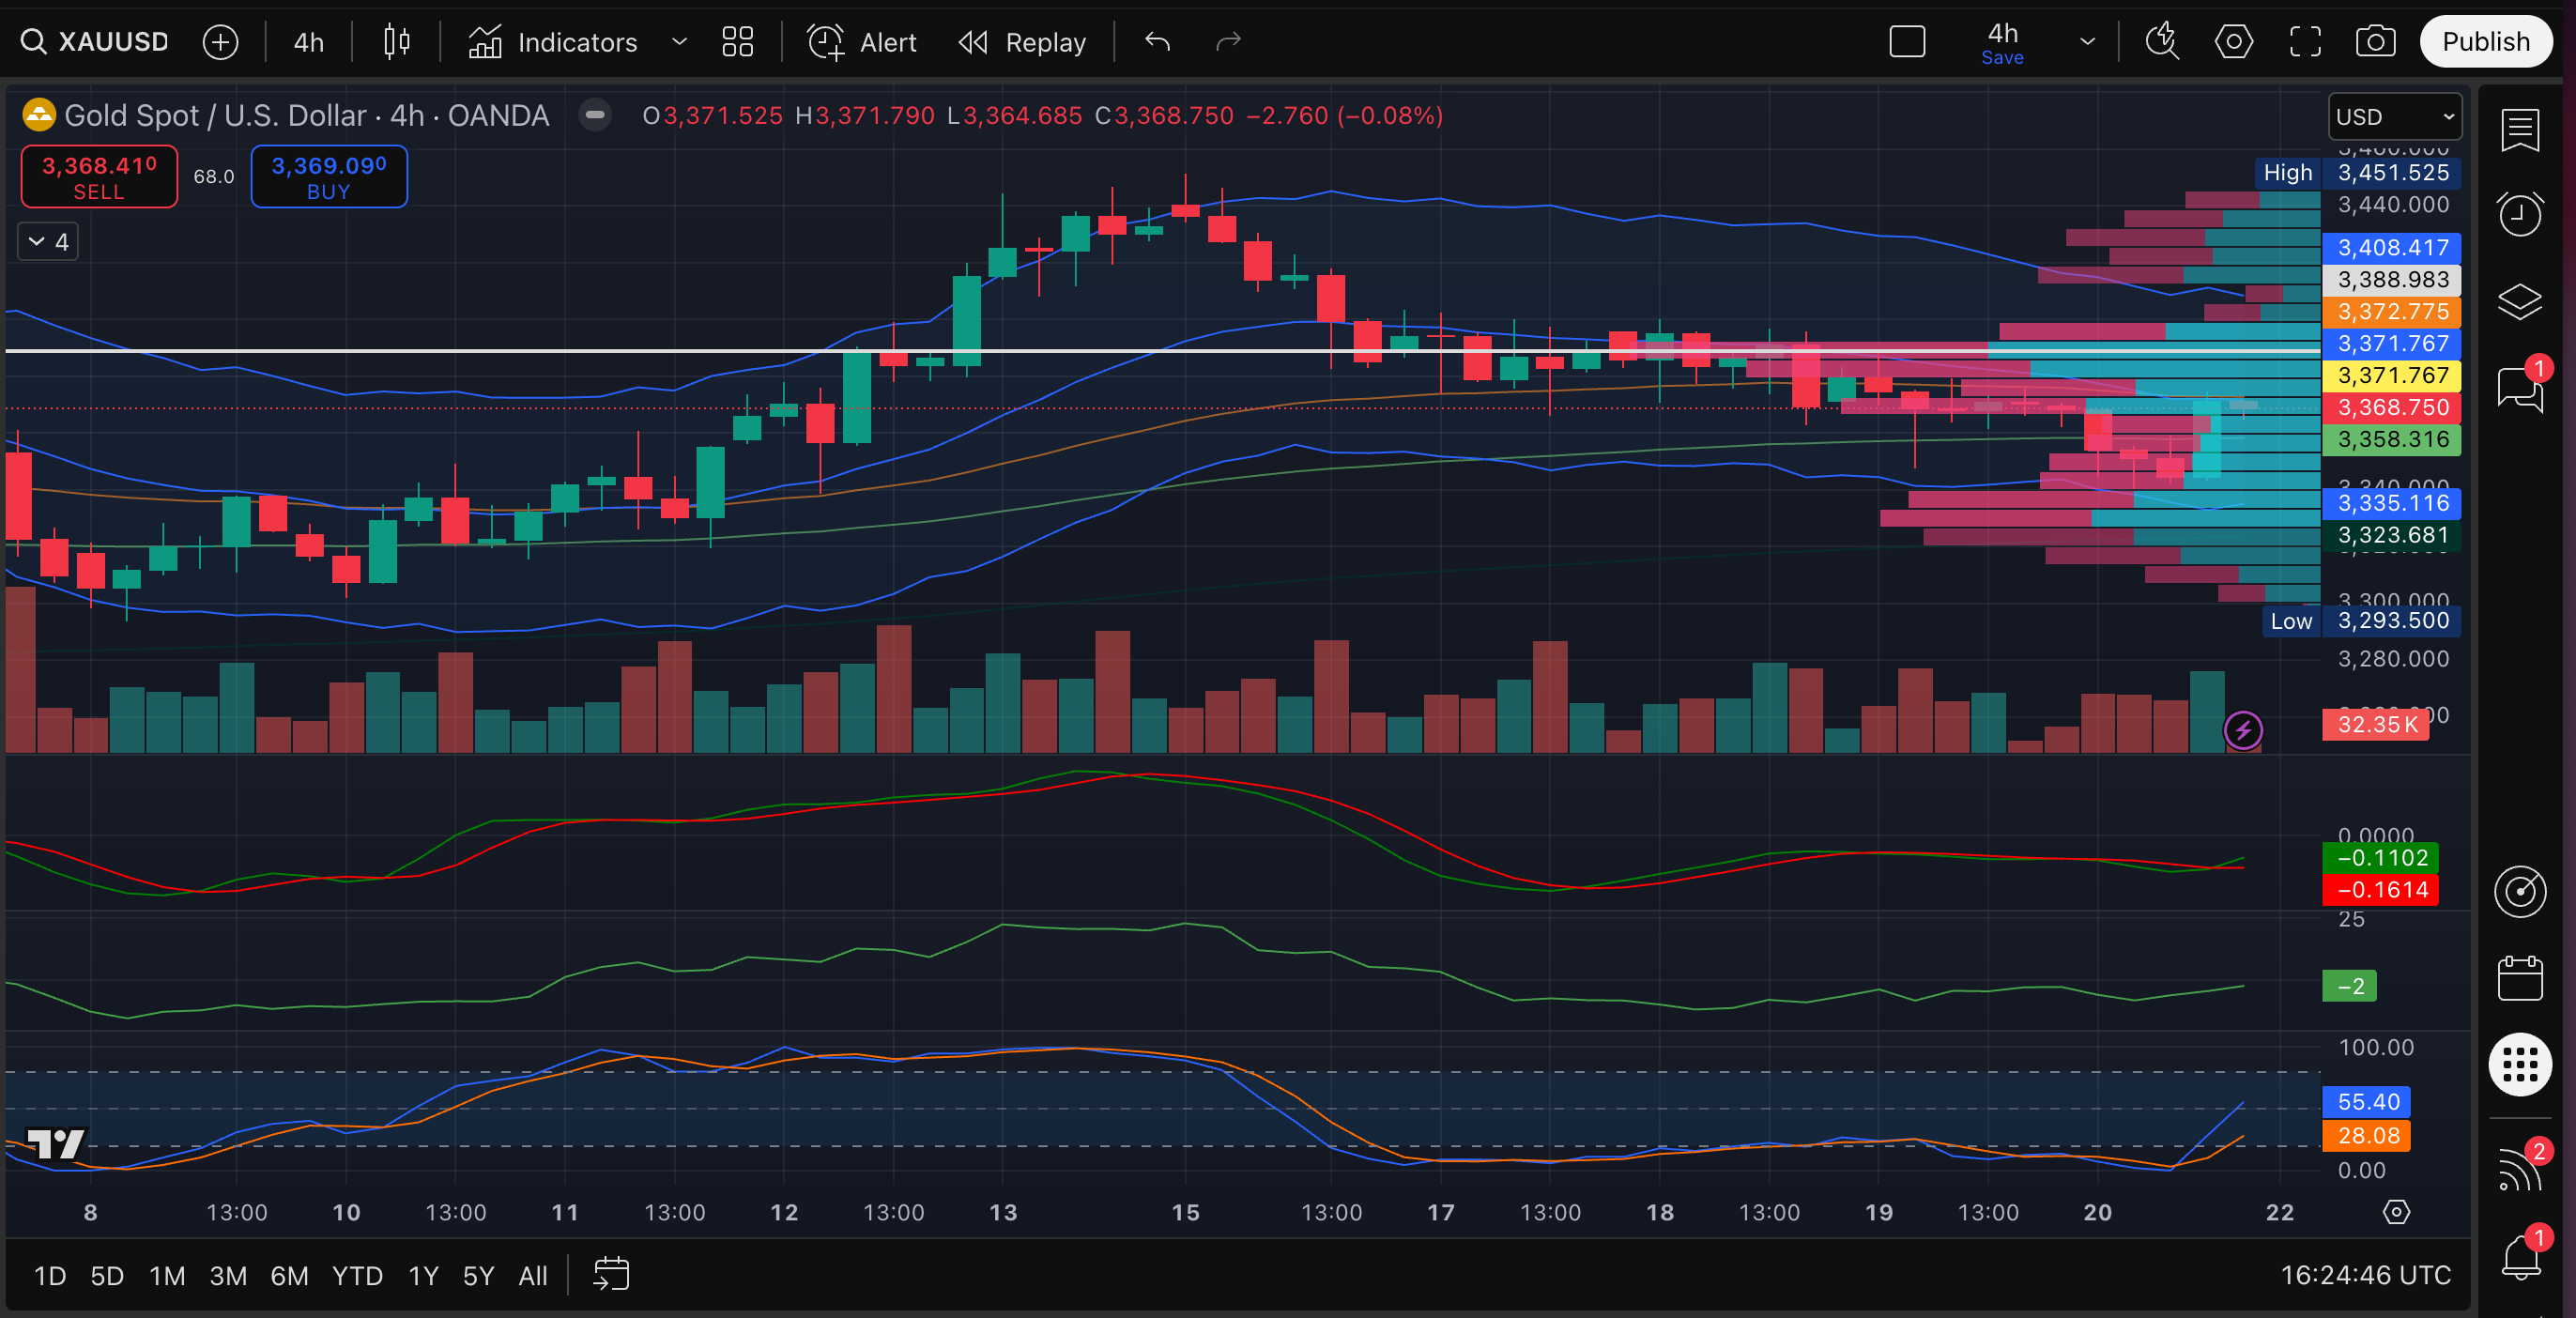

📅 Current Price: 3,368.75
Long-term: 🟢 bullish
The Bullish Flag pattern is still in play — price has broken out above the flag, a strong technical signal.
Both the Ichimoku Cloud and Fisher Transform confirm this move. These aren’t weak signals — there's real strength behind them.
Gold Spotter:
The green line is rolling over while the red line is rising — a potential bearish crossover is forming.
This kind of convergence can signal a bigger selloff if the green drops below the red.
Until the green flattens or turns up, this model isn't showing a bullish signal. OR if the green crosses below the red, it’ll be further confirmation of weakness.
Lastly, the Money Flow Index (MFI) isn’t showing strong inflows now — the breakout might be purely technical, without real buying power behind it yet.

Medium-term: 🟠 mixed, in consolidation
The daily breakout stalled at heavy resistance ~3,371, creating a standoff.
Price is now squeezed — short-term moving averages are pressing down, while long-term ones are holding it up from below. It’s a classic consolidation, where the market builds energy for its next move.
The Stochastic RSI gave an early heads-up from oversold levels, hinting a bullish bounce could be near and consolidation might be wrapping up.
⚠️ What to watch: ⚠️
A strong 4-hour candle close above
Keep reading with a 7-day free trial
Subscribe to The Gold Trader to keep reading this post and get 7 days of free access to the full post archives.