

Gold's bullish trend: How long can it last? Weekly Gold recap, technical analysis + mid-term predictions
Gold's bullish trend: How long can it last? Weekly Gold recap, technical analysis + mid-term predictions

Hello, fellow traders!
This week, Gold has once again set a new record high of $2,530 before declining sharply due to profit-taking and investor caution ahead of Fed Chair Powell's remarks at the Jackson Hole Symposium. Buyers, however, regained control after Powell's comments hinted at potential rate cuts and Gold steadied around the $2,512. Overall, the mid-term outlook for gold remains positive, supported by global economic uncertainties and central bank buying.
In this week’s update, I’ll:
Break down Gold market’s reaction to key events through weekly price action recap.
Examine closely the technical indicators pointing to potential exit/entry points and future price movements.
Highlight crucial support and resistance levels.
Summarize and analyze key economic data from around the world and how it might affect XAU/USD in the mid term.
Dive into the latest Gold demand and sentiment, including COT report, and what it means for Gold's outlook.
Share my mid-term predictions and speculations for XAU/USD.
⚡ New Gold record at $2,530, but market turbulence follows
Gold opened the trading week near its all-time high of $2,500 and continued to rally, reaching a new record of $2,530 on Tuesday. This was driven by optimism about upcoming rate cuts and reports of new Gold import quotas for Chinese banks, along with Chinese 10-year government bond yields falling to record lows. However, XAU/USD couldn't sustain that level and experienced a sharp decline, dropping back to the $2,500 support level.
On Wednesday, the market remained volatile, with prices dipping to around $2,490 due to profit-taking before attempting a recovery.
Thursday saw a broad downturn across financial markets, with prices falling across various assets as investors awaited remarks from Fed Chair Jerome Powell, who was scheduled to speak at the annual Jackson Hole Symposium on Friday. Gold prices plunged to around $2,470, losing $30 per ounce within an hour as treasury yields rose and the dollar strengthened.
On Friday, buyers regained control after two days of losses, stabilizing the price around the $2,512 level following Powell’s comments indicating that the central bank is finally ready to introduce rate cuts.
📊 Let’s look at the technical data
Last 6 months
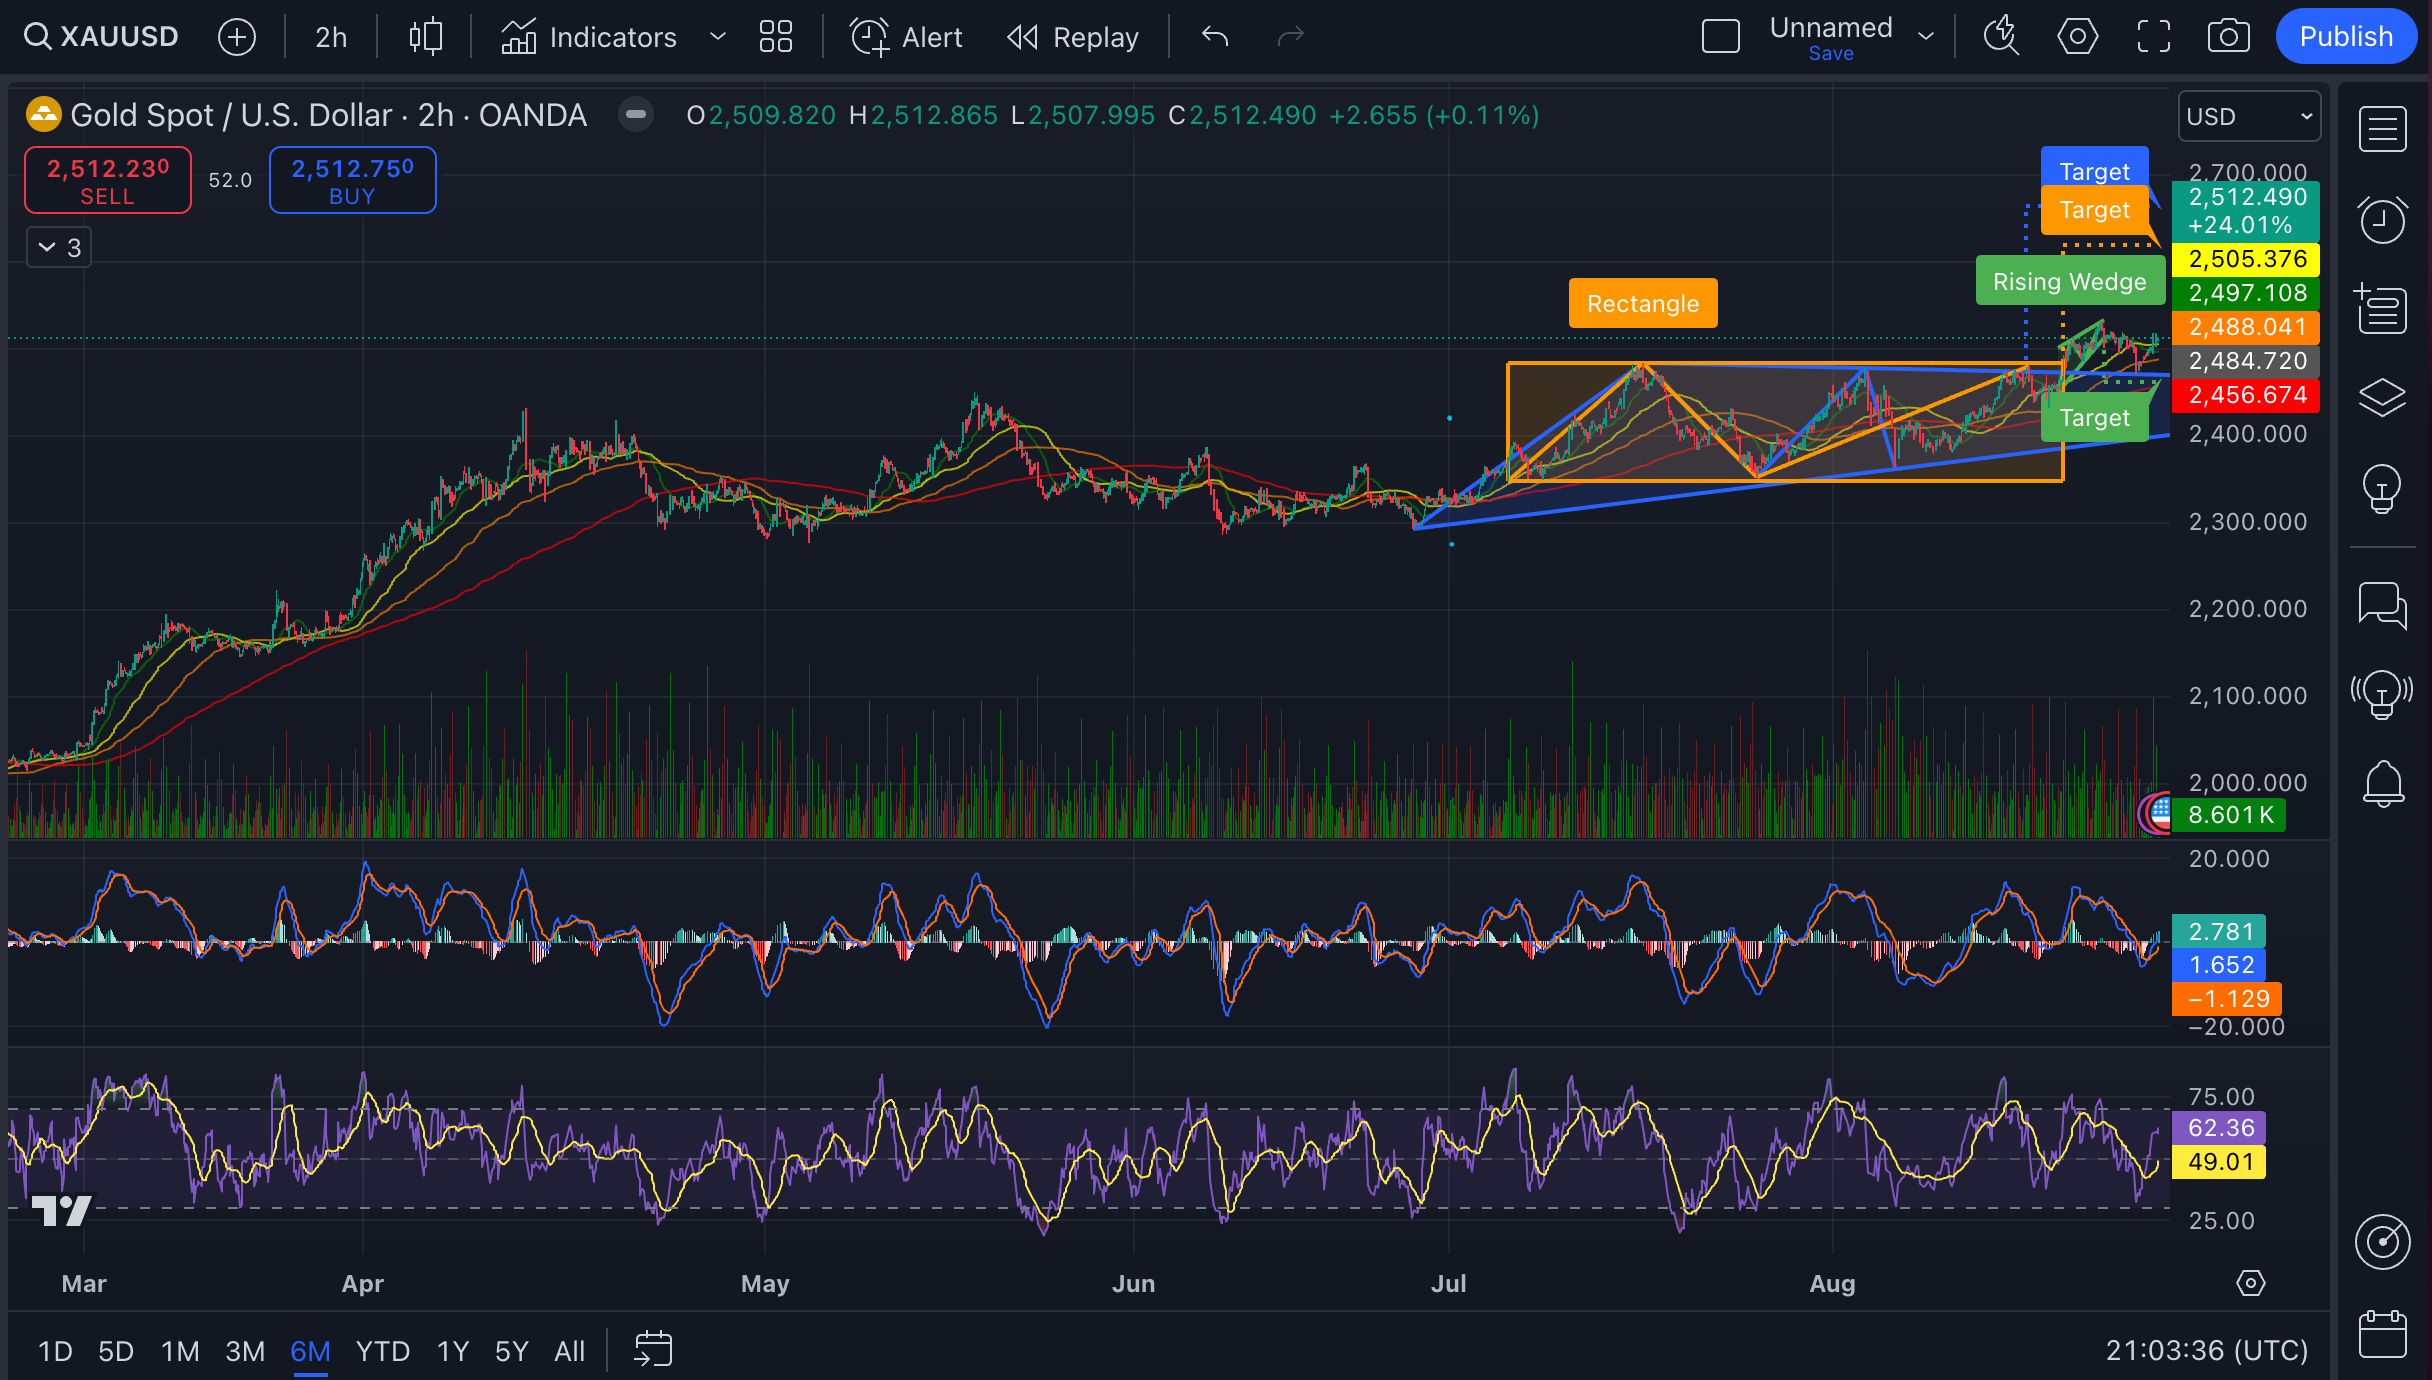
This is a 6-month view, covering from March to August with each candle representing 2 hours of trading activity.
The general sentiment here looks bullish. We're seeing an upward trend, with the price currently at $2,512.49, up 0.11% or $2.655 from the previous close.
Let's break down each indicator:
Price Action: The price has been moving in an upward channel since June. There’s a clear rising wedge pattern forming, which typically suggests a potential reversal. However, the price keeps pushing higher, breaking through previous resistance levels.
Moving Averages: We've got the 20, 50, 100, and 200-day Simple Moving Averages (SMAs) that are all stacked in a bullish order - 20 SMA on top, then 50, 100, and 200 below. This is typically a strong bullish signal. The current price is well above all these averages, at $2,512.49 compared to the 200 SMA at $2,456.67.
MACD: The MACD is above the signal line and the zero line, which is bullish. However, it's showing some divergence from the price action. While price is making new highs, the MACD isn't. This could be a warning sign of potential weakness in the uptrend.
RSI: The RSI is in bullish territory but not yet overbought. It's been fluctuating between 40 and 70 for a while, showing consistent bullish momentum without getting too overheated.
Patterns: There's a rectangle pattern from July to early August, which the price broke out of to the upside. This breakout is targeting around $2,620.
Looking ahead, the rising wedge pattern suggests we might see a pullback soon. However, the strong uptrend and bullish indicators suggest that any pullback might be temporary. The next major resistance level looks to be around $2,620 and $2,660.
It might be worth watching for a potential pullback to the support level around $2,480 (where the 20 and 50 SMAs are) as a possible entry point.

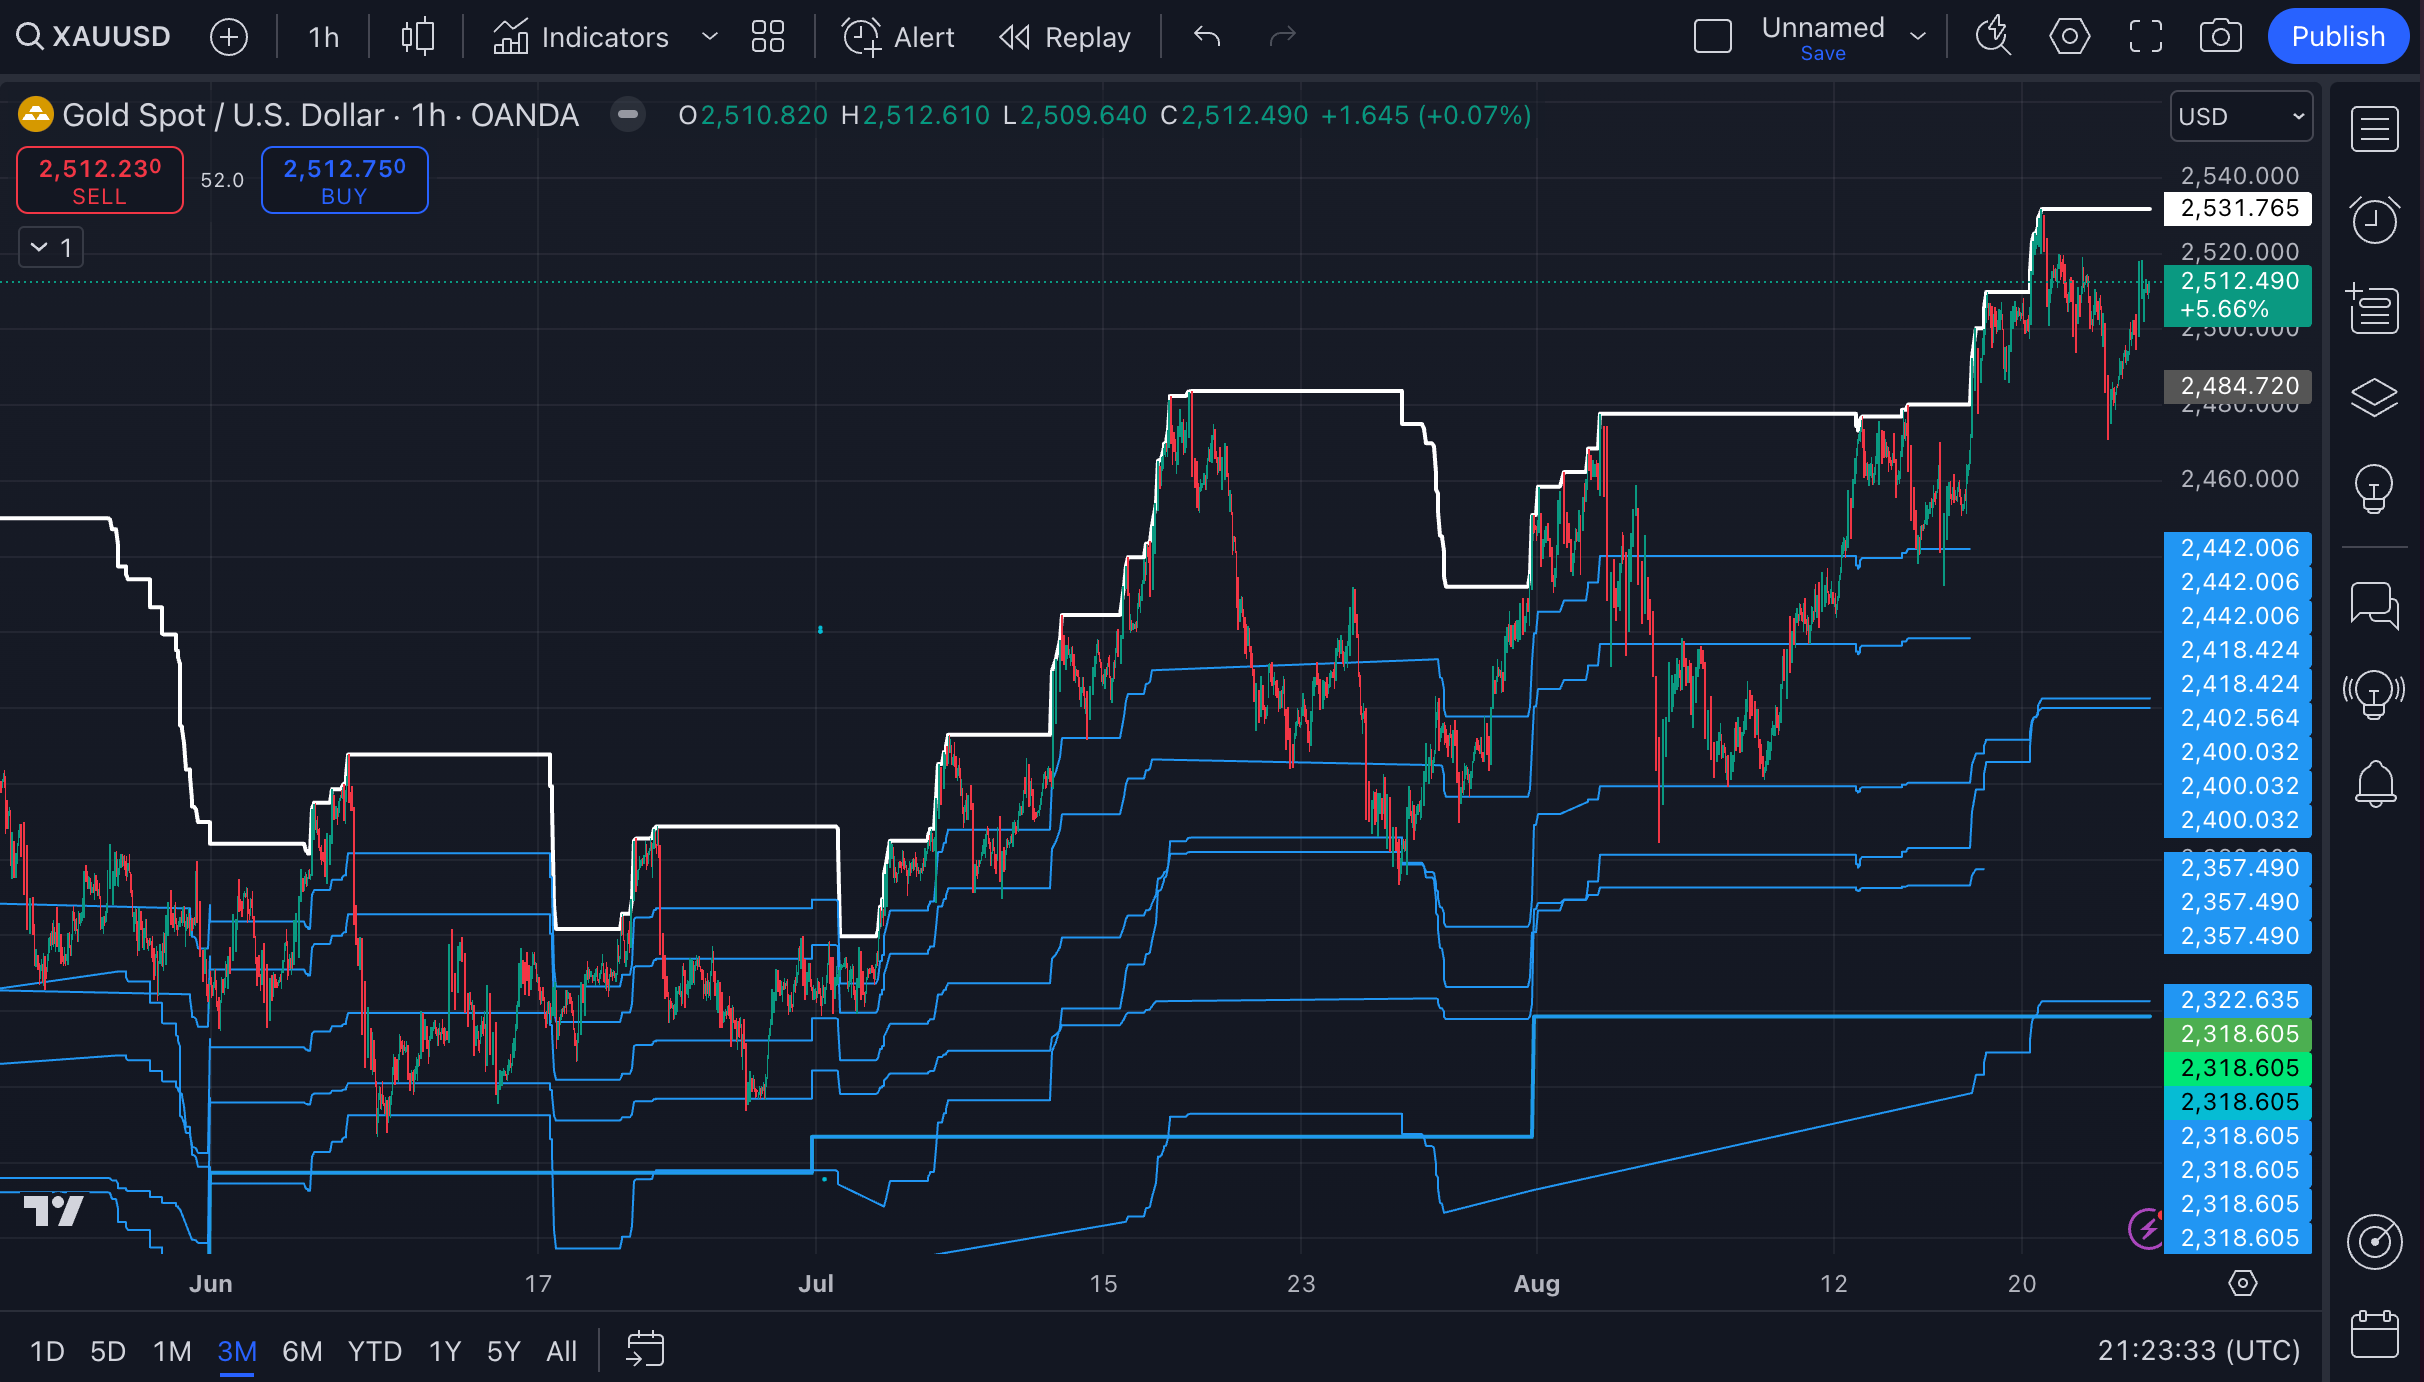
Last 90 days
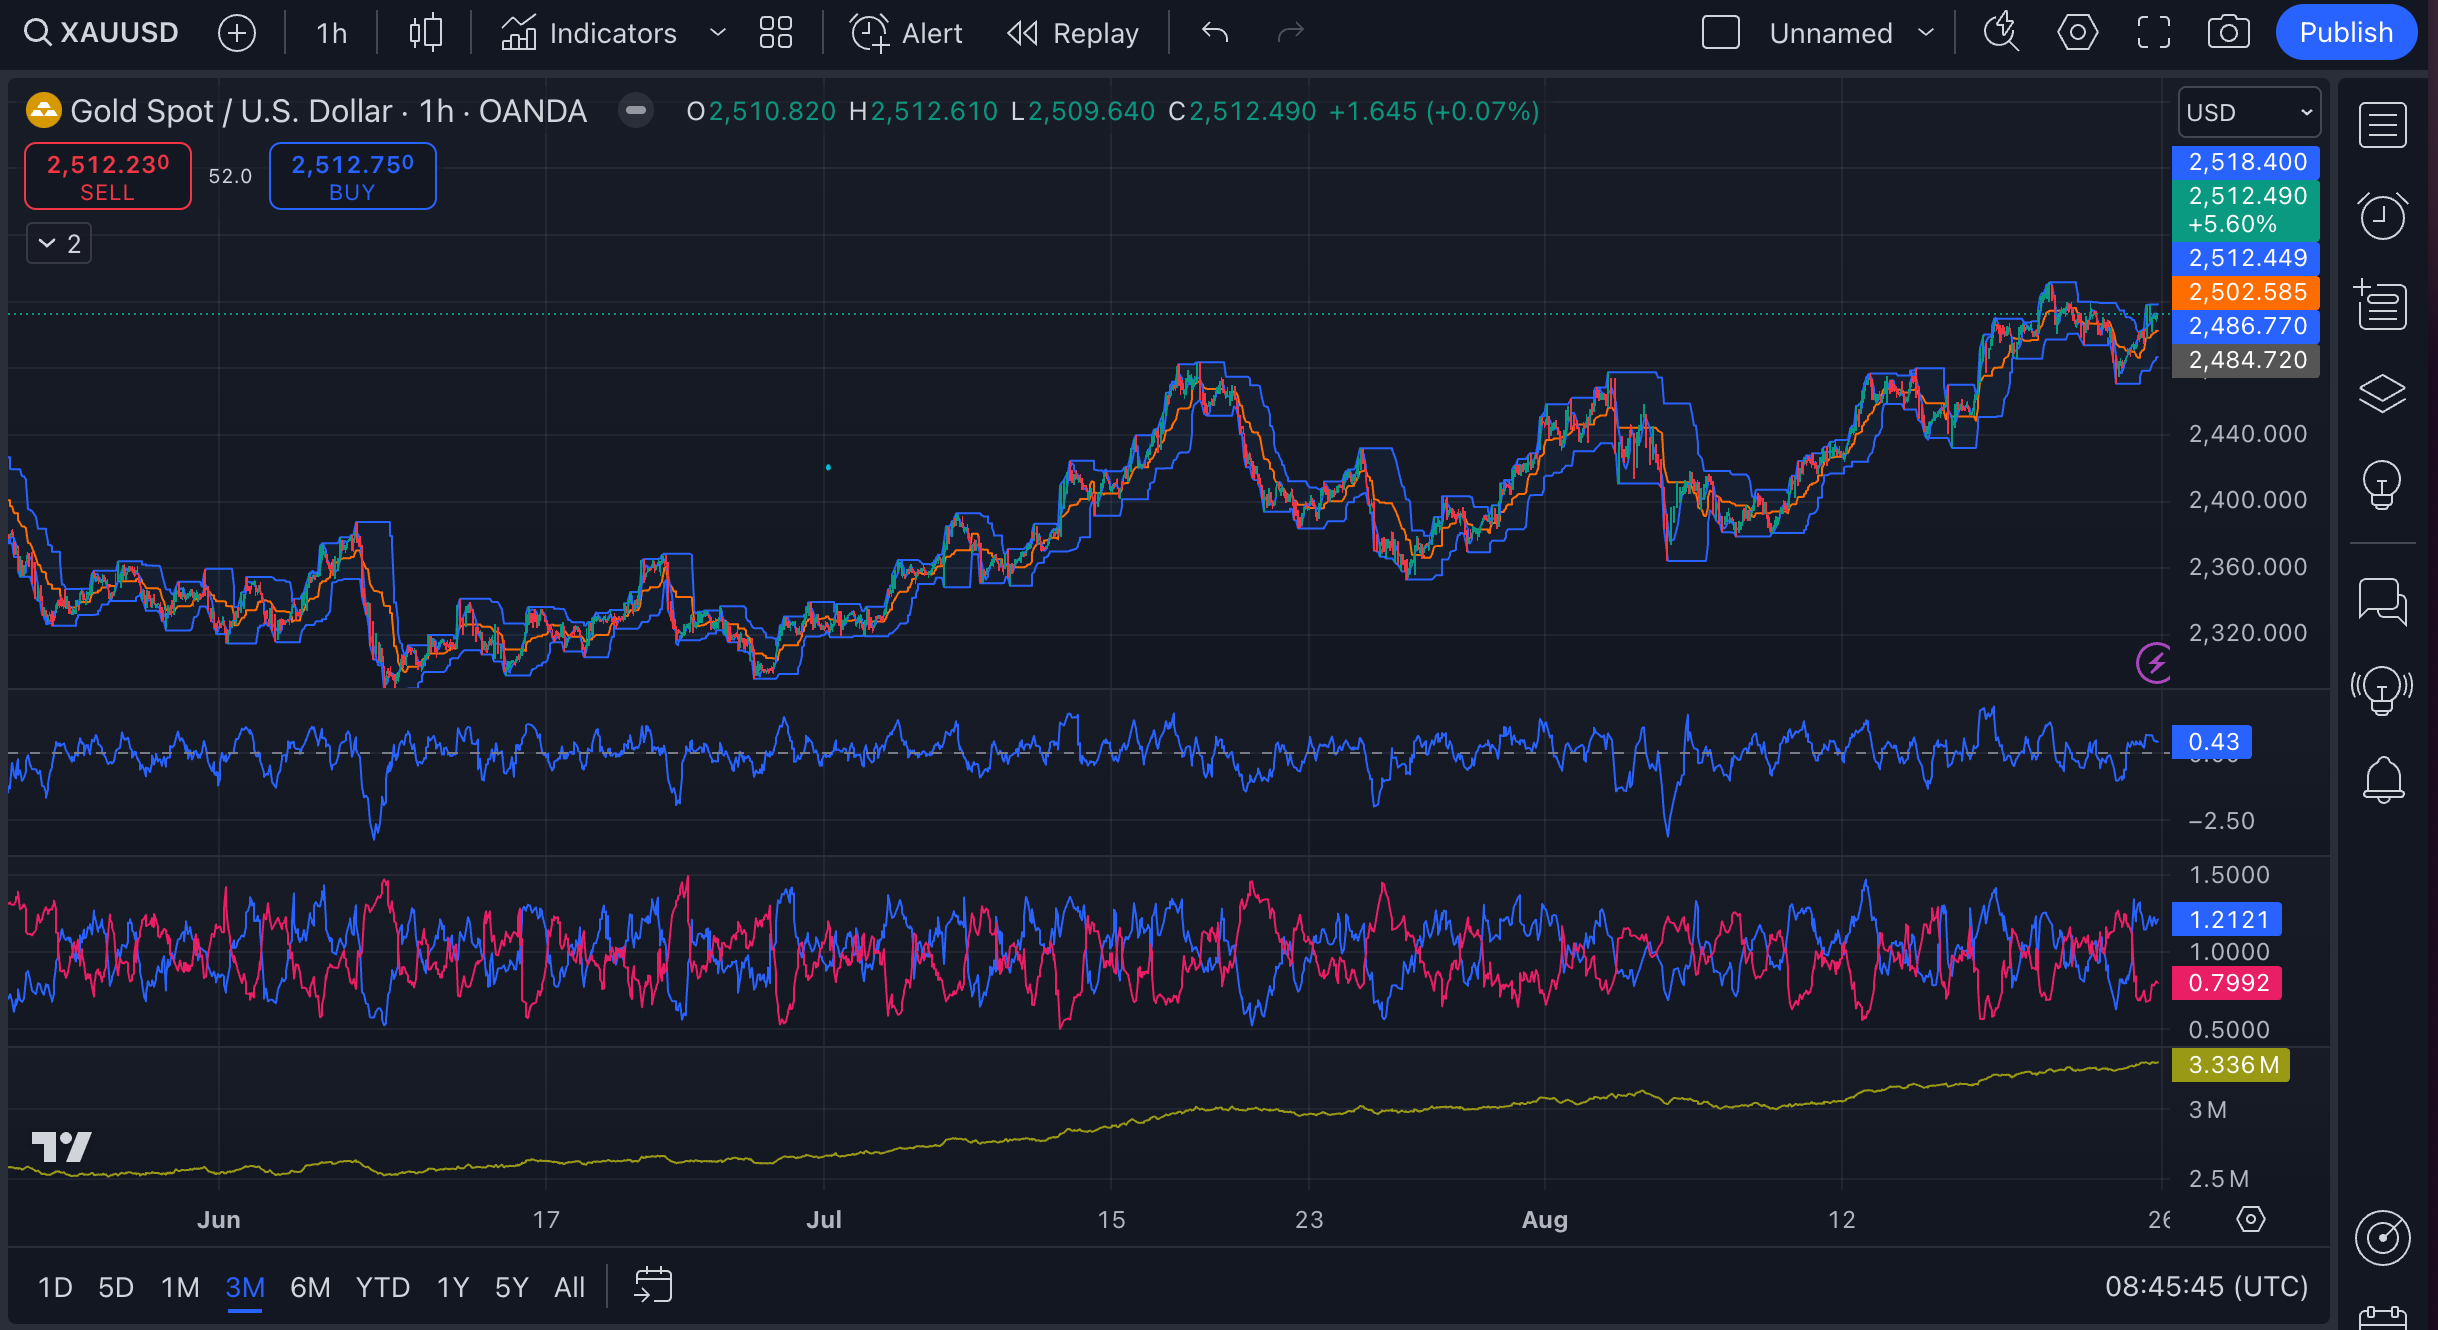
Now we're looking at a 3-month view, from June to August, with 1-hour candles.
The overall trend is still bullish with the price making higher highs and higher lows. But Gold is also near the top of recent ranges, so we might see a little healthy correction before going higher.
The 9-period HMA at 2,512.449 is practically identical to the current price. This is significant because the price riding along the HMA suggests strong momentum.
The Donchian Channel confirms the uptrend since the price is near the top of the channel - 2,518.400 (20-period high). However, it also means that Gold might be entering overbought territory and might pull back to the middle band - around $2,500 or lower around $2,486.
Rate of Change is at 0.43, which means the price is still steadily moving up.
Vortex Indicator: The positive line (VI+) has been consistently above the negative line (VI-) since early August, confirming the uptrend. However, they're not extremely far apart, suggesting the trend strength is moderate, not extreme.
Accumulation/Distribution has been rising steadily since June, now at 3.336M, showing there's been more buying than selling overall.
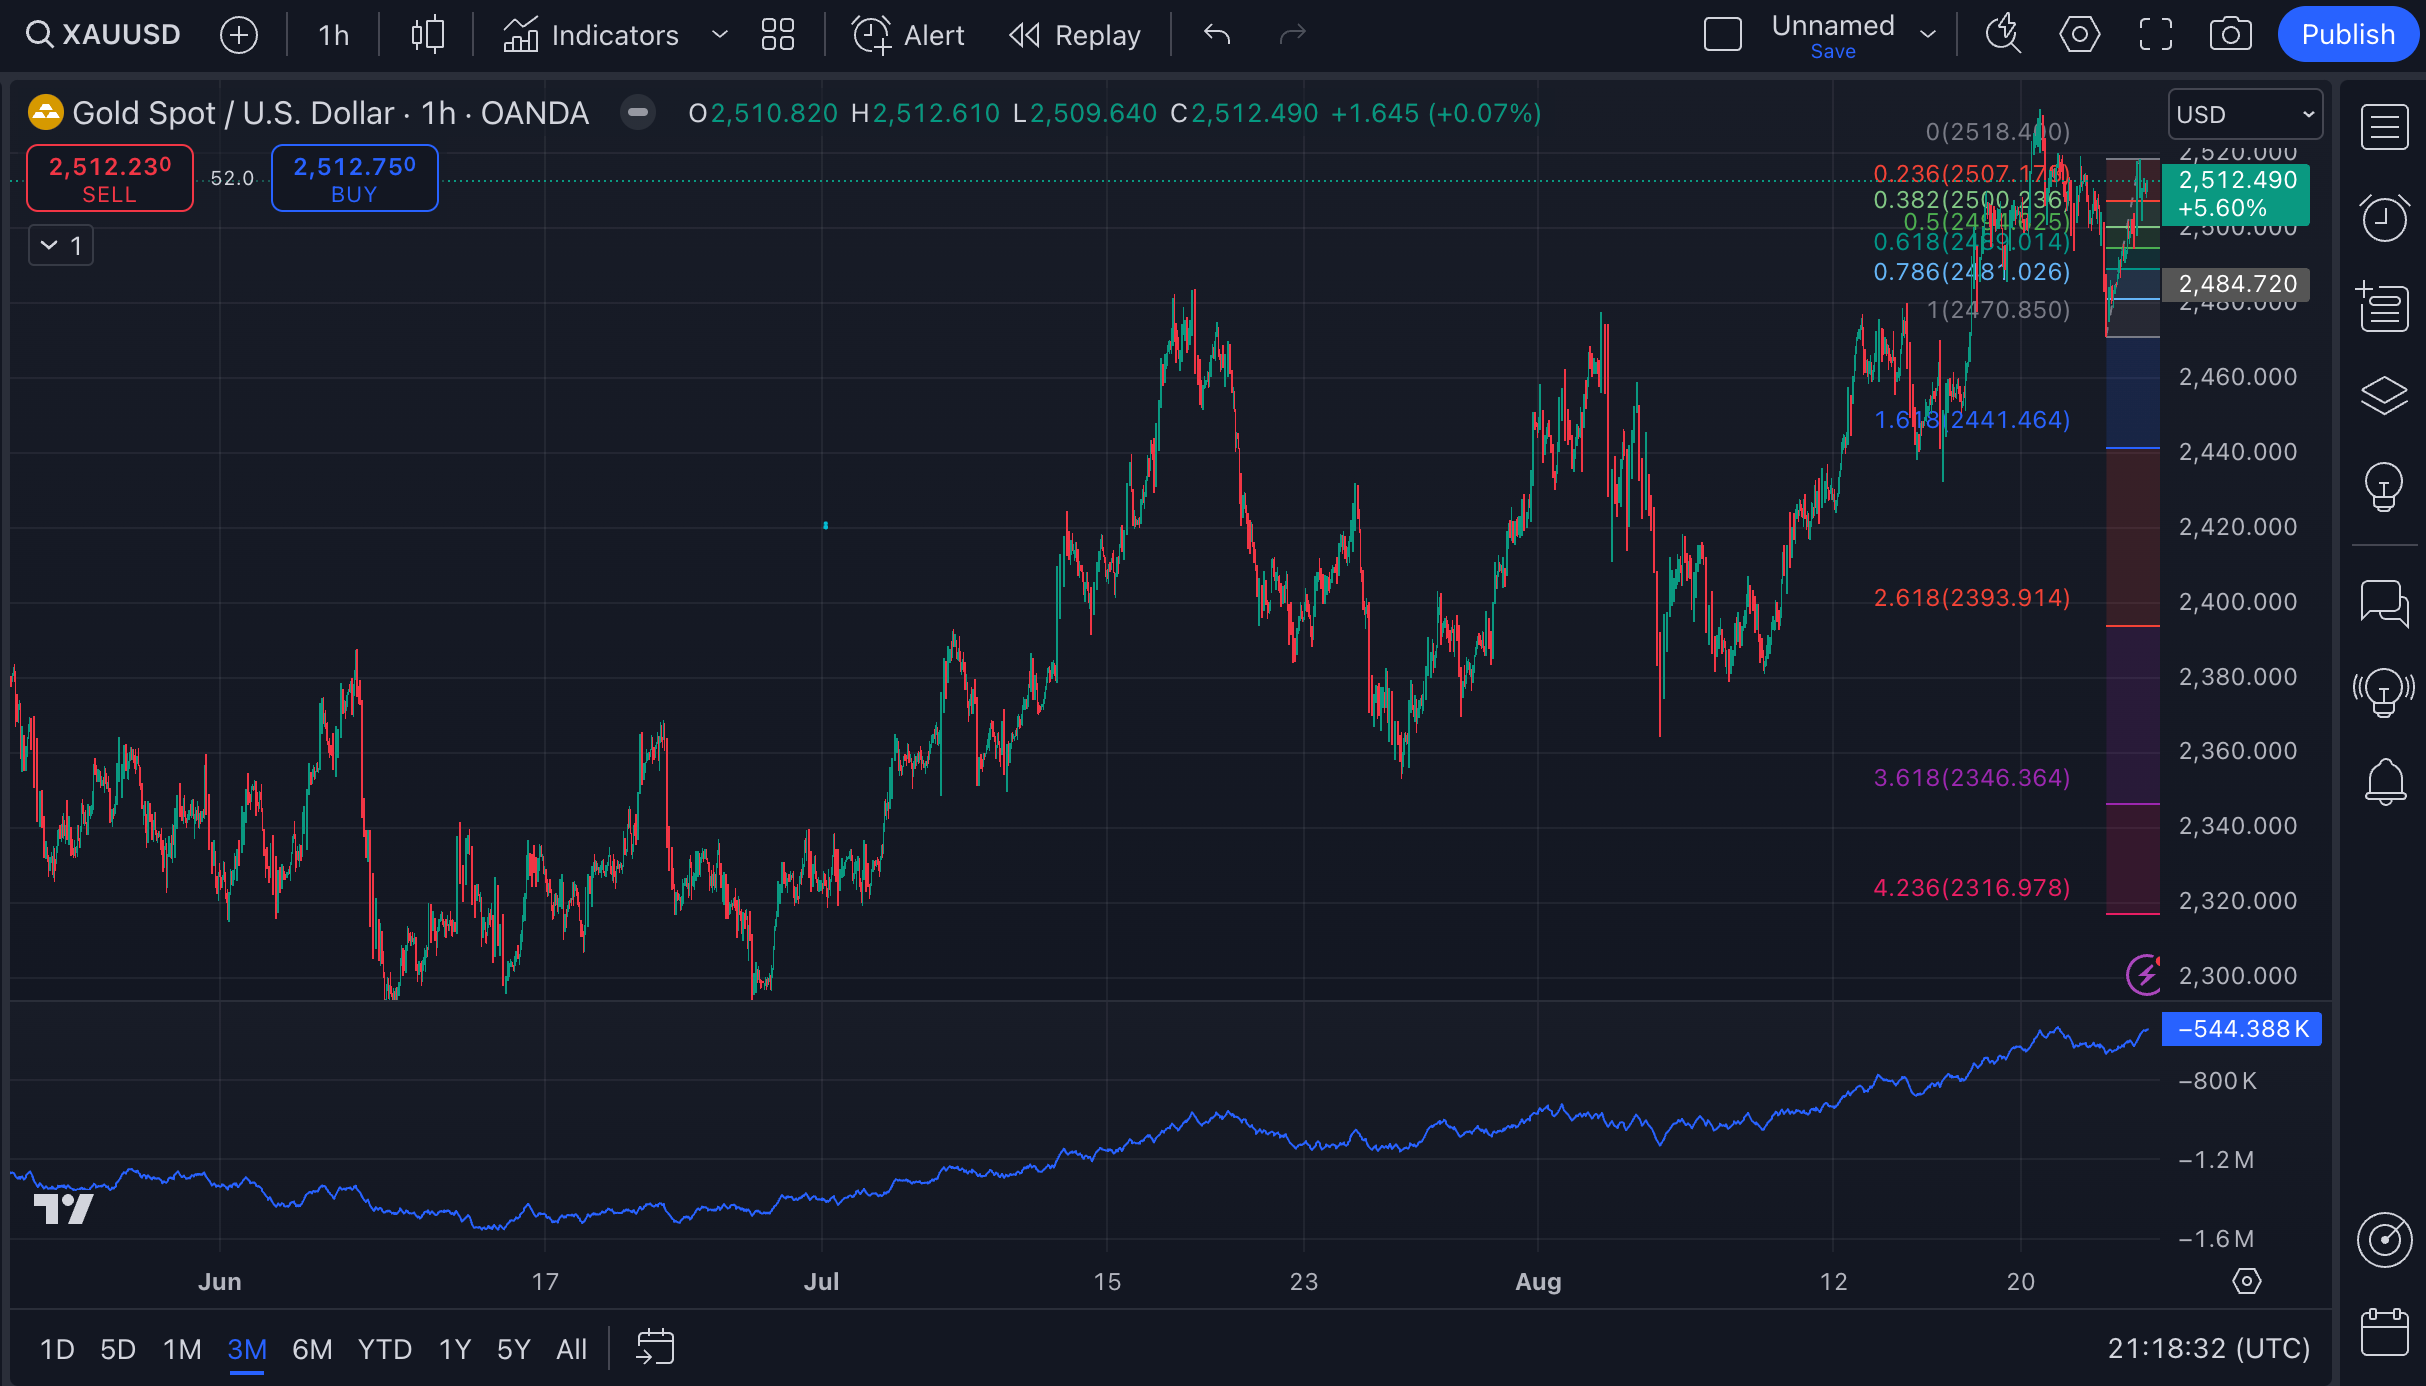
Since the previous chart showed that a pullback might be on horizon, let’s see where it might take us
Keep reading with a 7-day free trial
Subscribe to The Gold Trader to keep reading this post and get 7 days of free access to the full post archives.