Gold’s bull run on pause: In-depth analysis of XAU/USD’s technical setup and global influences + weekly price action forecast
Hello, fellow traders!
This week Gold has seen increasing bearish pressure this week with the price bouncing up and down within a set range. The price has tested the $2,530 resistance several times without breaking through. Meanwhile, the support of $2,500 that was holding strong has now cracked.
The current price action suggests we might be at a crucial juncture. The price could bounce back up from this lower level and continue the range. Or, if the downward push keeps up, we might see the price drop even further.
That said, news that China is buying more Gold along with highly anticipated rate cuts give XAU/USD a decent chance to climb higher in the near future.
In this week’s update, I’ll:
Analyze mid-term and short-term technical charts of XAU/USD and pinpoint potential future price movements.
Highlight crucial support and resistance levels.
Summarize key economic data from around the world and how it might affect XAU/USD in the mid term.
Dive into the latest market sentiment as to the COT report and what it means for Gold's outlook.
Share my short-term and mid-term predictions on XAU/USD price action.
📊 Let’s look at the technical data
Last 6 months
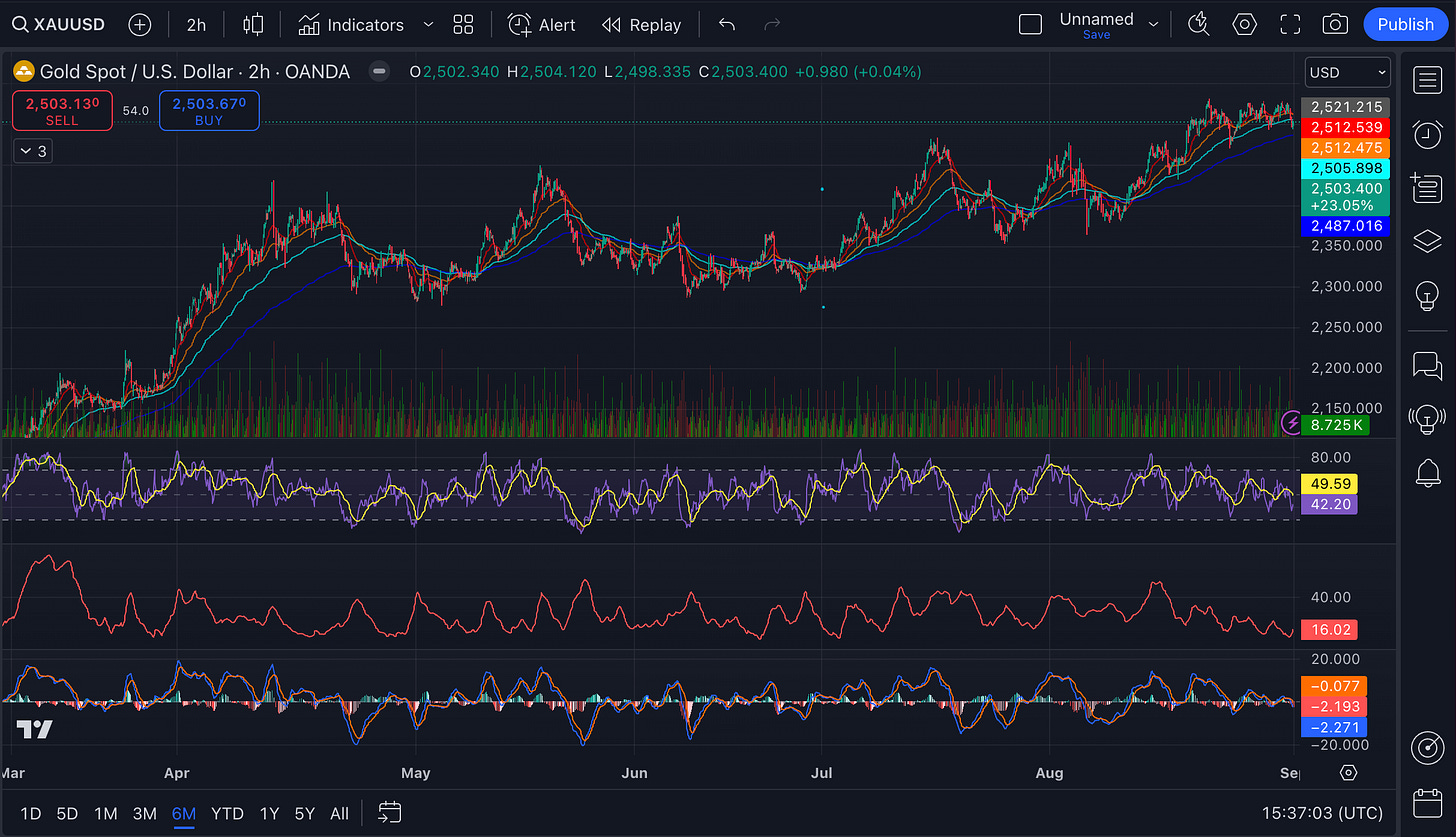
Looking at the last 6 months, the overall trend is bullish. Gold has been on an upward trajectory since March, climbing from around 2,000 USD to over 2,500 USD - that's a significant 23+% increase in about 6 months.
We're seeing higher highs and higher lows, which is a classic sign of an uptrend. The most recent high is at about 2,530 USD, which could be a key resistance level to watch.
EMAs are in a "golden cross" formation: the 20-day EMA is above the 50-day, which is above the 100-day, which is above the 200-day. This is typically bullish and suggests that the short-term trend is stronger than the long-term trend.
The price has been riding the upper Bollinger band for much of August, which indicates strong upward momentum. However, when price hugs the upper band for too long, it can signal that the asset is overbought.
The RSI is currently in the middle of its range. This suggests that Gold isn't currently overbought or oversold. However, we can see that it's been fluctuating quite a bit, often reaching into overbought territory before pulling back.
Stochastic Oscillator is showing similar patterns to the RSI, with frequent moves into overbought territory followed by pullbacks. Right now, it's at 26.60, which is in the oversold region. This could potentially signal a buying opportunity.
The MACD is slightly bearish, but given the overall trend, it might just be a temporary pullback.
The ADX is at 16.02, which suggests that the trend strength is currently weak. Given the clear uptrend we're seeing, this means we're
Keep reading with a 7-day free trial
Subscribe to The Gold Trader to keep reading this post and get 7 days of free access to the full post archives.


