

Gold weekly analysis & forecast: How weak US data and Central Bank demand shape XAU/USD future
Gold weekly analysis & forecast: How weak US data and Central Bank demand shape XAU/USD future


Hello, fellow traders!
It's been a relatively positive week for Gold, with the price reaching a 2-week high amid weak US economic data, strong demand from central banks, and geopolitical tensions in the Middle East.
In this week’s update, I’ll:
Recap Gold’s weekly price action.
Analyze Gold’s technical performance over the last 90, 30, 5 days.
Highlight crucial support and resistance levels based on Fibonacci Bands.
Summarize all key economic events that influenced Gold prices this week.
Assess the current market sentiment by looking at Gold demand-supply and breaking down long/short positions of different trader categories
Share my mid-term predictions and speculations for XAU/USD.
⚡ Gold’s up +2.3% and hits 2-week high
Gold has generally been on the rise, consistently staying above $2,400 for the last 5 trading days.
The week started with Gold around $2,392. It gained bullish momentum on Tuesday, climbing steadily to $2,412. On Wednesday, XAU/USD continued to rise, facing resistance at $2,450 but managing to close just below that level. After disappointing US economic data and a drop in US Treasury bond yields, Gold hit a 2-week high of $2,477 on Friday. It then sharply dropped, found support around $2,410, and rebounded to the current level of $2,442.
📊 Let’s look at the technical data
Last 90 days
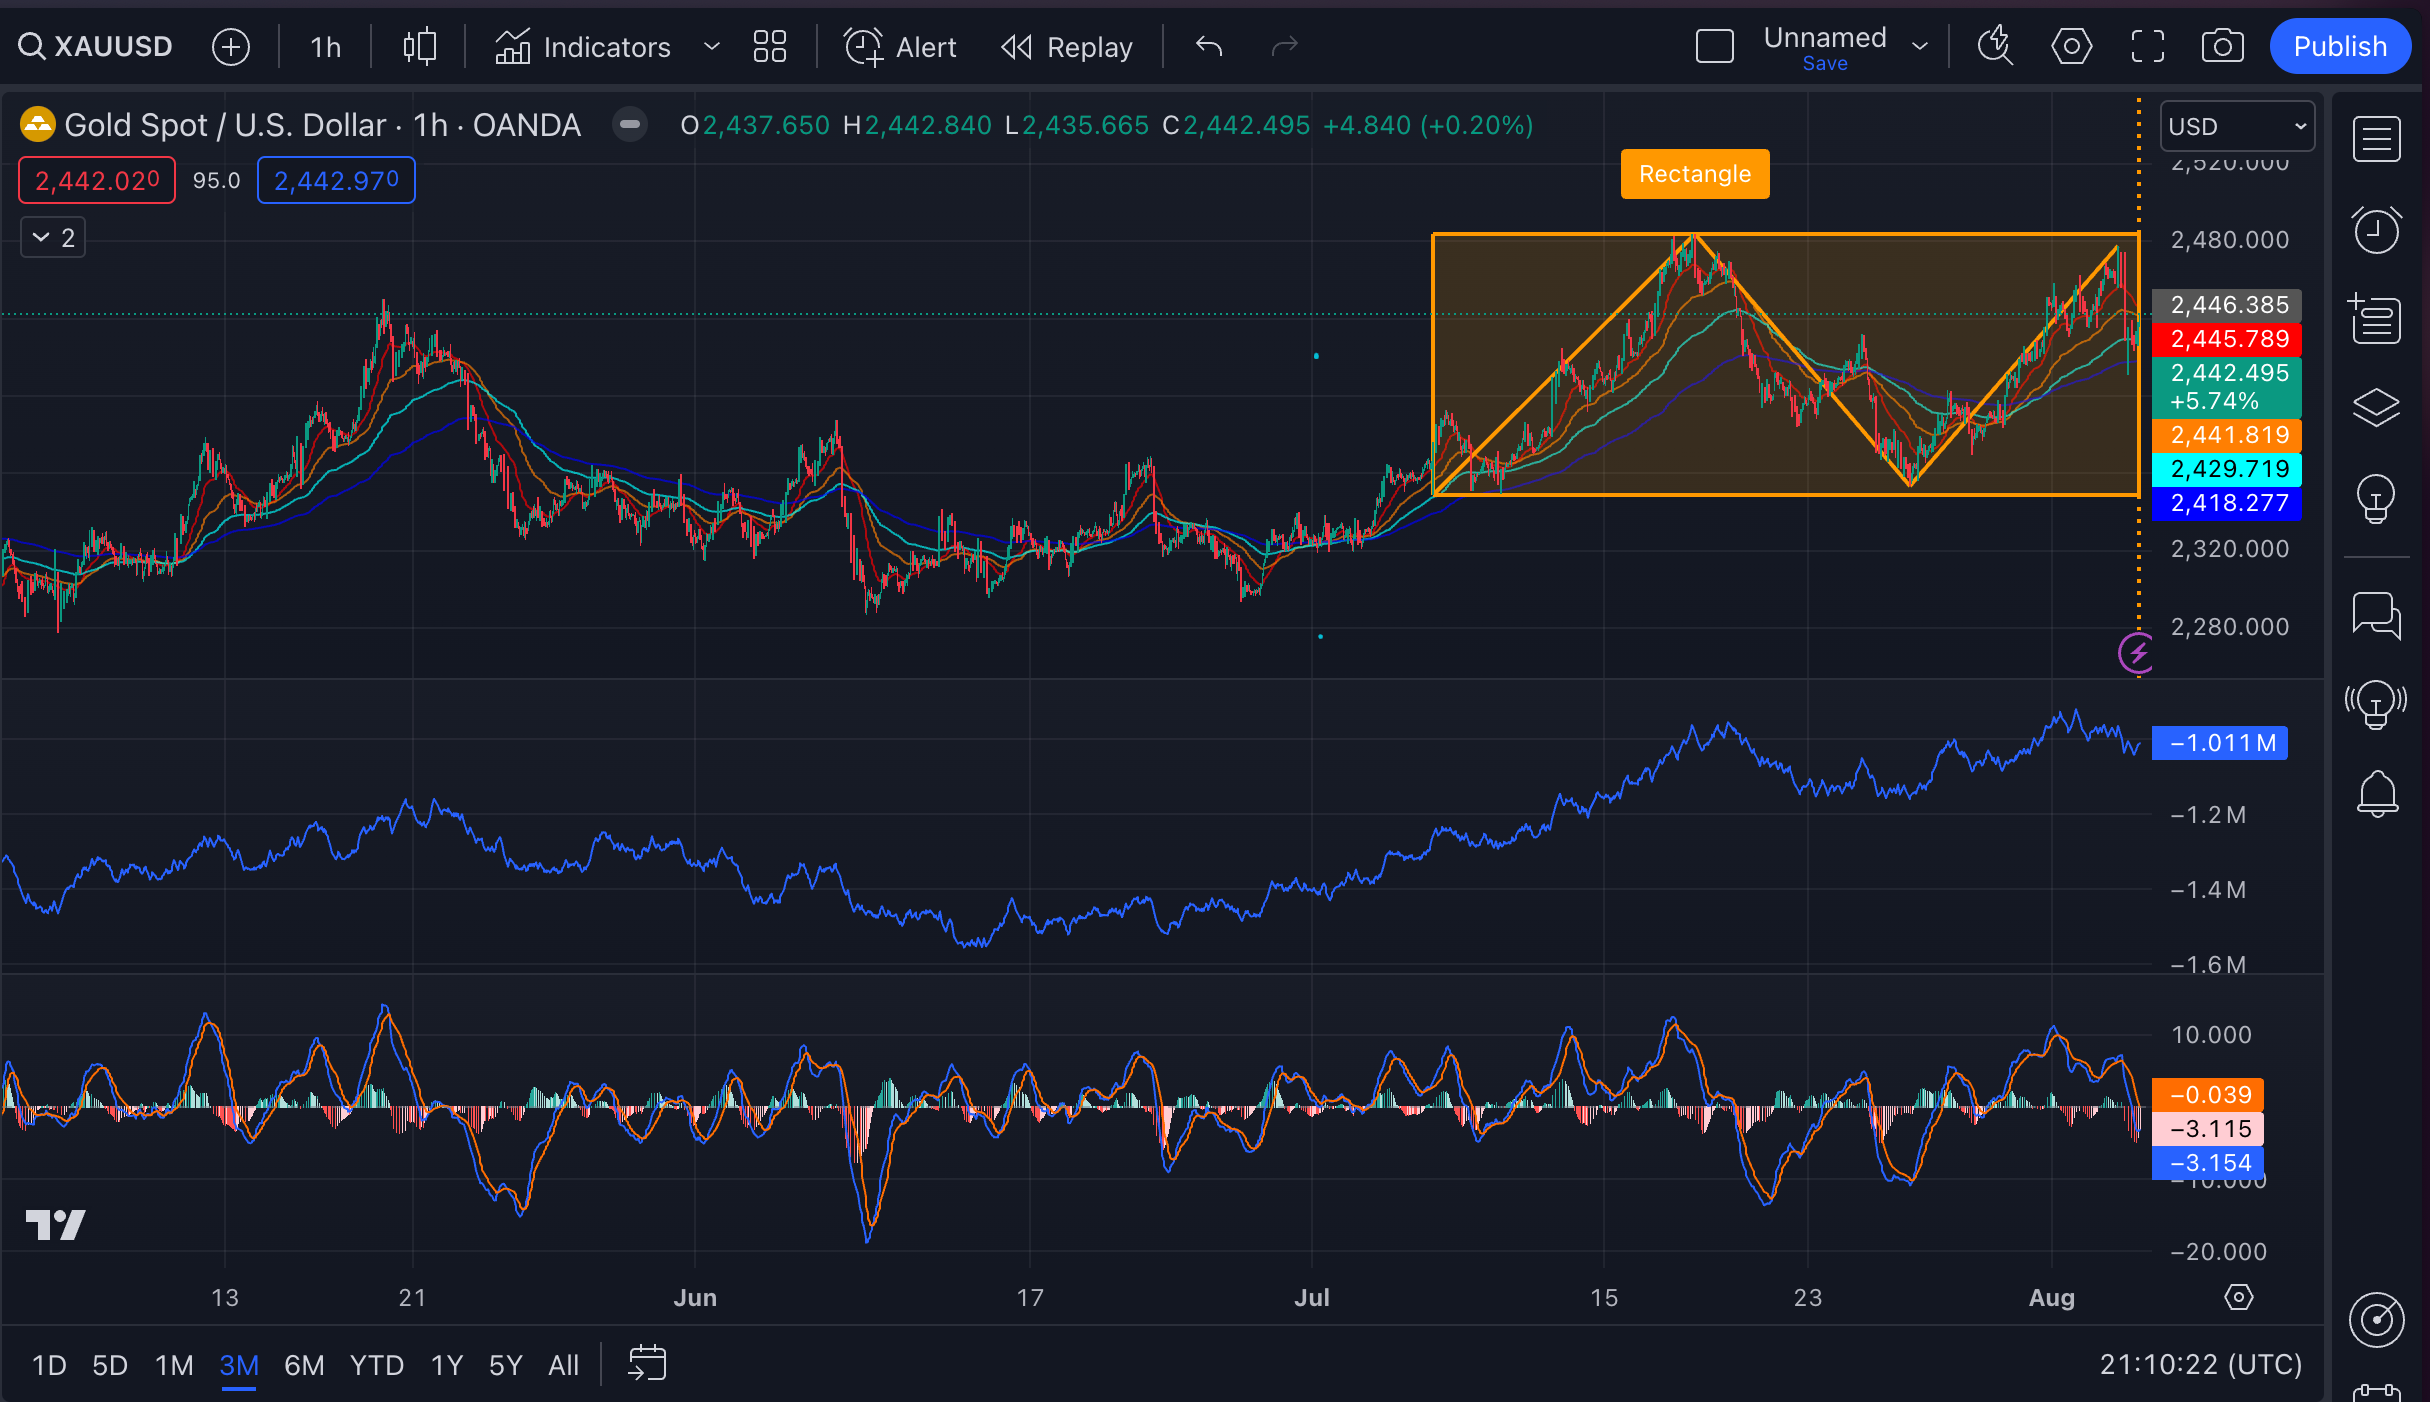
Based on this 90-day chart, Gold’s price is moving sideways within a consolidation range but with a slight bullish bias.
There's a prominent rectangle pattern, where the price has been bouncing between two levels:
Resistance: Around $2,445.
Support: Approximately $2,418.
Short-term EMA 20 and 50 are above the longer-term EMA 100 and 200, suggesting a bullish trend. Current price is hovering around the short-term EMAs.
The MACD line is slightly above the signal line, but both are negative. This suggests that the recent momentum is slightly bullish but overall trend is weak.
The negative OBV suggests that there has been more selling pressure than buying pressure over the recent period. Traders have been more inclined to sell Gold rather than buy it. In this case, the negative OBV aligns with the recent consolidation.

Last 30 days
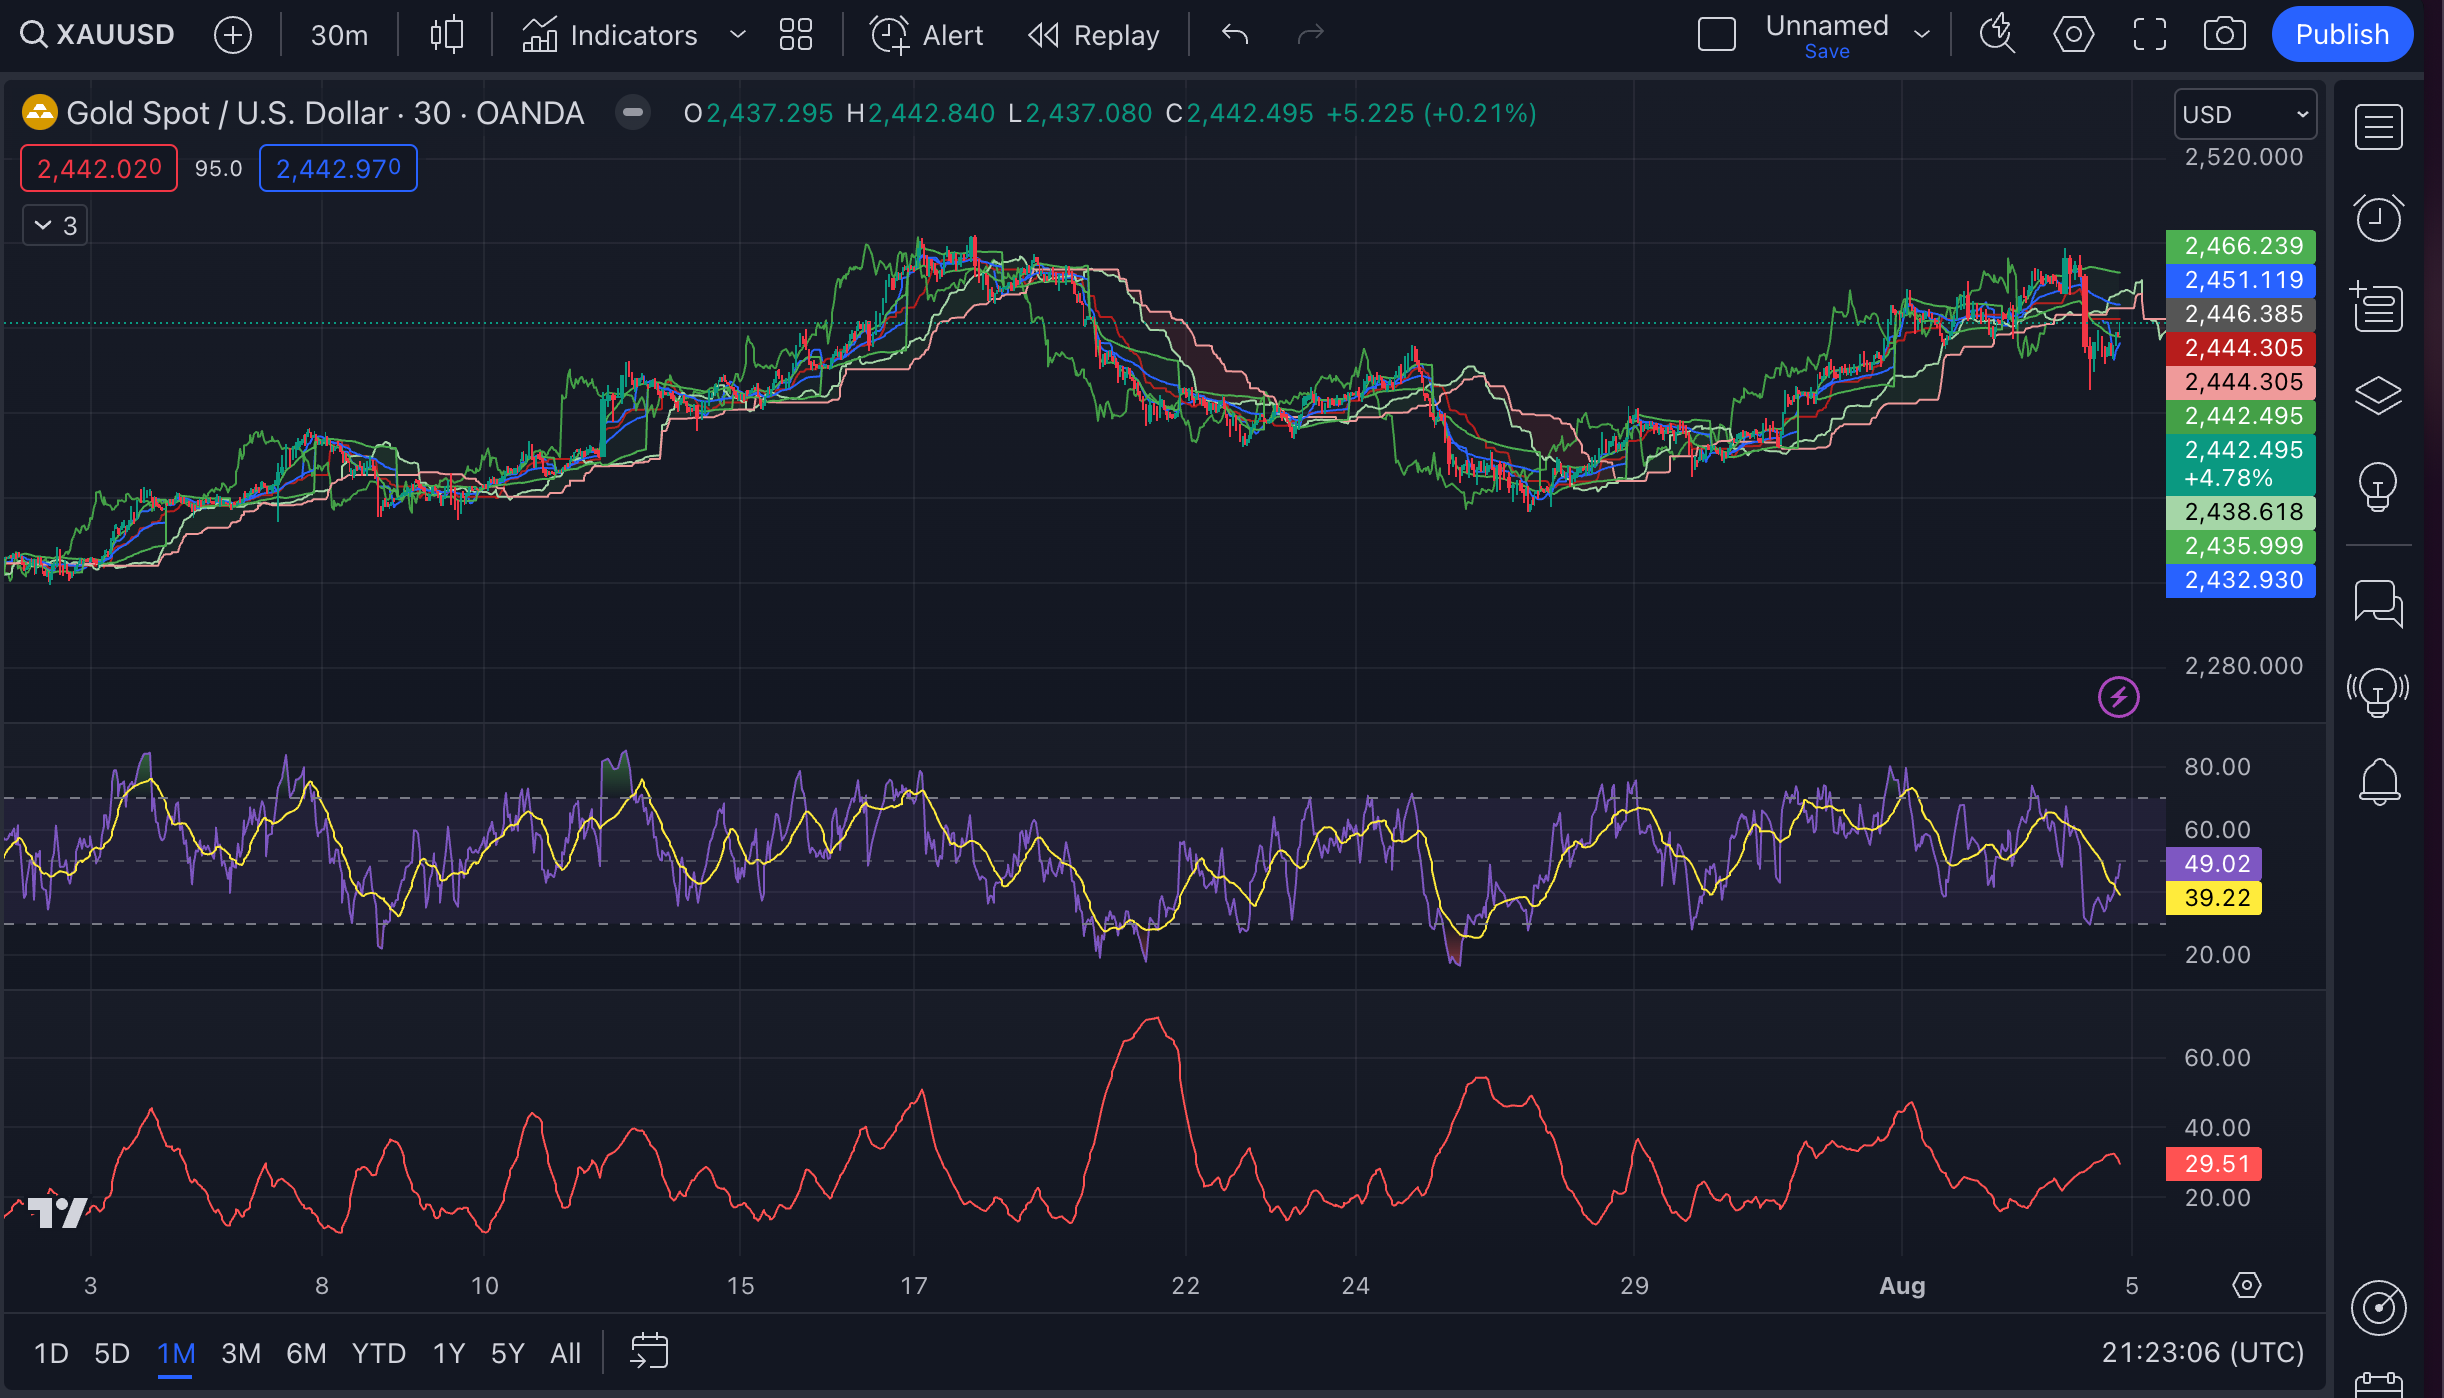
Current price is below the VWAP, suggesting it’s in a bearish territory short-term as it is trading at a discount compared to the volume-weighted average.
The price is currently within the Ichimoku Cloud, which is generally seen as a consolidation zone. The cloud's thickness and boundaries can act as support and resistance levels.
Upper Bound (around $2,444.305)
Lower Bound (around $2,432.930)
Trading within the cloud indicates indecision in the market, suggesting that the current trend is weak or consolidating.
The RSI is close to the neutral zone, suggesting neither overbought nor oversold conditions.
If the price breaks above the upper boundary of the Ichimoku Cloud ($2,444.305) and the VWAP ($2,451.119), it would signal…
Keep reading with a 7-day free trial
Subscribe to The Gold Trader to keep reading this post and get 7 days of free access to the full post archives.