
Gold vs everything: What one ounce actually buys in 1971, 2000, and today
A receipt for 55 years of dollar devaluation

If your grandfather bought a house in 1971, he paid ~$25,200. Today the same house costs sixteen times more.
Priced in ounces of Gold, he paid 720. Today it costs 89. Eight times less.
The house didn’t change. The dollar did.
We’ll walk through that with other stuff people actually buy: a burger, a tank of gas, a new car, a year of college. The picture is uncomfortable for the dollar, and most people don’t realize how far its purchasing power has slipped.
Let me prove it.

Gold was $35 until this happened
On the night of August 15, 1971, Richard Nixon went on TV and told the country the US would stop converting dollars into Gold at $35 an ounce.
Before that speech, every dollar in your wallet was, technically, a claim check on a fixed amount of metal sitting in Fort Knox.
After it, a dollar was a claim check on whatever the US government said it was worth that afternoon.
That's my starting line, and I’ll use reference points to anchor everything that follows:
1971: Gold = $35/oz (Bretton Woods official rate)
2000: Gold = $272.65/oz (annual average, World Gold Council)
May 2026: Gold ≈ $4,580/oz
As of 2026, Gold is up roughly 130x since Nixon killed the standard.
Which means that if someone bought $1,000 worth of Gold coins the night Nixon gave that speech and did absolutely nothing afterward, those coins would be worth roughly $130,000 today.
If they'd put the same $1,000 in CDs or short-term Treasuries at the average rate over 55 years, they'd have somewhere between $13,000 and $18,000 depending on whose math you trust.
Now let’s see what each ounce actually buys.
Big Macs 🍔
The closest thing America has to an inflation benchmark. The Economist literally built a global currency index around this burger.

Read that third row again.
One ounce of Gold in 2026 buys 775 Big Macs. In 1971 it bought 54.
The burger isn’t getting better. Ask anyone who ate one in 1981 versus one last week, it’s arguably gotten worse. What changed is the paper you’re paying with.
Gallons of gasoline ⛽

Heads up: the current number is inflated because of war. The Iran conflict that kicked off February 28 and the still-shut Strait of Hormuz have added more than a buck to the pump since mid-February.
Pre-war, EIA was forecasting a full-year average of $2.91 (Short-Term Energy Outlook, Feb 2026). Even with the war premium baked in, one ounce of Gold today buys 10x more fuel than in 1971.
The median American house 🏡

In 1971, the median American home cost 720 ounces of Gold. Today it costs 89.
And the house didn’t get worse, it got better. More square footage, central air, dishwashers that actually work, insulation, fewer asbestos surprises.
Picture two Americans in 1971, both sitting on 720 ounces of Gold.
One uses it to buy the median house.
The other just leaves the coins in a drawer.
⏩ Fast forward to today.
The first guy's house is worth $408,800, which buys him back 89 ounces of Gold.
The second guy still has all 720 ounces, now worth about $3.3 million.
The drawer guy is 631 ounces richer, roughly $2.9 million, for doing absolutely nothing except refusing to swap metal for paper.
The average new car 🚗

S&P 500 shares 📈
This is the one most Americans get told they’re supposed to own instead of Gold.
 = 0.34 units of the index. 2000 close: S&P at 1,320.28. One ounce ($272.65) = 0.21 units. May 5, 2026 close: S&P at a record 7,259.22. One ounce (~$4,580) = 0.63 units.")
Price-for-price, no dividends, an ounce of Gold in 1971 bought you 0.34 units of the S&P 500. Today it buys 0.63.
Gold has outperformed the index by roughly 2x over 55 years on a pure price basis.
Year 2000 was the peak of the S&P relative to Gold. From that peak through today, the S&P is up roughly 5.5x. Gold is up roughly 17x.
Now the honest caveat, because I’m not here to lie to you: if you reinvested every single dividend over 55 years, with zero tax drag and no behavioral mistakes, the total-return series beats Gold.
Roughly 11% annualized for stocks-with-dividends-reinvested versus about 9% for Gold.
But that 2-point gap is the comparison the “stocks always win” crowd quotes when they want a clean win. It assumes a robot.
Real humans pay taxes on dividends in taxable accounts, panic-sold in 1974, in 1987, in 2002, in 2009, in 2020, and aren’t perfectly disciplined reinvesters across half a century.
So the disciplined index investor in a tax-sheltered account did beat Gold over 55 years. The actual median American with a brokerage account, some 401(k) money, and a normal human nervous system did not meaningfully outperform someone who bought coins in 1971 and stuck them in a drawer.
One year of Harvard tuition 🎓
Higher education is the single most inflation-resistant pricing line in the American economy. Tuition has outpaced CPI by a factor of three for decades.
Gold still crushes it.

An ounce that barely covered a single semester in 2000 now pays for the whole year and leaves you change for textbooks.
A year of labor 👷🏽♂️, priced in Gold
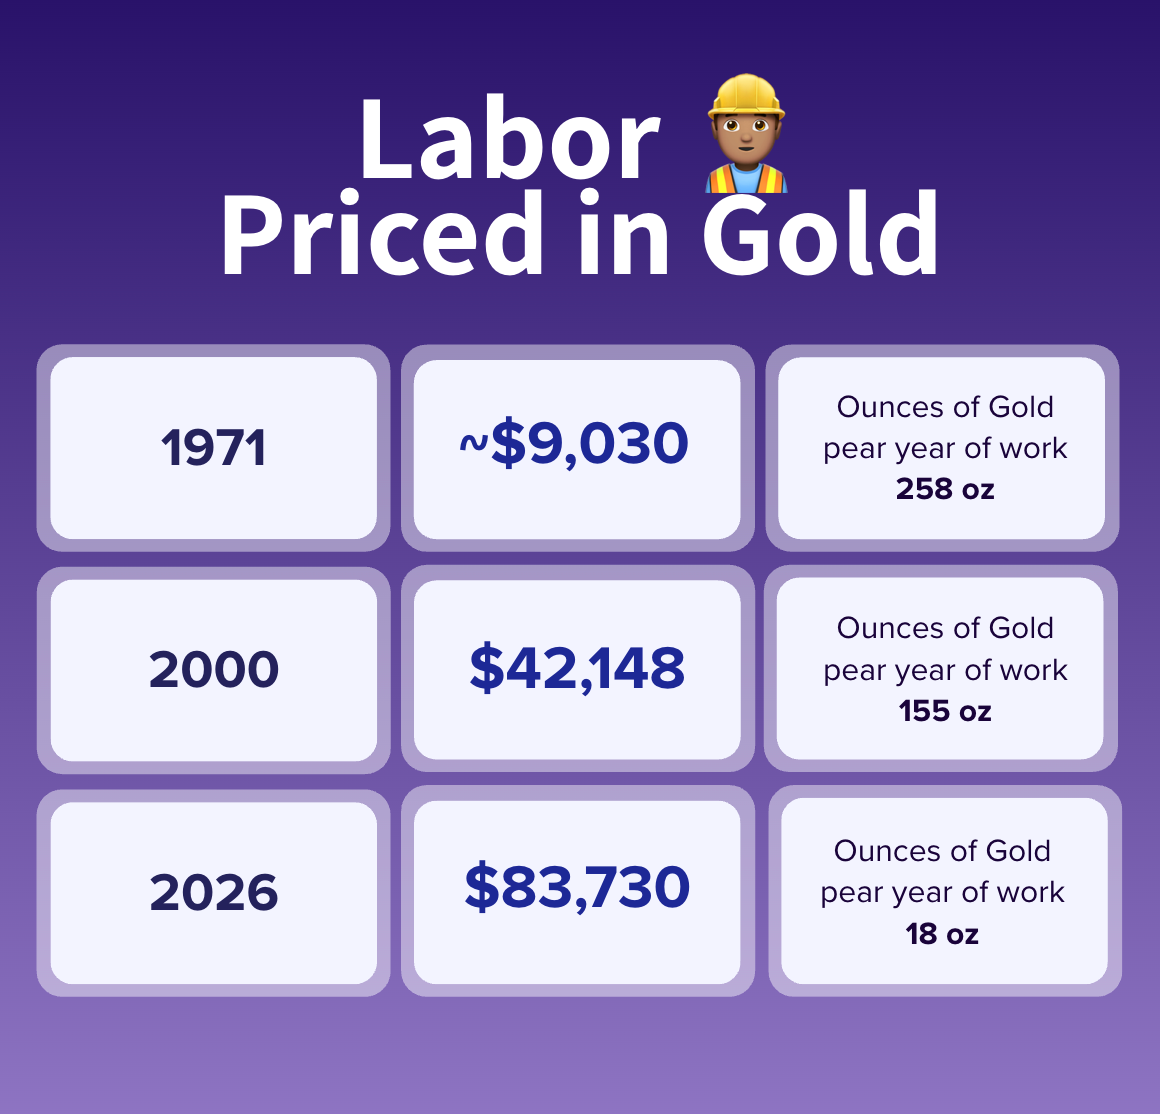
In 1971, the median American household earned about $9,030. At $35 an ounce, that bought 258 ounces of Gold.
Put those ounces away and forget about them. Today, they are worth roughly $1.18 million.
The current median US household income is about $83,730. So those same 258 ounces now equal more than 14 years of median household income.
One year of work in 1971, stored in Gold, became fourteen years of work in 2026.
Now compare that to cash.
The neighbor who kept the same $9,030 in dollars still has $9,030. Today, that barely covers a few weeks of median household expenses.
Same paycheck. Same year of labor - but completely different outcome.
And the pattern did not stop in the 1970s.
In 2000, the median household earned $42,148. That bought roughly 155 ounces of Gold.
Today, those ounces are worth around $710,000. About 8.5 years of current median income.
Again, one year of labor became nearly a decade of future labor.
This is not really a story about inflation, but rather about stored work.
Some households stored their labor in an asset that preserved purchasing power.
The dollar holders paid for the same year twice. Once when they earned it, once when they tried to spend what was left of it 30 years later.
So, now what?
If all of your savings sit in dollars, whether that's a checking account, a money market fund, a bond ladder, or cash under the mattress, what happened from 1971 to 2026 is what's going to happen from here.
The 99% loss of purchasing power from 1971 to 2026 isn't going to stop at 99% because the mechanism that produced years of devaluation is still running.
The Fed's 2% inflation target hasn't changed (and they haven’t hit it for years).
The $39 trillion debt isn't getting smaller. It just funded another war, and it’s still climbing. And the political incentive to inflate that debt away is stronger today than it was in 1971, not weaker.
So the question left isn’t whether the dollar will keep losing ground against real assets. The question is which side of that trade you want to be on.
The numbers above tell you what each side has cost, measured in cars, houses, burgers, semesters, and years of your own life.
I trade Gold professionally. I hold physical Gold. I’m obviously biased.
But the numbers in this piece aren’t mine. They’re published by the US Census Bureau, the Federal Reserve, the BLS, the NAR, and Kelley Blue Book. I didn’t make them up. I just put them in the same place.
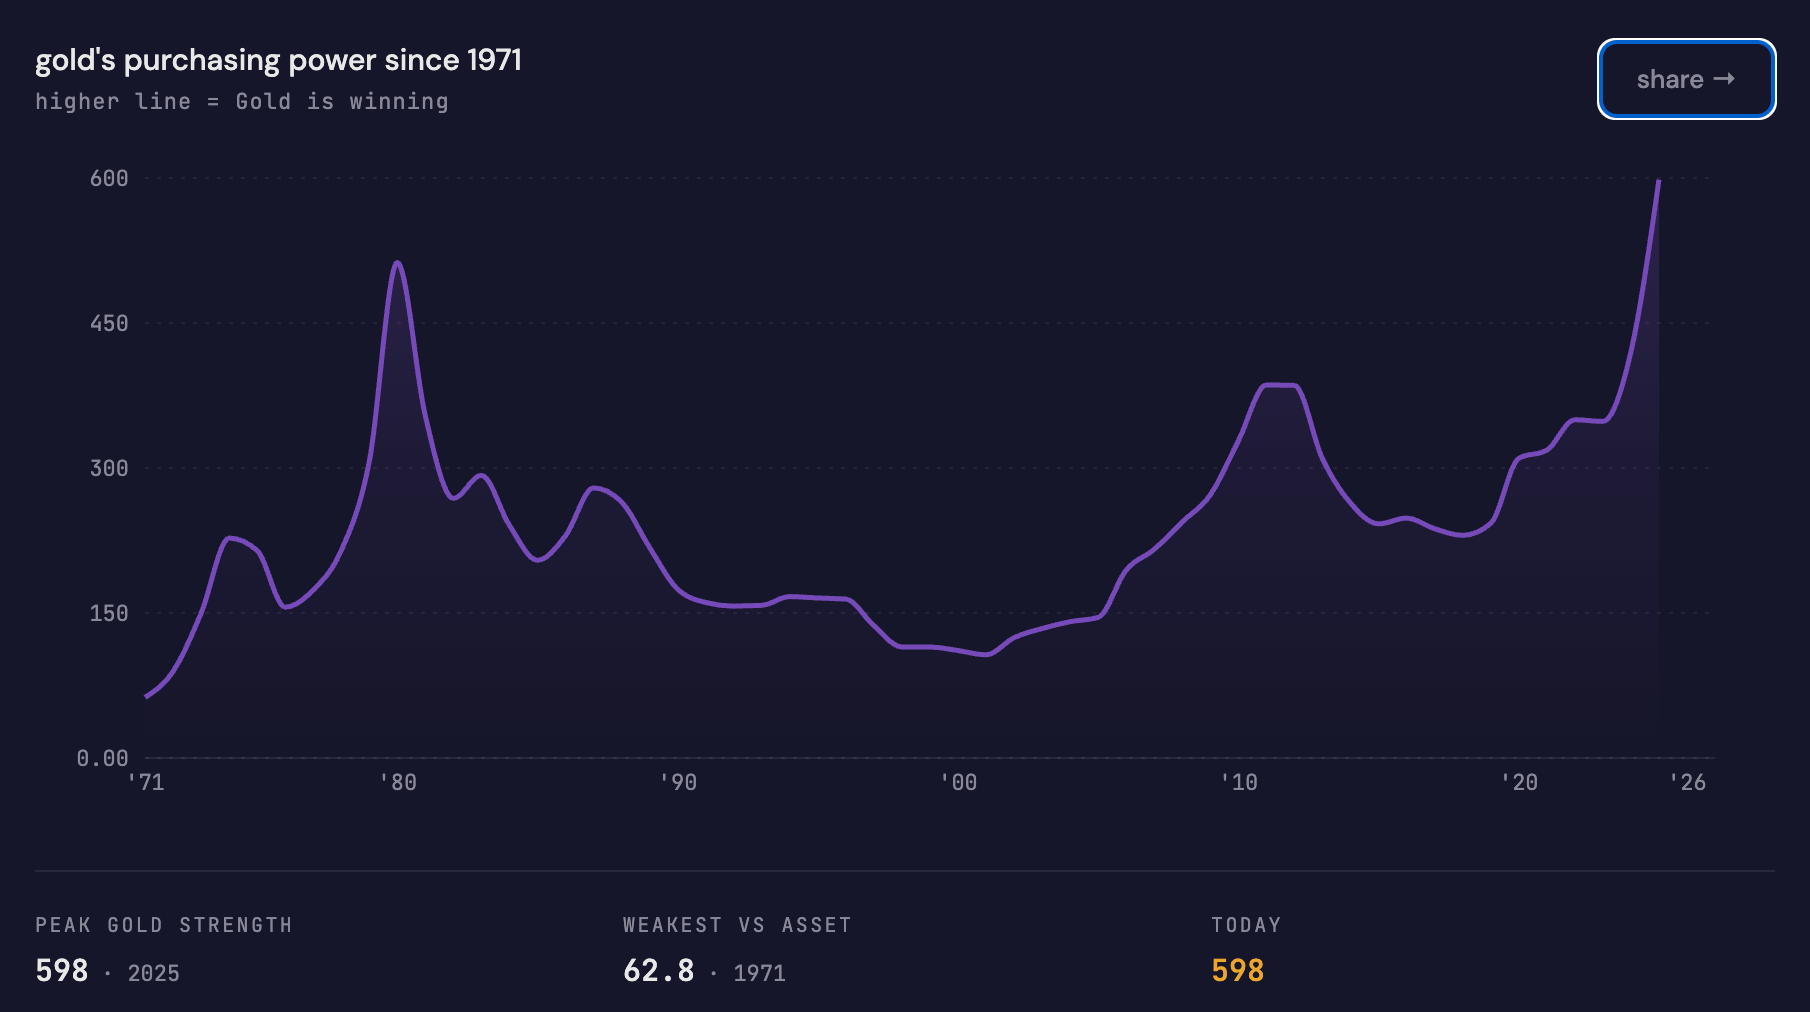
See it for yourself
The Gold vs Everything chart below plots how the price has moved year by year across the same assets I walked through above: cars, houses, burgers, and more. Click between them and find a result weird enough to send to the relative who told you Gold was a barbarous relic.
Safe trading,
and remember: All that glitters is not Gold,
Joe