


Gold under pressure: why $2,650 level is crucial for bulls [Weekly XAU/USD analysis + forecast]


Hello, fellow traders!
Gold started the trading week quietly with markets waiting for the Fed's rate decision. A strong retail sales report raised doubts about more rate cuts, and when the Fed trimmed rates by 0.25% but hinted at fewer cuts in 2025, the dollar strengthened, pushing Gold to a four-week low on Wednesday.
A potential U.S. government shutdown gave gold a brief safe-haven boost, but it still ended the week losing over 1%. The precious metal managed to hold above $2,600, leaving everyone on edge for what comes next in this shortened holiday week.
In this week’s update, I’ll:
Decode the technicals: pinpoint the hidden technical clues that could signal a sudden breakout—or a ruthless selloff.
Unpack the global data: highlight the global economic numbers making waves and where they could push Gold’s price in the mid term.
Identify strategic “make-or-break” price zones
Spot the sentiment shifts: what’s brewing beneath the surface and why this matters for Gold’s future direction.
Predict what’s next for Gold: give away my short-term and mid-term calls for where XAU/USD is headed.


📊 Let’s look at the technical data
Last 6 months - 2h charts
Key takeaway:
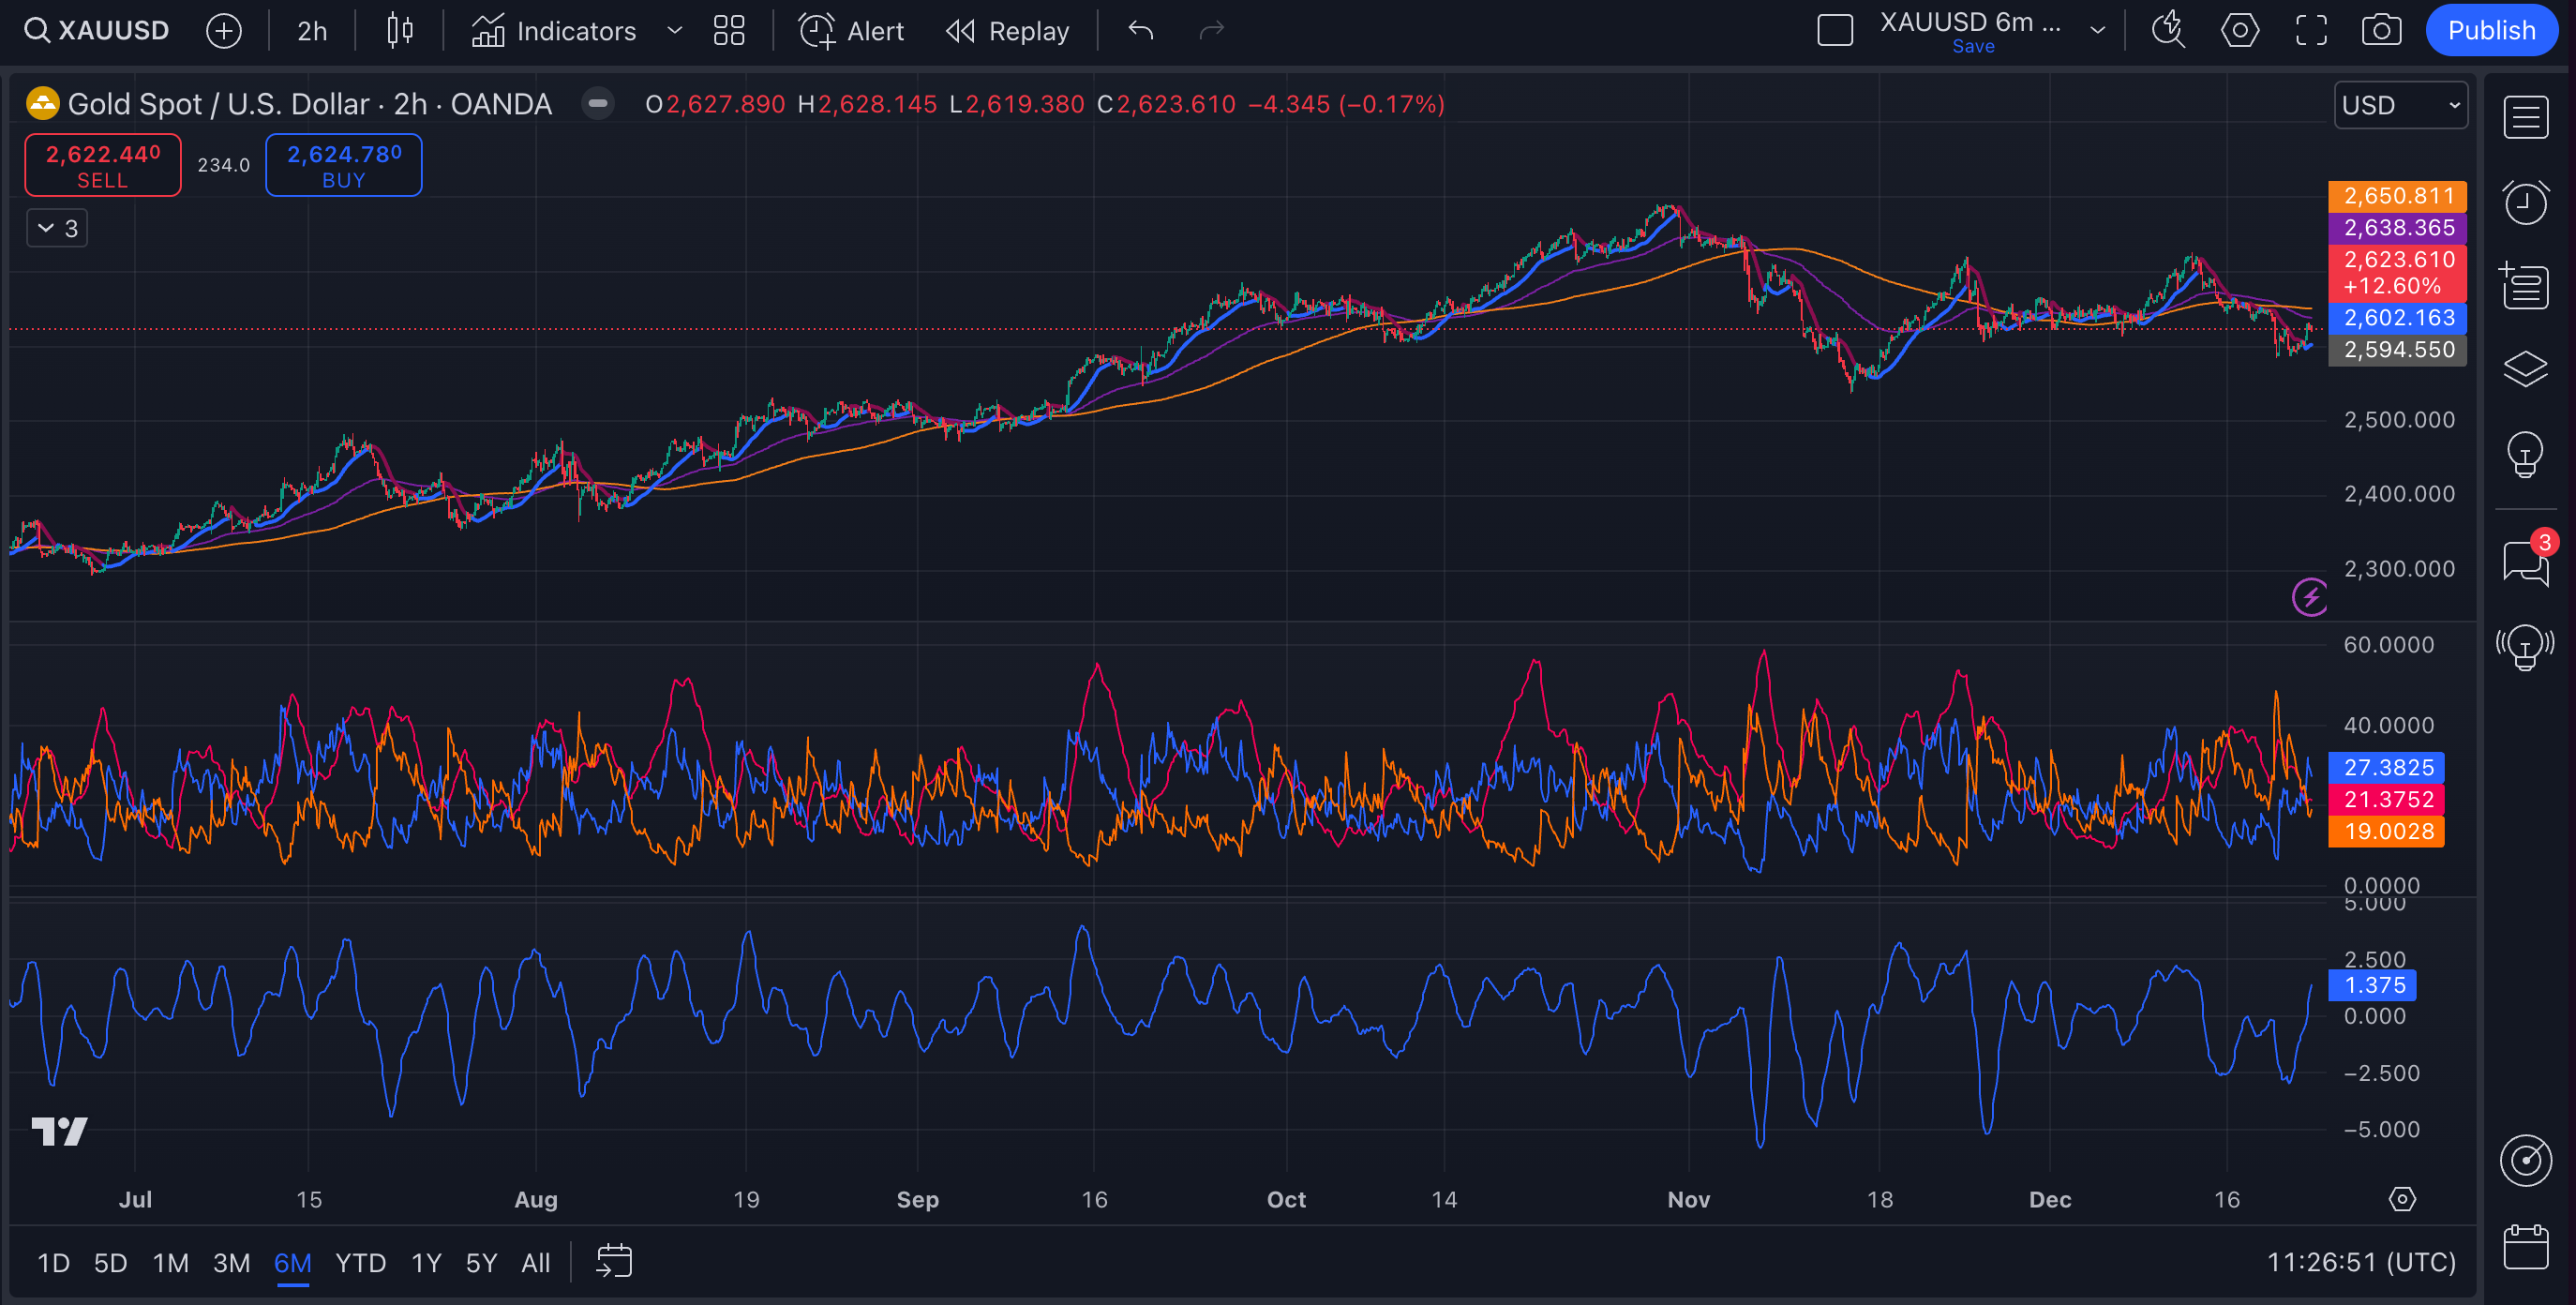
Short-term signals and patterns show Gold is a bit overheated and might be heading for a pullback.
Watching 2,650 - SMA 200 is key. Bulls need to push above this level to regain control. Until then, the bias leans bearish in the short to medium term.
If not, we could see deeper retracements toward 2,600 or even ~2,540 on a sharper pullback.
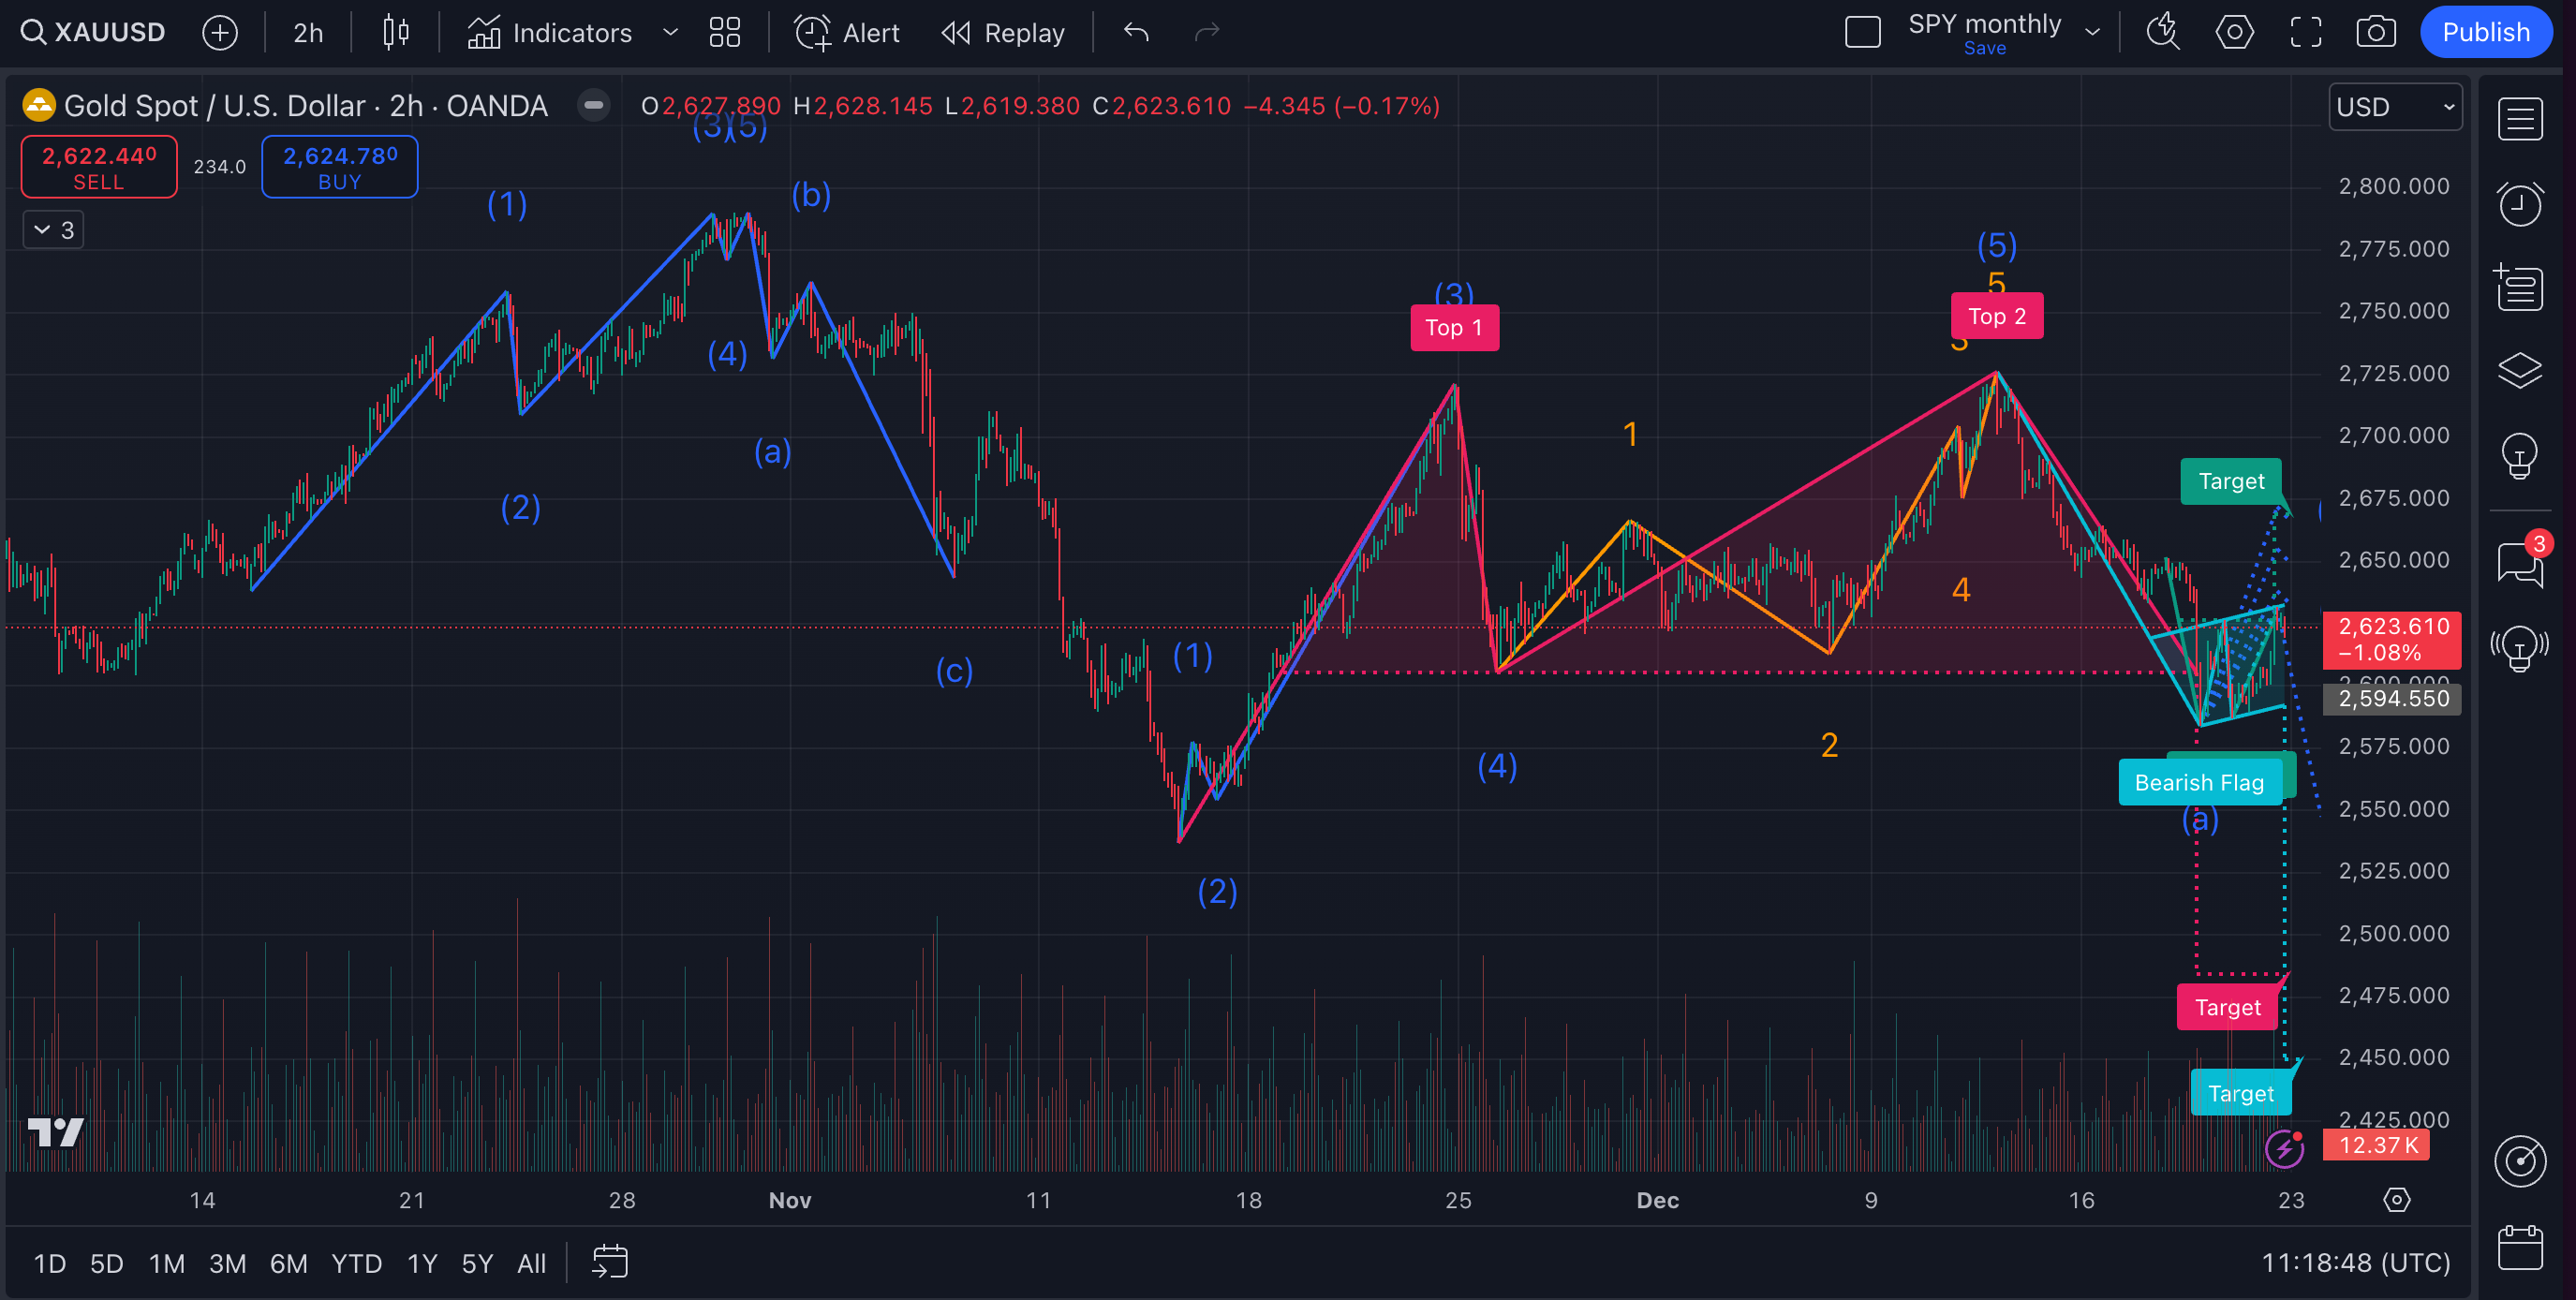
Corrective phase: Gold seems to be in a corrective phase after completing a full 5-wave cycle.
Watch for support at 2,594 (0.618 Fibonacci retracement of the last wave and ~2,540 if the corrective phase intensifies.
Overbought warning: High MFI, a bearish flag and double top patterns suggest Gold might dip before another leg up.
Possible downside targets and potential support levels: 2,594, 2,540, 2,485, 2,450.
Mixed signals in volume & power: OBV is strong, but Balance of Power is negative. DMI also signals the momentum is currently shifting towards the bears. This conflict could mean we get a choppy consolidation soon.
Strong resistance: SMA 200 (~2,650) is acting as a strong resistance level. Gold attempted to break above it recently but failed. If price can break and hold it, the medium-term uptrend will resume.
Last 3 months - 1h charts
Key takeaway:
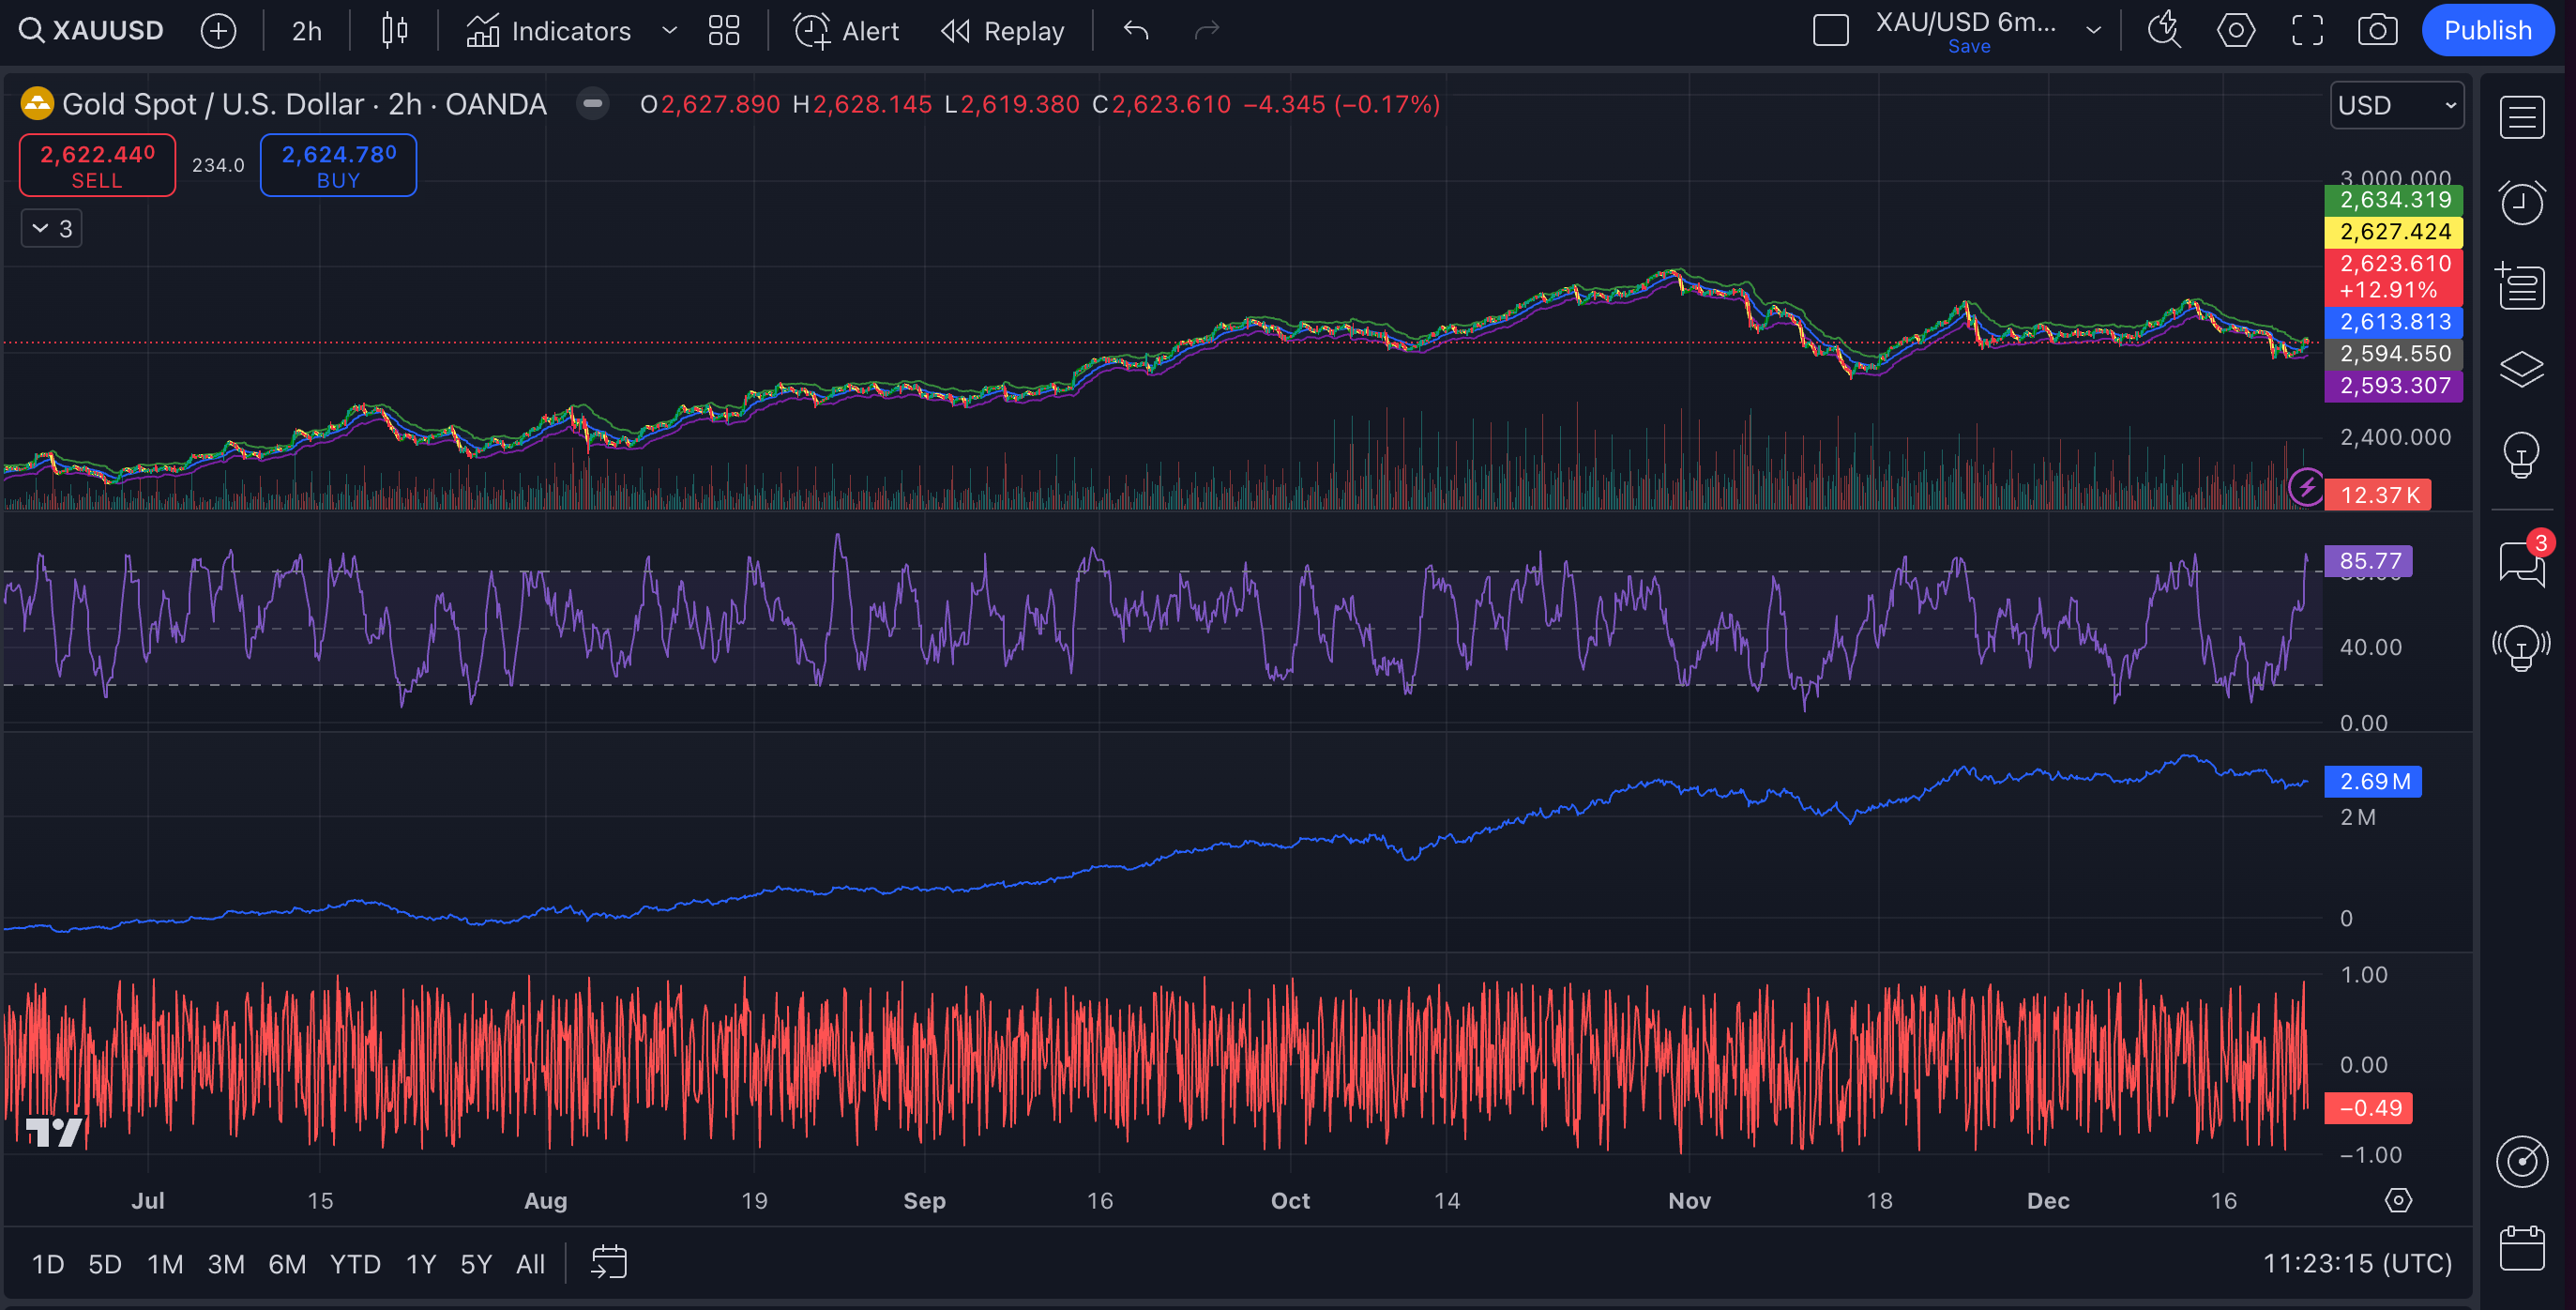
Short-term sentiment is cautiously bullish but overextended. Most indicators suggest that Gold might see a slight push higher before hitting resistance or consolidating.
To invalidate the bearish flag from the long-term chart and start a new uptrend, bulls need a clean breakout above
Keep reading with a 7-day free trial
Subscribe to The Gold Trader to keep reading this post and get 7 days of free access to the full post archives.