Gold surges to record highs: What’s next after $2,580? In-depth analysis of XAU/USD + weekly price action forecast
Hello, fellow traders!
This week Gold surged past $2,580, reaching a new record high as investors anticipated a rate cut from the Federal Reserve at the upcoming Sep 18 policy meeting.
Gold faces mixed risks going into the Fed meeting. A smaller 25 bps rate cut could strengthen the USD and cause a correction in Gold prices. However, if the Fed opts for a larger 50 bps cut, it could further weaken the dollar, allowing Gold to continue its rally.
Let’s break down the technical setup along with key economic events from this week that can give us important clues about future rate cuts and its impact on Gold prices.
In this week’s update, I’ll:
Analyze the latest technical indicators of XAU/USD and what they mean for potential future price action.
Highlight crucial support and resistance levels.
Break down this week’s key economic data and Gold buying trends from around the world and how it might affect XAU/USD in the mid term.
Explain the latest shift in the market sentiment as to the COT report and what it means for Gold's outlook.
Share my short-term and mid-term predictions on XAU/USD price action and trajectory.
📊 Let’s look at the technical data
Last 6 months - 2h charts
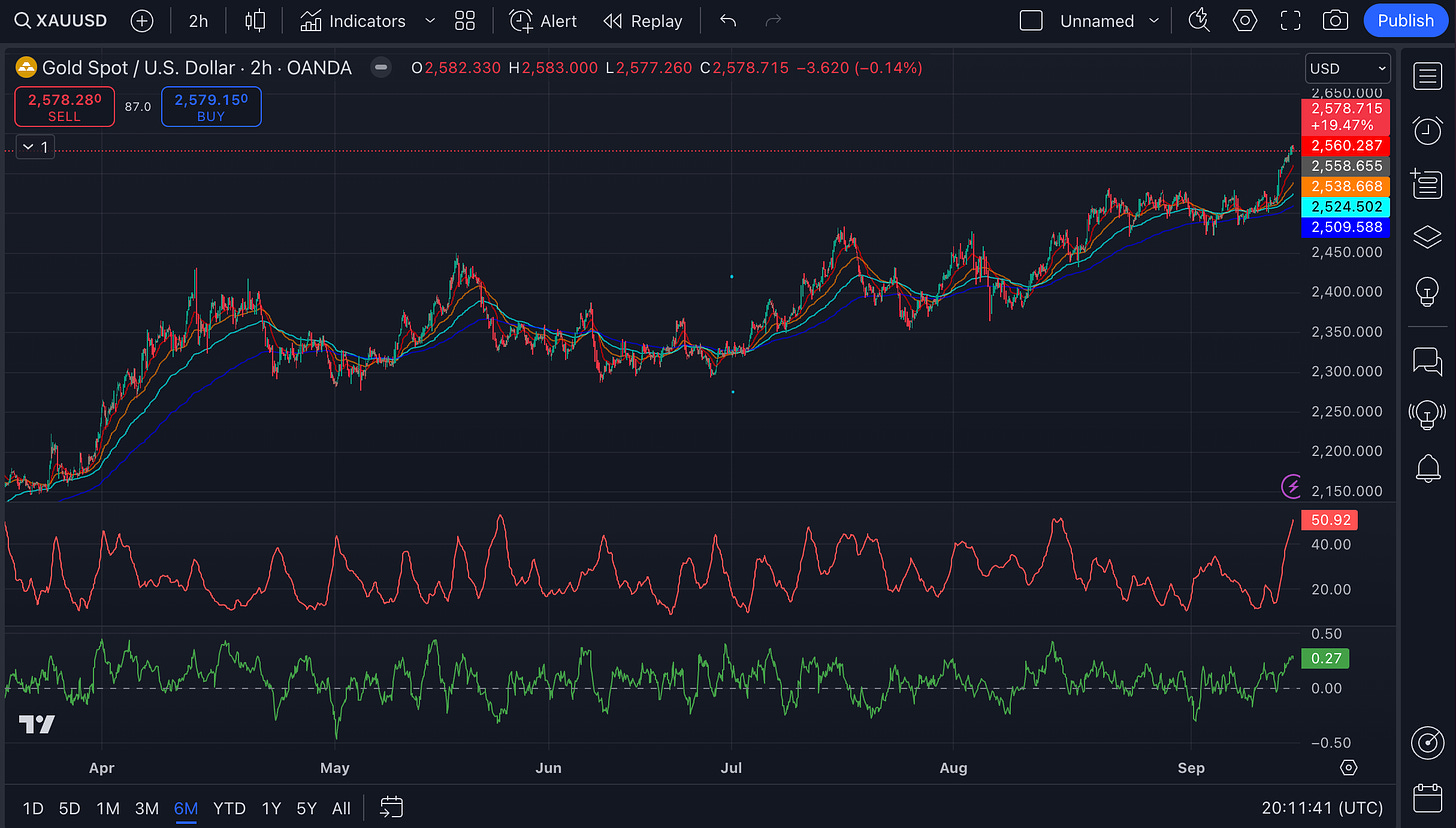
Over the last 6 months, the price has been in a clear uptrend, with some noticeable dips and corrections along the way.
The current price is around $2,578, very close to its recent high.
EMAs 20/50/100/200 are giving off a bullish signal. The price is above all the key moving averages, plus they're all stacked in order from fastest to slowest. That said, the price is getting a bit stretched above its moving averages. There's a chance we might see a pullback or consolidation soon, maybe back to test the 20-day EMA around 2,560 as support.
ADX shows the current upward movement is very strong. Gold’s recent rally could continue in the short term, however it might also mean the market is overextended and could lead to some consolidation or pullback soon.
The CMF shows there’s no significant selling pressure right now. Money is flowing into the asset, and this reinforces the current bullish sentiment.
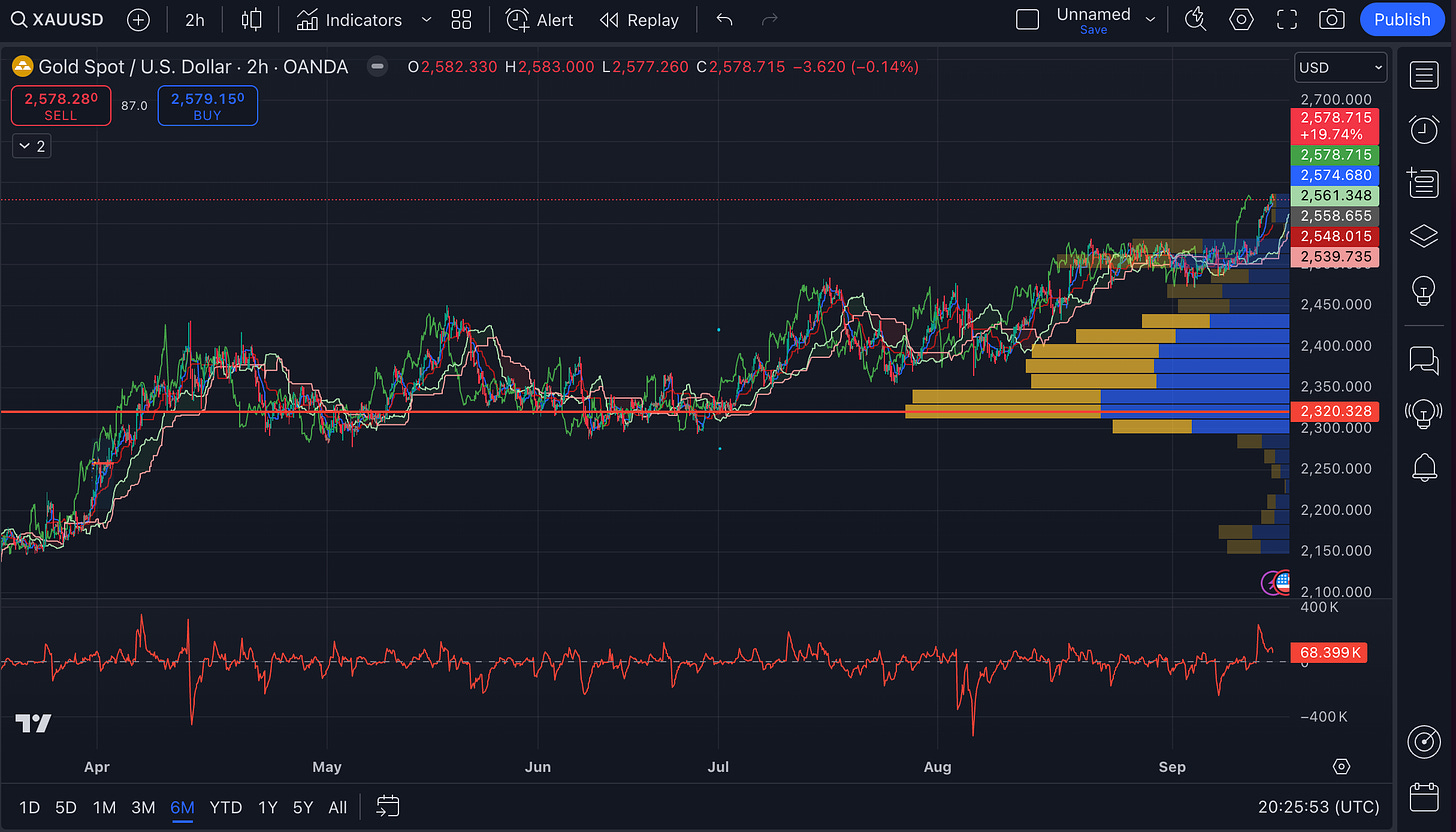
In the previous chart, we saw the the moving averages and the ADX show a strong uptrend, and here the Ichimoku Cloud and Volume Profile confirm that the trend has solid support beneath the current price.
The Point of Control (POC) is around $2,320. This is the level where the most volume occurred. If Gold corrects sharply, $2,320 is
Keep reading with a 7-day free trial
Subscribe to The Gold Trader to keep reading this post and get 7 days of free access to the full post archives.


