Hello, fellow traders!
Gold prices soared to a new all-time high above $2,700, despite the strength of the US Dollar. Investors appear to be reacting to the growing likelihood of global interest rate cuts.
At the start of the week, Gold moved sideways due to light trading during the Columbus Day holiday. However, by midweek, it began picking up momentum, fueled by a series of global developments.
In this week’s update, I’ll:
Look at the technical setup of XAU/USD and what it tells us about potential future price action.
Highlight the recent key support and resistance levels.
Break down this week’s key economic data from around the world (audio available!) and how it might affect XAU/USD in the mid term.
Explain the latest shift in the market sentiment as to the COT report and what it means for Gold's outlook.
Share my short-term and mid-term predictions on XAU/USD price action and trajectory.
📊 Let’s look at the technical data
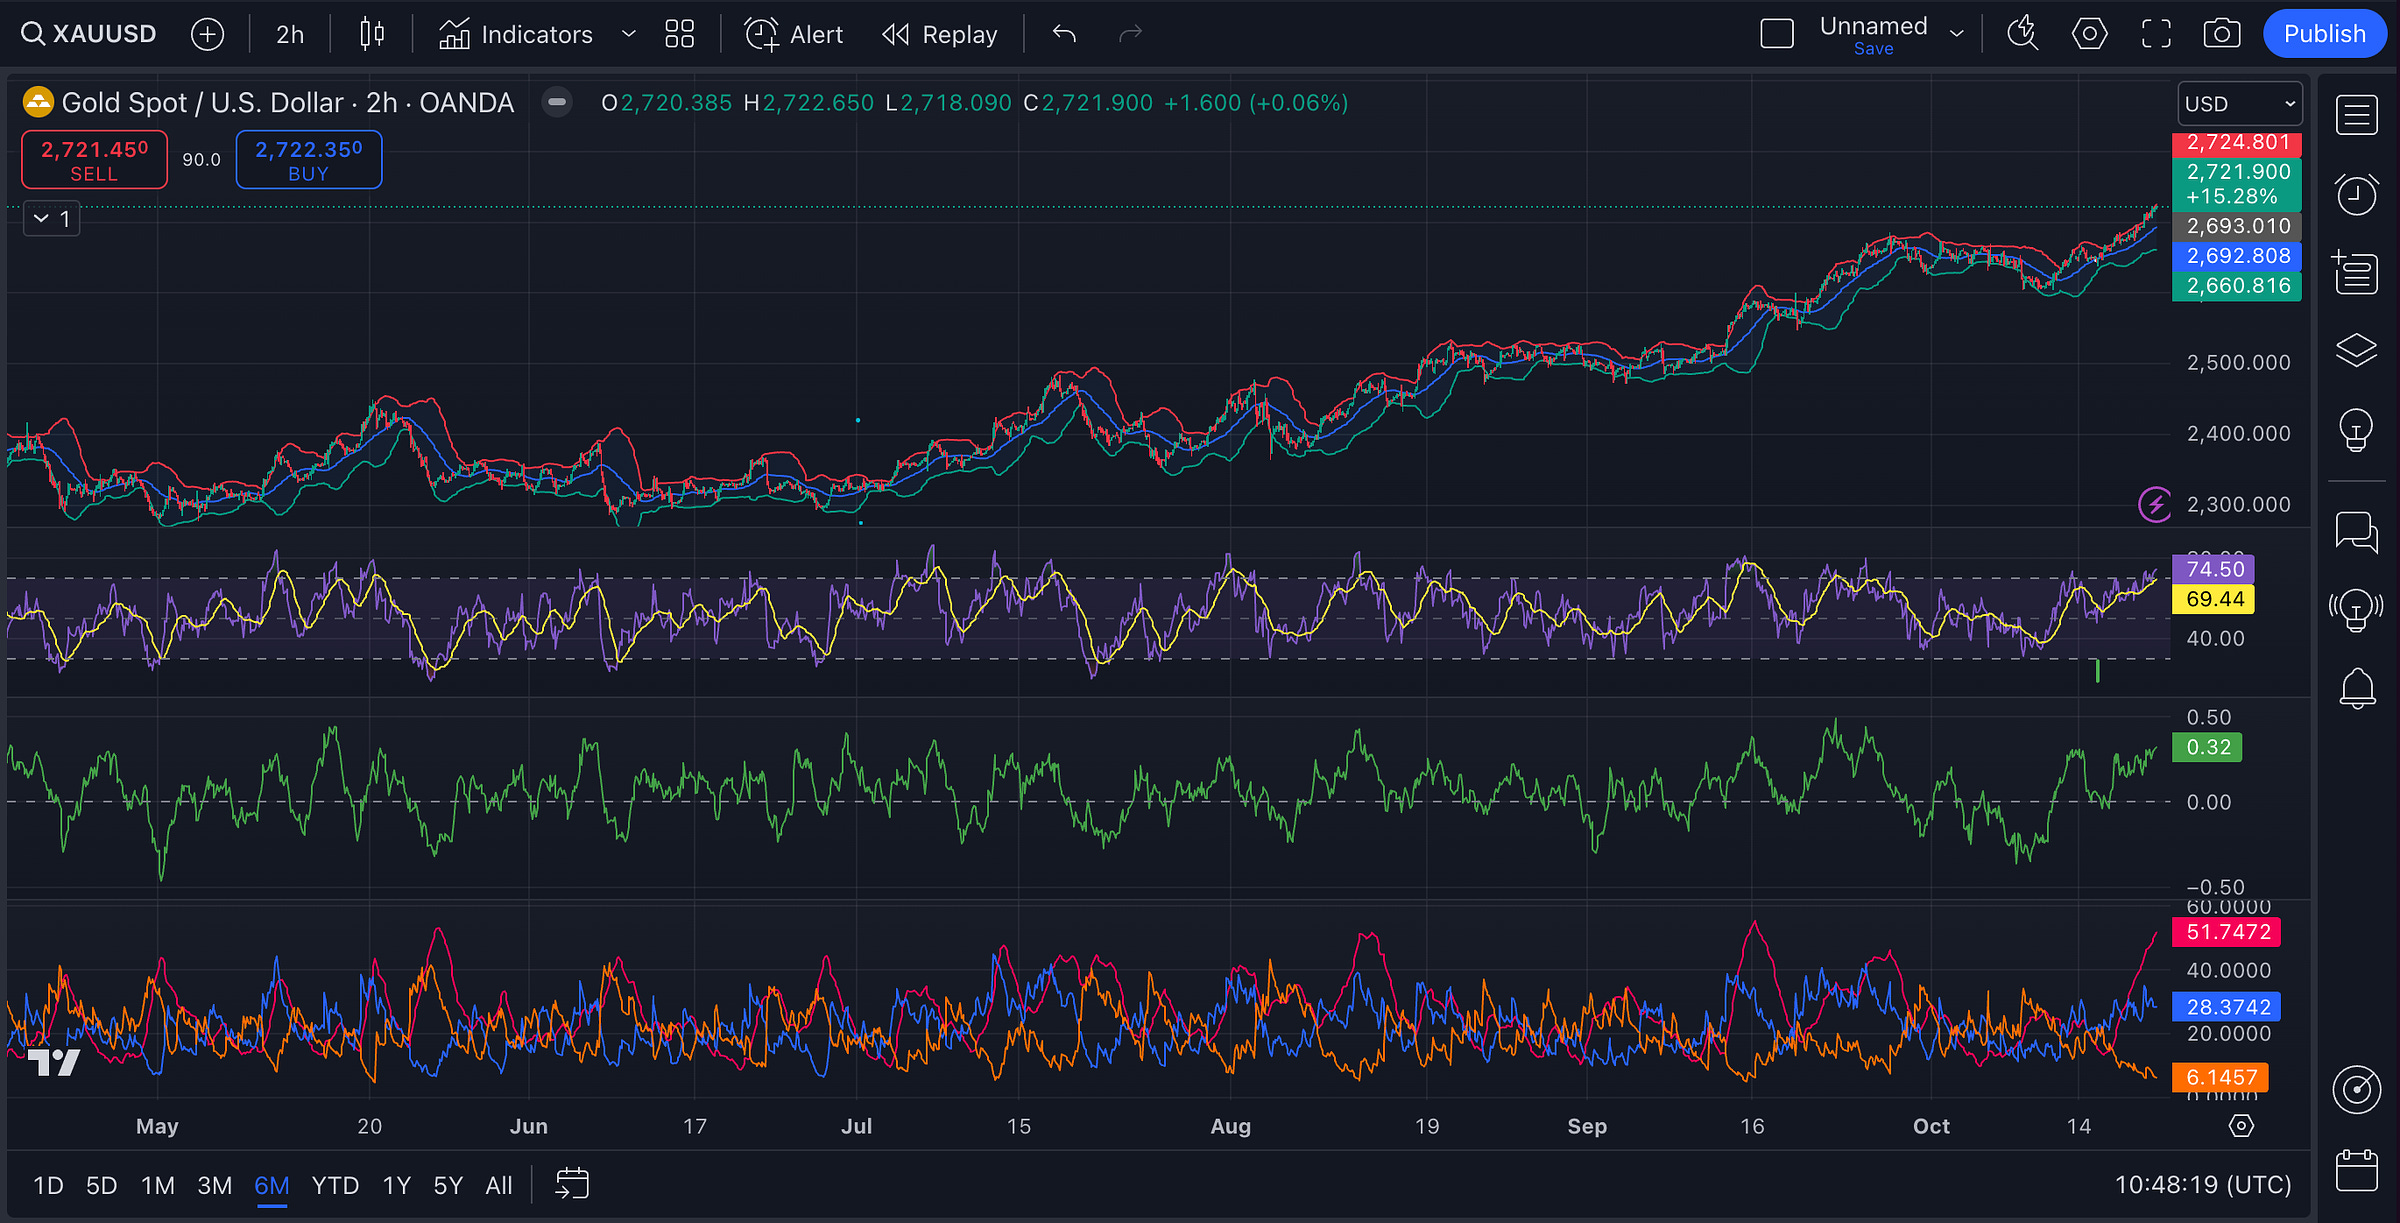
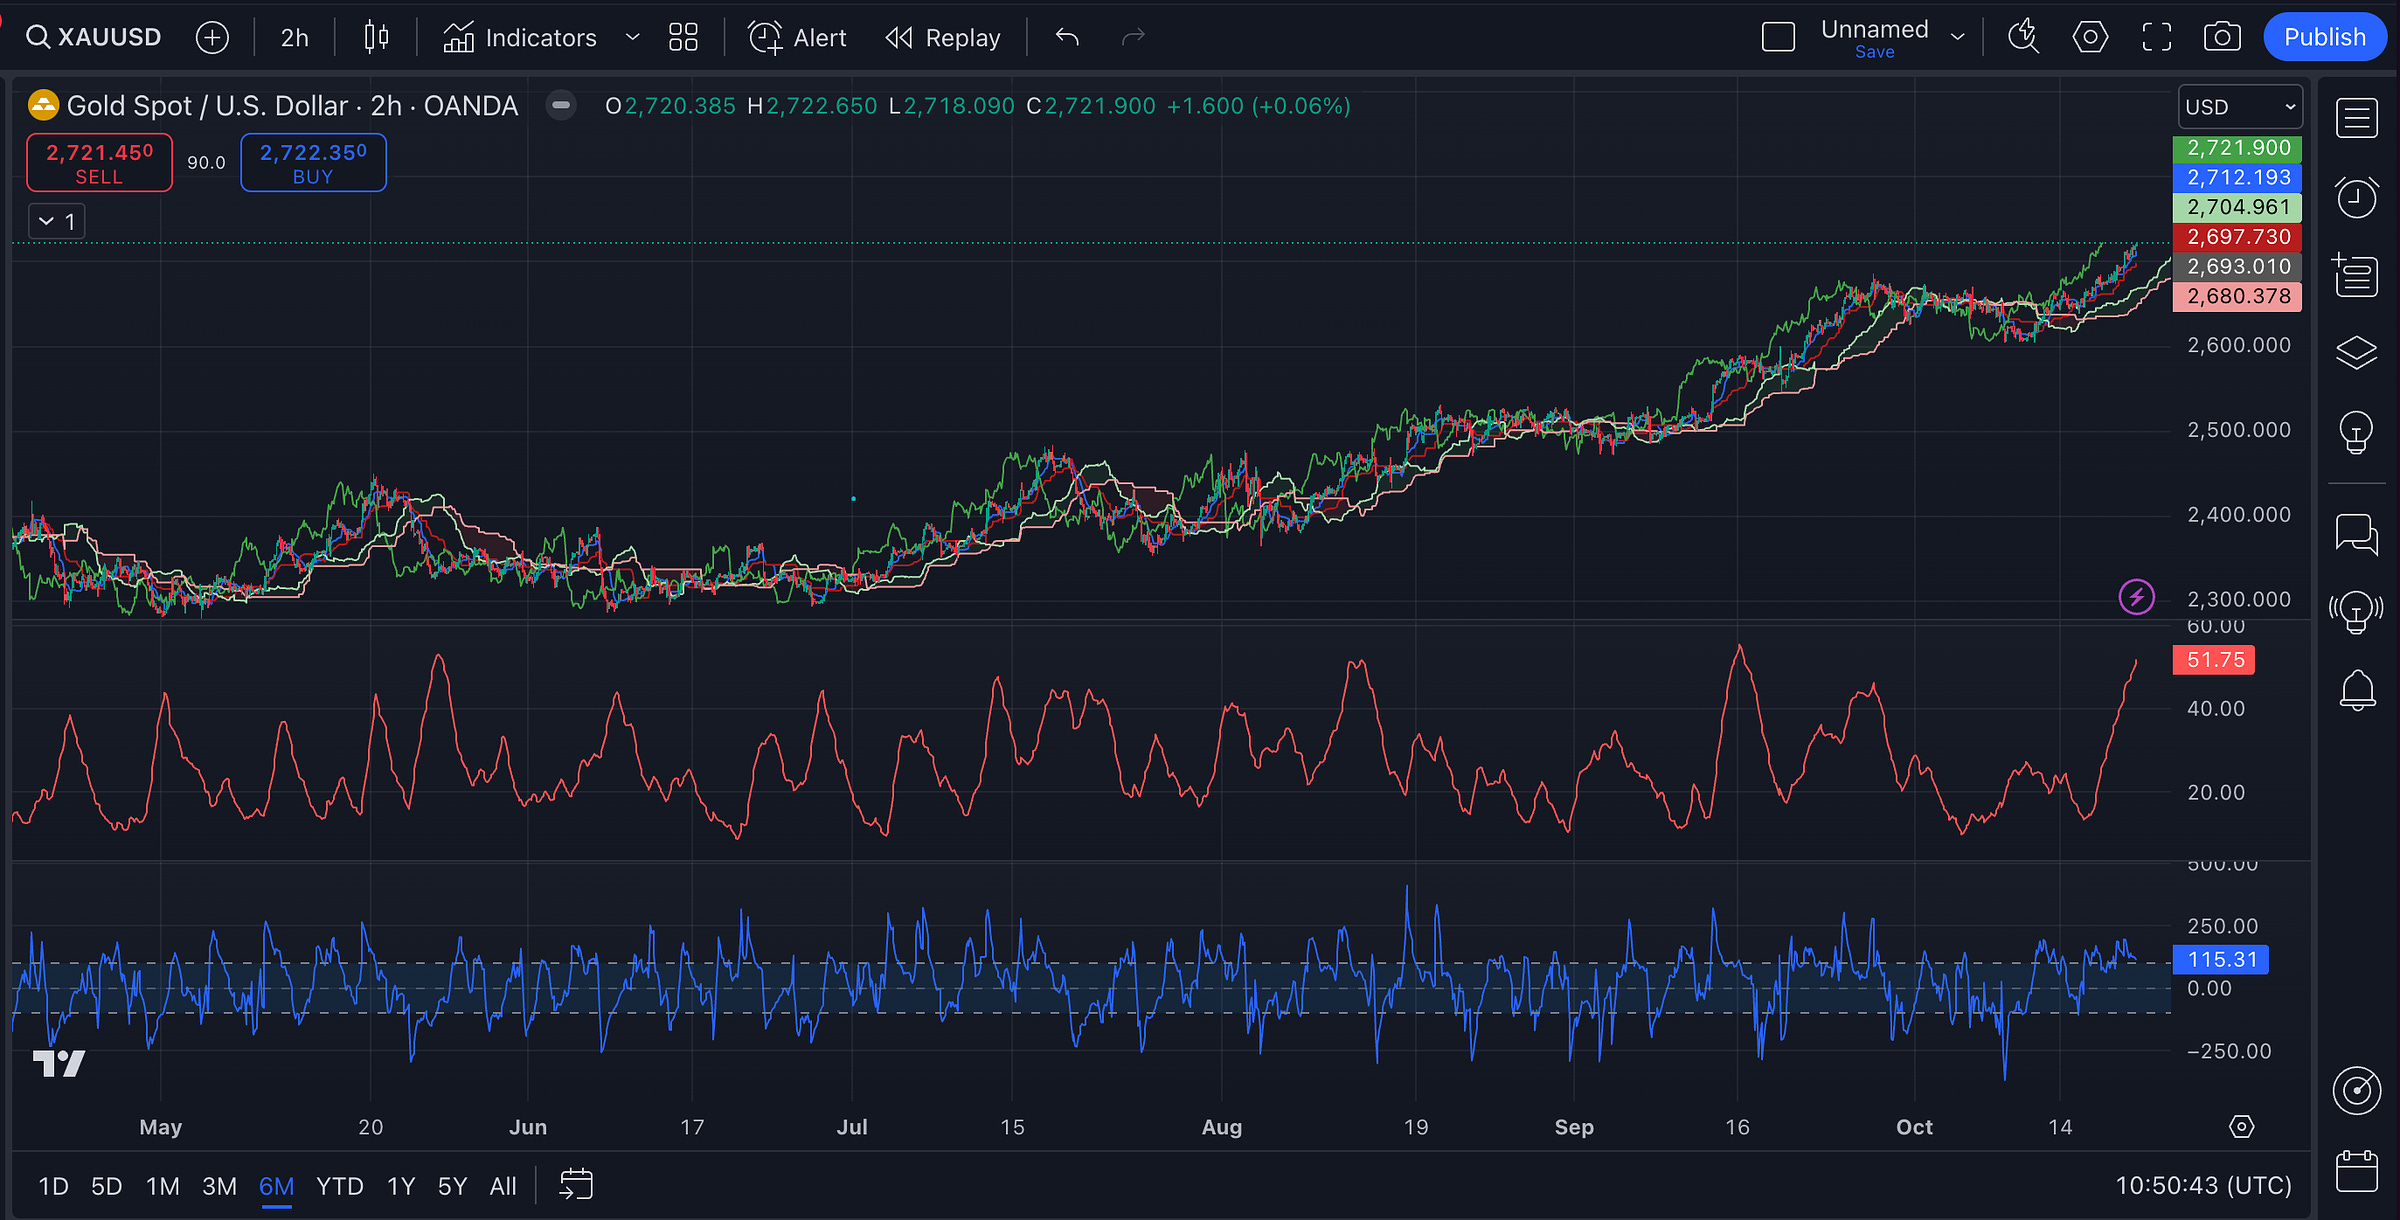
Last 6 months - 2h charts
Key takeaway:
Gold is still in a solid uptrend. While some indicators are signaling that it’s a bit overbought, the strength of the trend suggests that any corrections might be short-lived. The overall outlook for the mid-term remains positive.
If you’re already long on Gold, it might be a good time to ride the trend but watch for signs of a pullback (especially with overbought RSI and CCI).
If you’re looking to enter, be cautious about jumping in immediately. The trend is strong, but you might want to wait for a minor correction before entering.
Volatility will stay high, which means there’s potential for both quick gains and sharp pullbacks.
Bullish in the short to mid-term: Both 2h candlestick charts and their indicators suggest that Gold is still in a bullish phase. The Ichimoku cloud is showing strong support for the price, ADX indicates the uptrend is very strong. CMF confirms that buyers are coming into the market than sellers and shows money is flowing into Gold.
Overbought conditions: RSI and CCI are in overbought zones, which means there could be a short-term pullback, but nothing that suggests a major reversal. It's something to watch out for if you're looking to enter new positions.
Strong trend: ADX values and Ichimoku setup show that the current uptrend has real strength and could continue in the coming weeks.
Volatility ahead: With Bollinger Bands widening and the ADX rising, there’s more price movement expected. This could lead to both opportunities and risks, depending on how you position yourself.
Last 3 months - 1h charts
Key takeaway:
The uptrend is still intact but getting weaker. The indicators on 1-hour charts are flashing warning signs of a possible pullback in the short term.
For traders, the best move might be to
Keep reading with a 7-day free trial
Subscribe to The Gold Trader to keep reading this post and get 7 days of free access to the full post archives.


