Hello, fellow traders!
Gold prices were highly volatile this week, swinging between potential highs and lows due to tensions in the Middle East and strong U.S. job growth. By the end of the week, prices settled close to where they started.
The strong U.S. jobs data has sparked debate over the Fed's next move on interest rates. Some traders think the Fed may hold off on cutting rates, which could weigh on Gold. However, others believe that ongoing global conflicts, particularly in the Middle East, might continue to support Gold as a safe-haven asset.
In this week’s update, I’ll:
Look at the technical setup of XAU/USD and what it tells us about potential future price action.
Highlight the recent key support and resistance levels.
Break down this week’s key economic data from around the world (audio available!) and how it might affect XAU/USD in the mid term.
Explain the latest shift in the market sentiment as to the COT report and what it means for Gold's outlook.
Share my short-term and mid-term predictions on XAU/USD price action and trajectory.
📊 Let’s look at the technical data
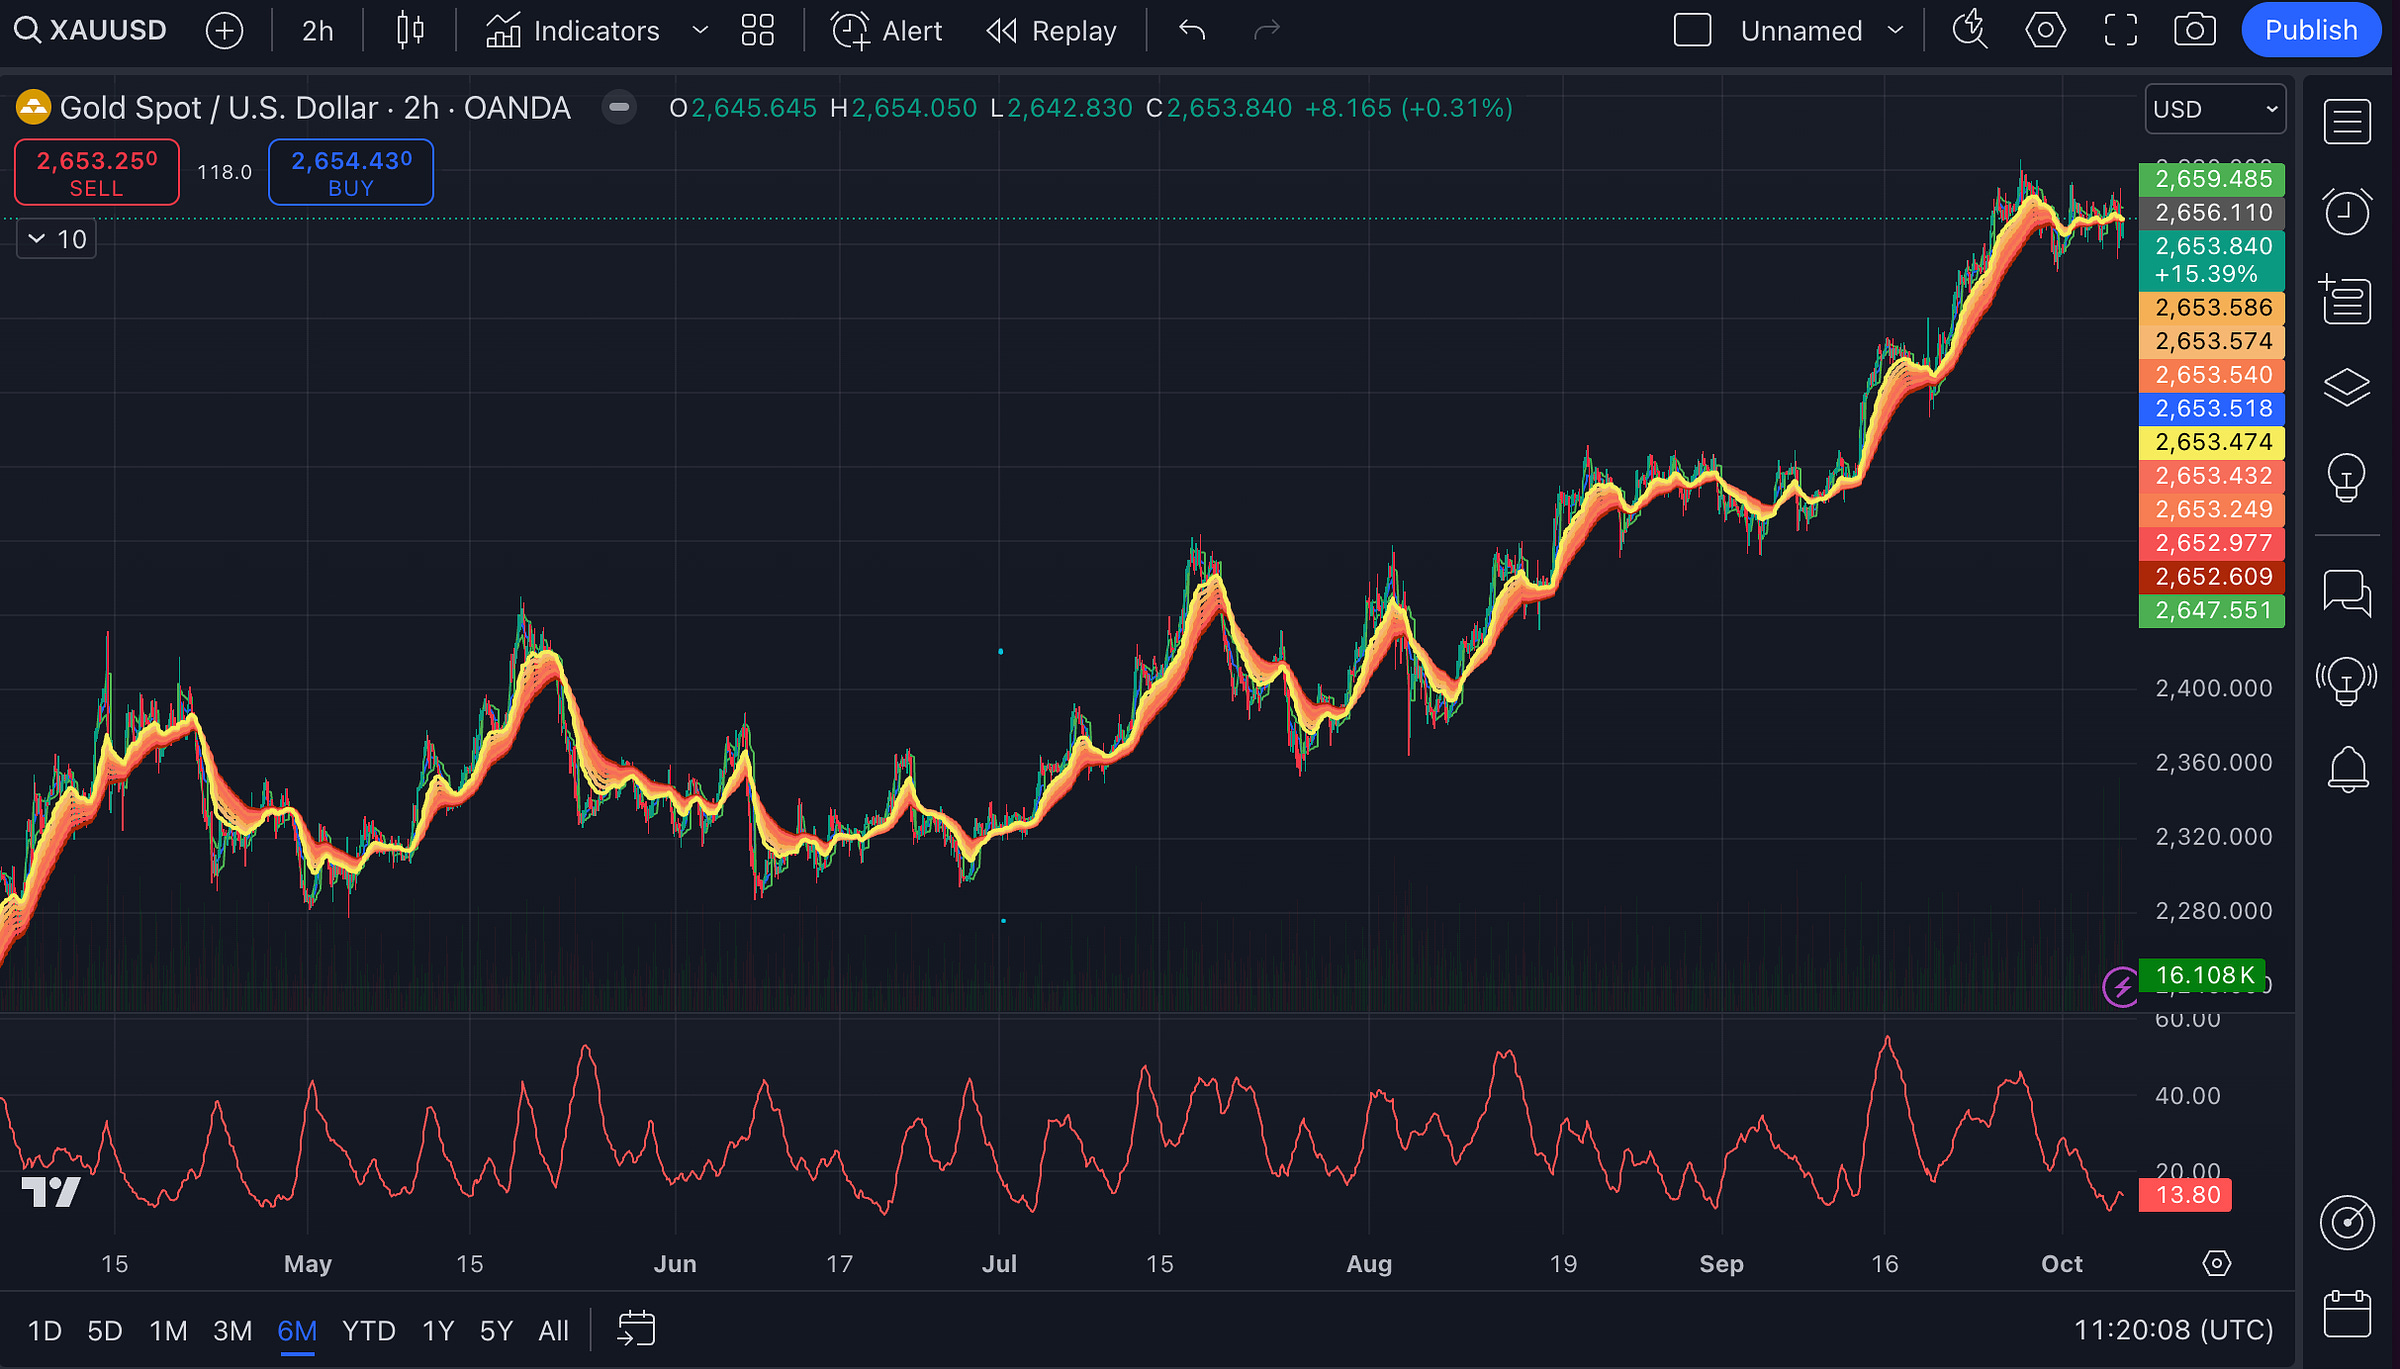
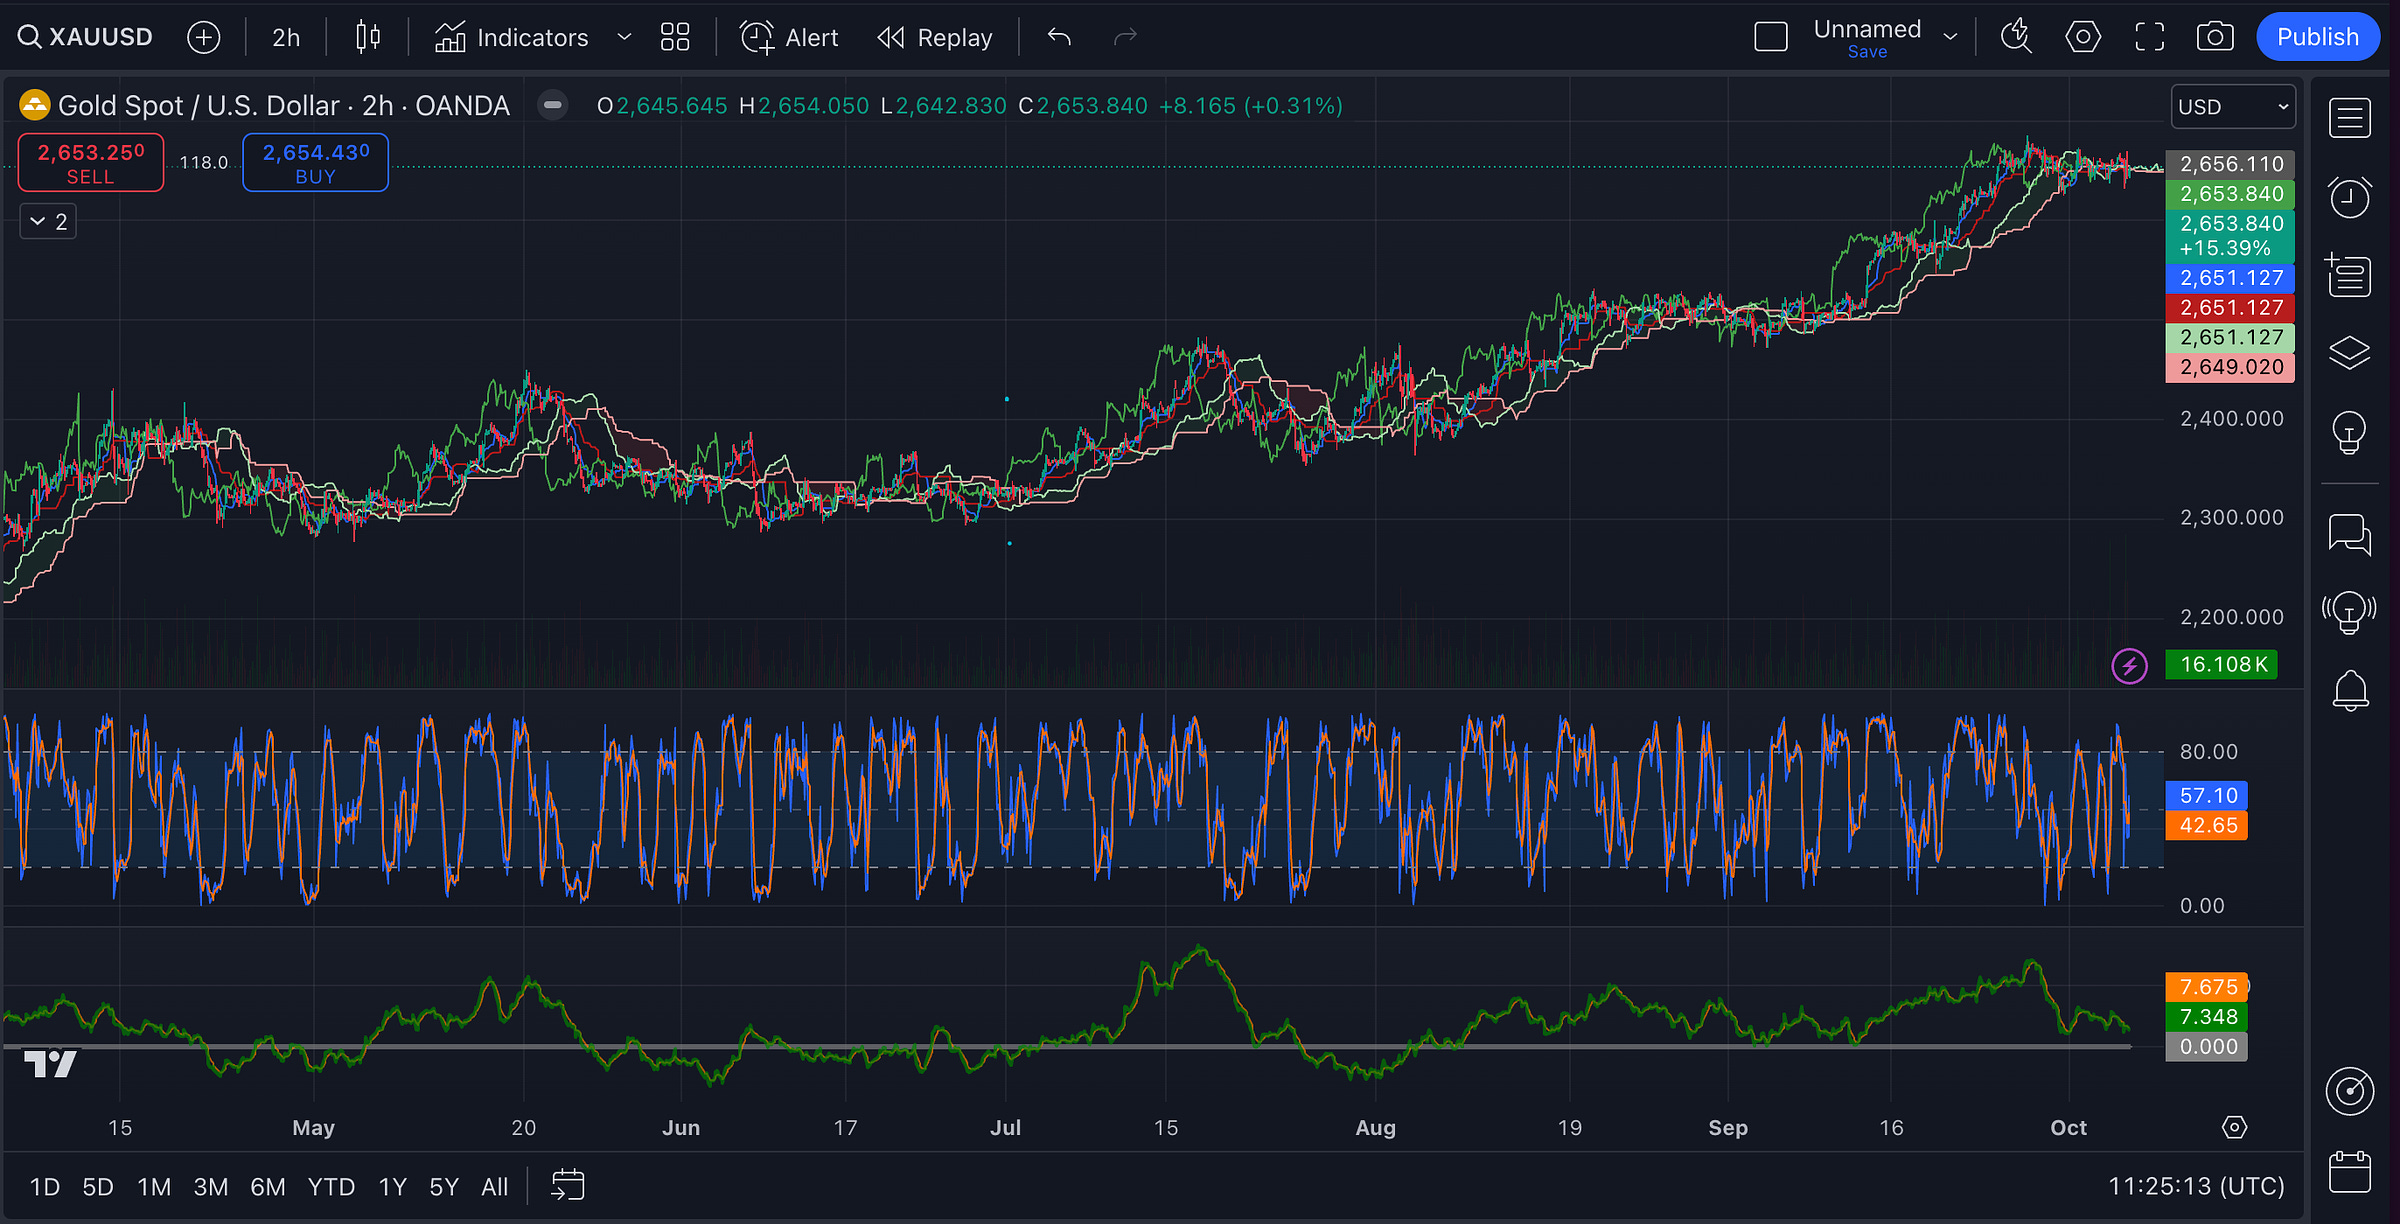
Last 6 months - 2h charts
Key takeaway:
The market is still bullish overall, but both charts show the market is consolidating. We’re not seeing strong momentum at the moment, but there’s no indication of a reversal either.
The EMAs are all lined up in ascending order, with the shorter period EMAs above the longer ones → typical of a bullish trend.
This clustering of EMAs around the current price level $2,653 means the market is consolidating a bit, or slowing down.
VWAP is pretty much in line with the current price, indicating that we’re near a fair value zone → buyers and sellers are relatively balanced.
The consolidation around the VWAP can often lead to a breakout. Given that we’re in a long-term uptrend, a breakout upwards is more likely, unless we see significant selling pressure.
The ADX shows weak trend strength, which aligns with the current consolidation.
Gold is well above the Ichimoku cloud → a strong bullish signal. Despite the consolidation, we are still in an upward trend.
The Kijun-Sen acts as a support, and as long as the price stays above it, the trend should remain bullish.
The cloud ahead is thin and slightly flat → the market is in a waiting phase, which aligns with ADX.
There is a slight downward slope in the Stochastic Oscillator, suggesting that we could see minor pullbacks, but nothing too significant.
The VFI value signals that buying pressure remains in the market.
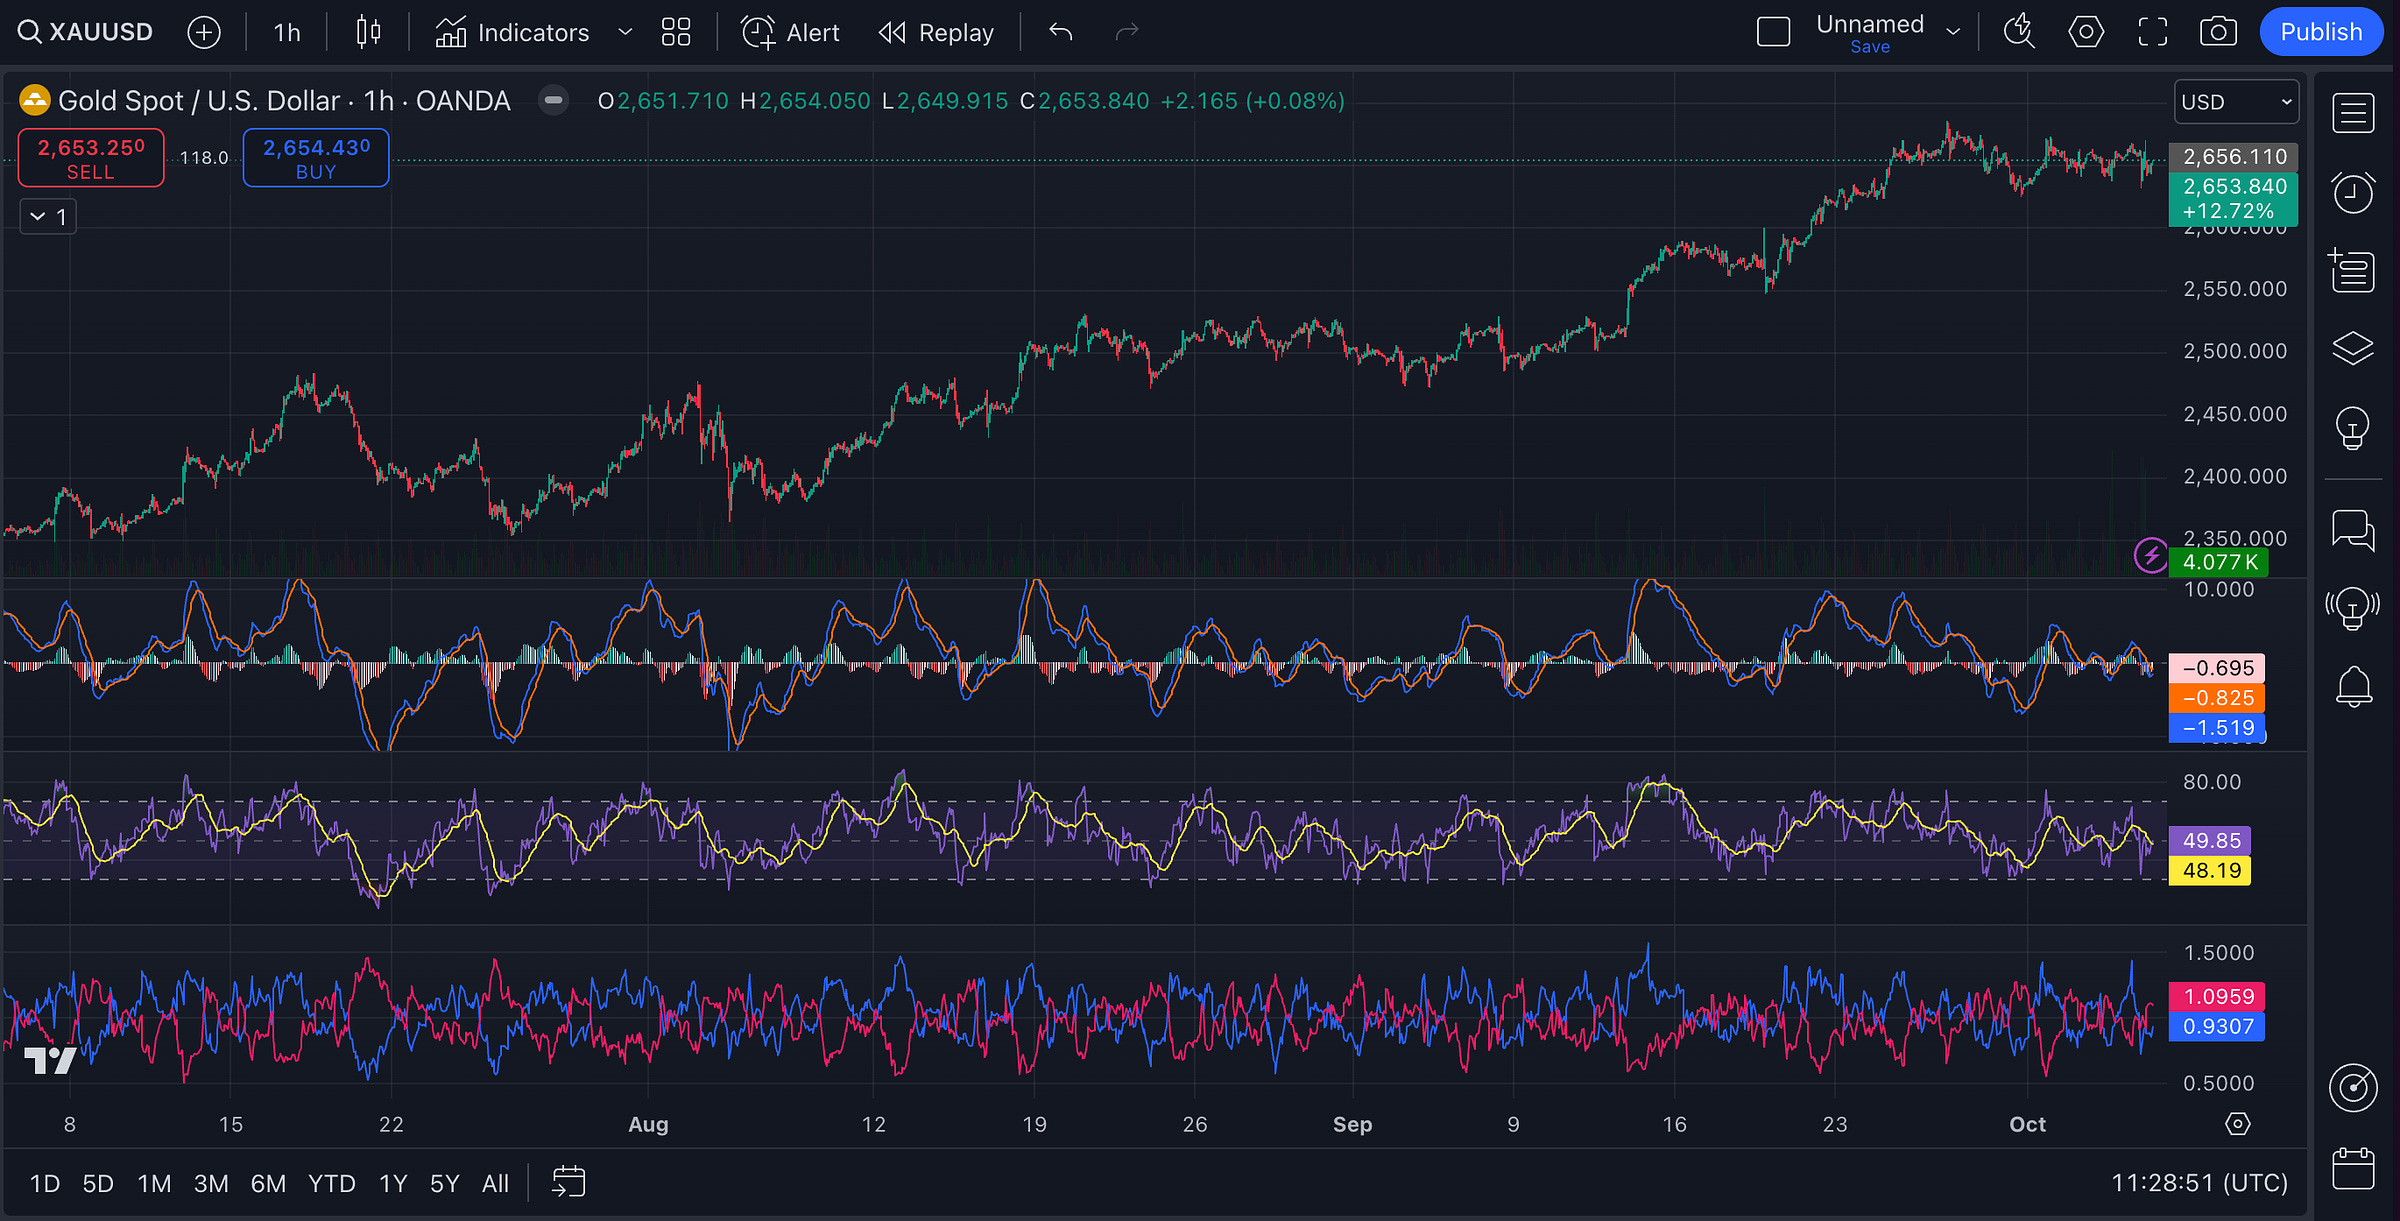
Last 3 months - 1h charts
Key takeaway:
The overall market is bullish, but the short-term indicators are showing weakness and consolidation.
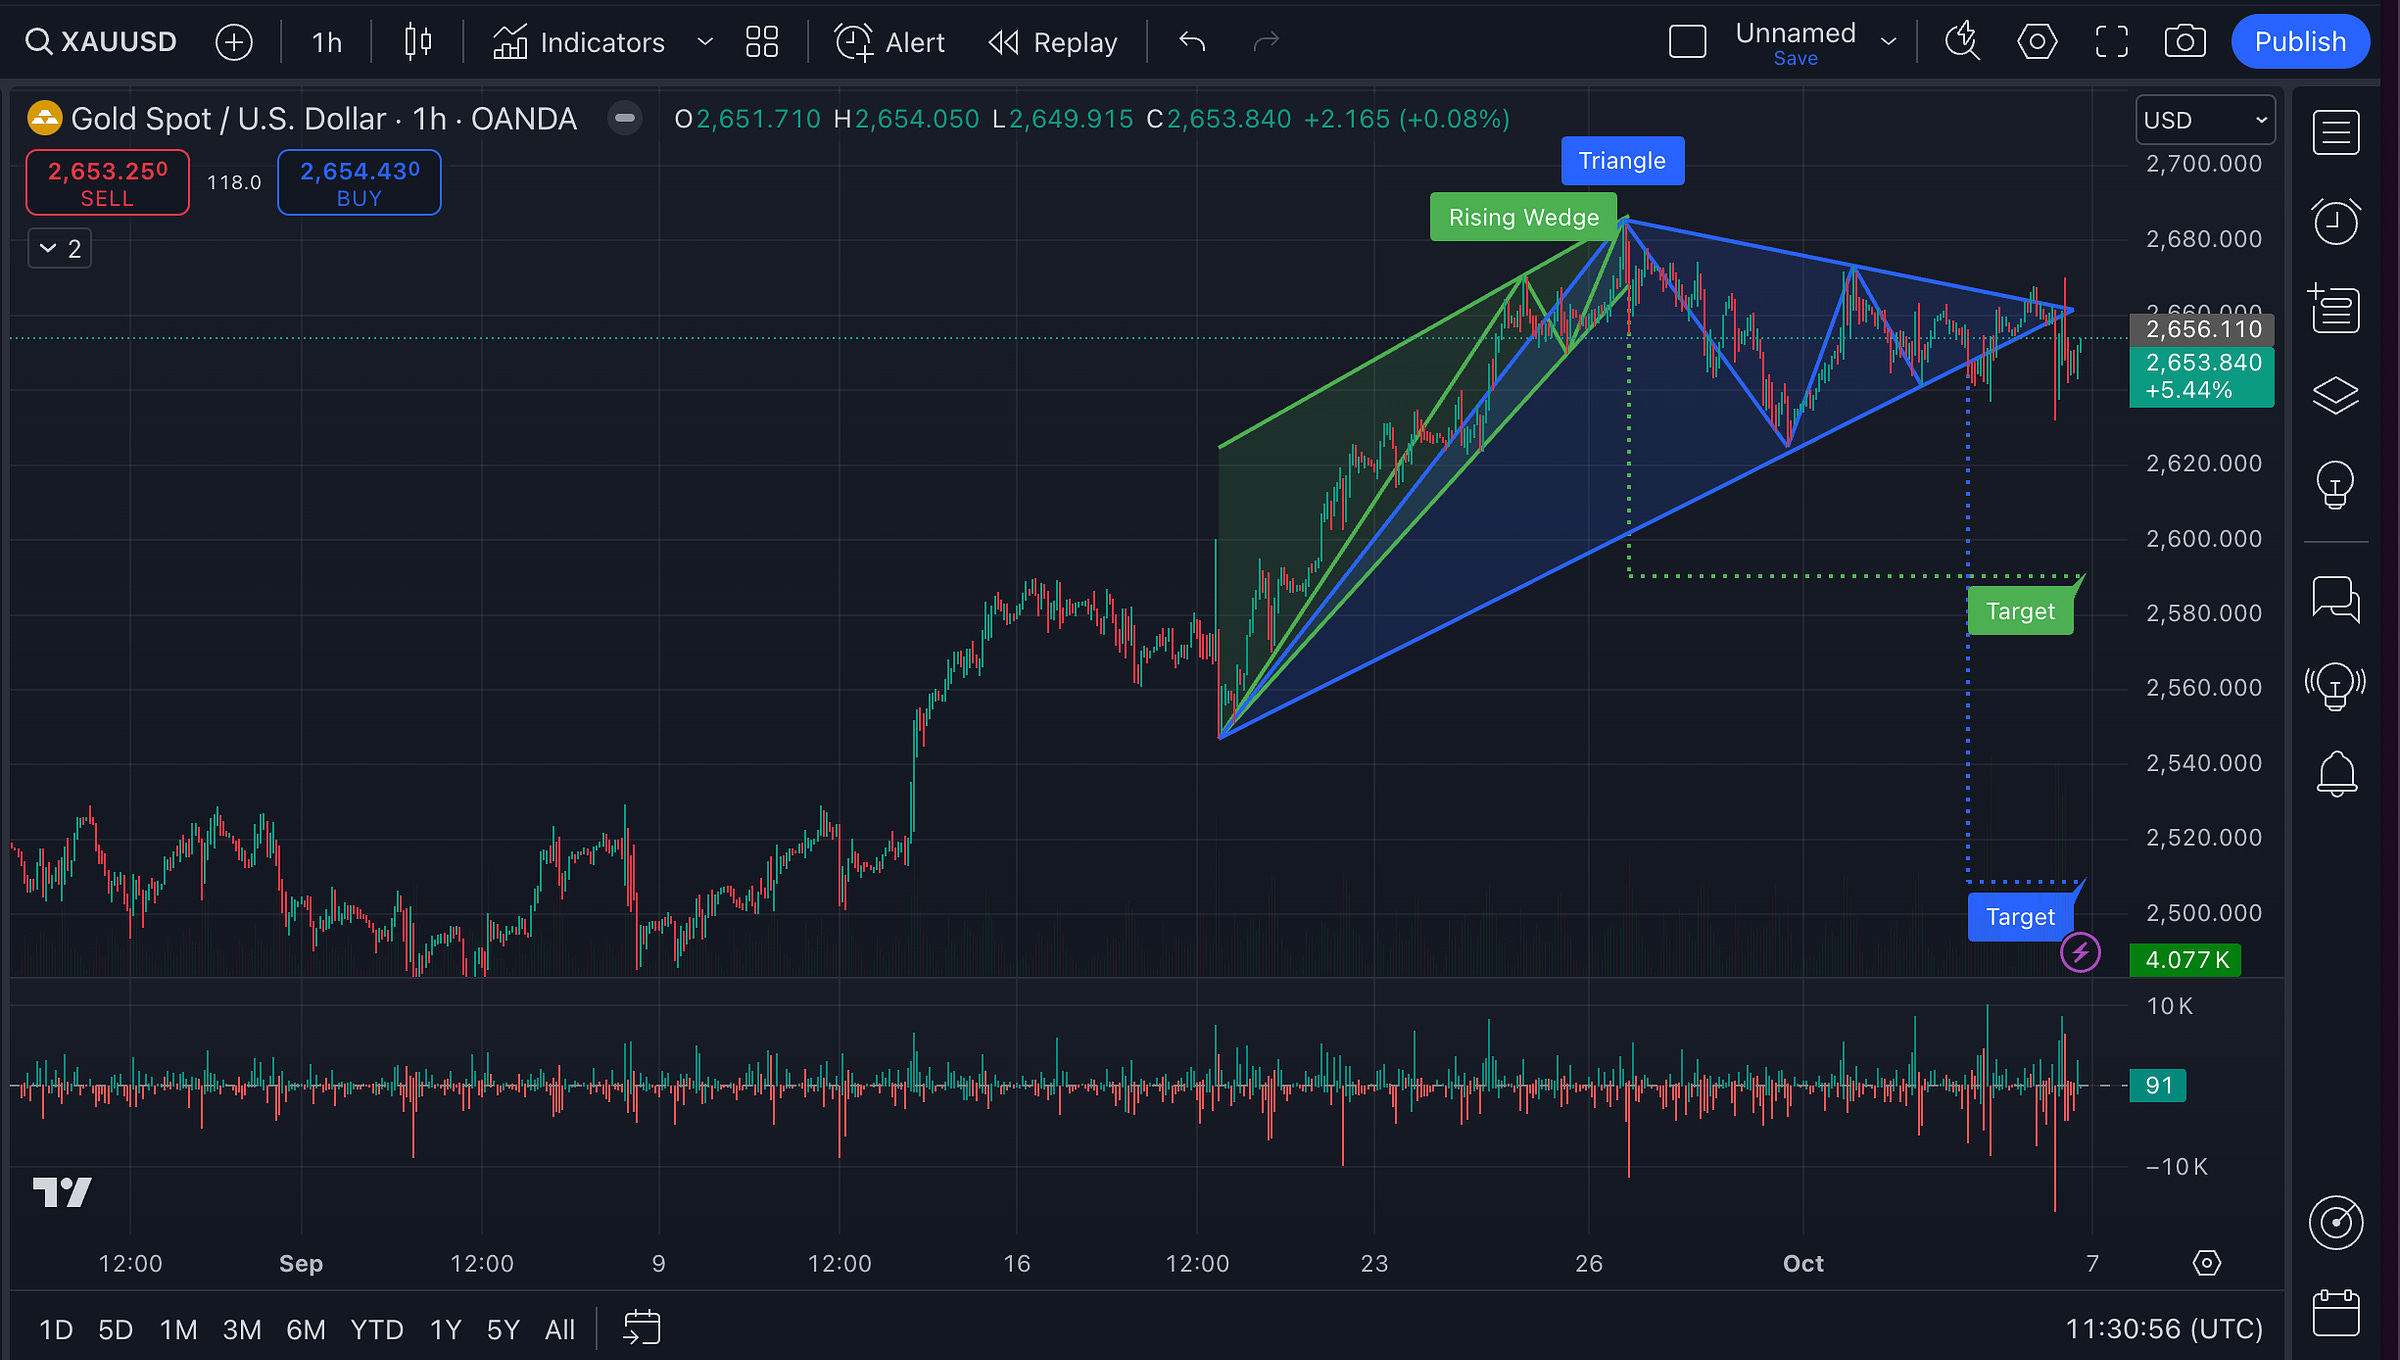
The current patterns point towards a bearish continuation.
The MACD is below zero and the histogram is showing increasing bearishness → right now, we’re in a minor downtrend or short-term weakness within the larger uptrend.
There's a chance for a bullish crossover soon. If this happens, it would signal that momentum is shifting back towards the upside.
The RSI shows the market is in a balanced state.
The VI gap is narrowing, showing that bullish momentum is weakening. This aligns with the MACD, where we’re seeing short-term bearish momentum building.
A rising wedge, typically a bearish reversal pattern, has broken down → this usually signals that the market could move lower to the target around $2,590.
The price has broken down from the triangle pattern, confirming the bearish sentiment from the wedge. The target is around $2,510.
Currently, selling pressure is stronger than buying.
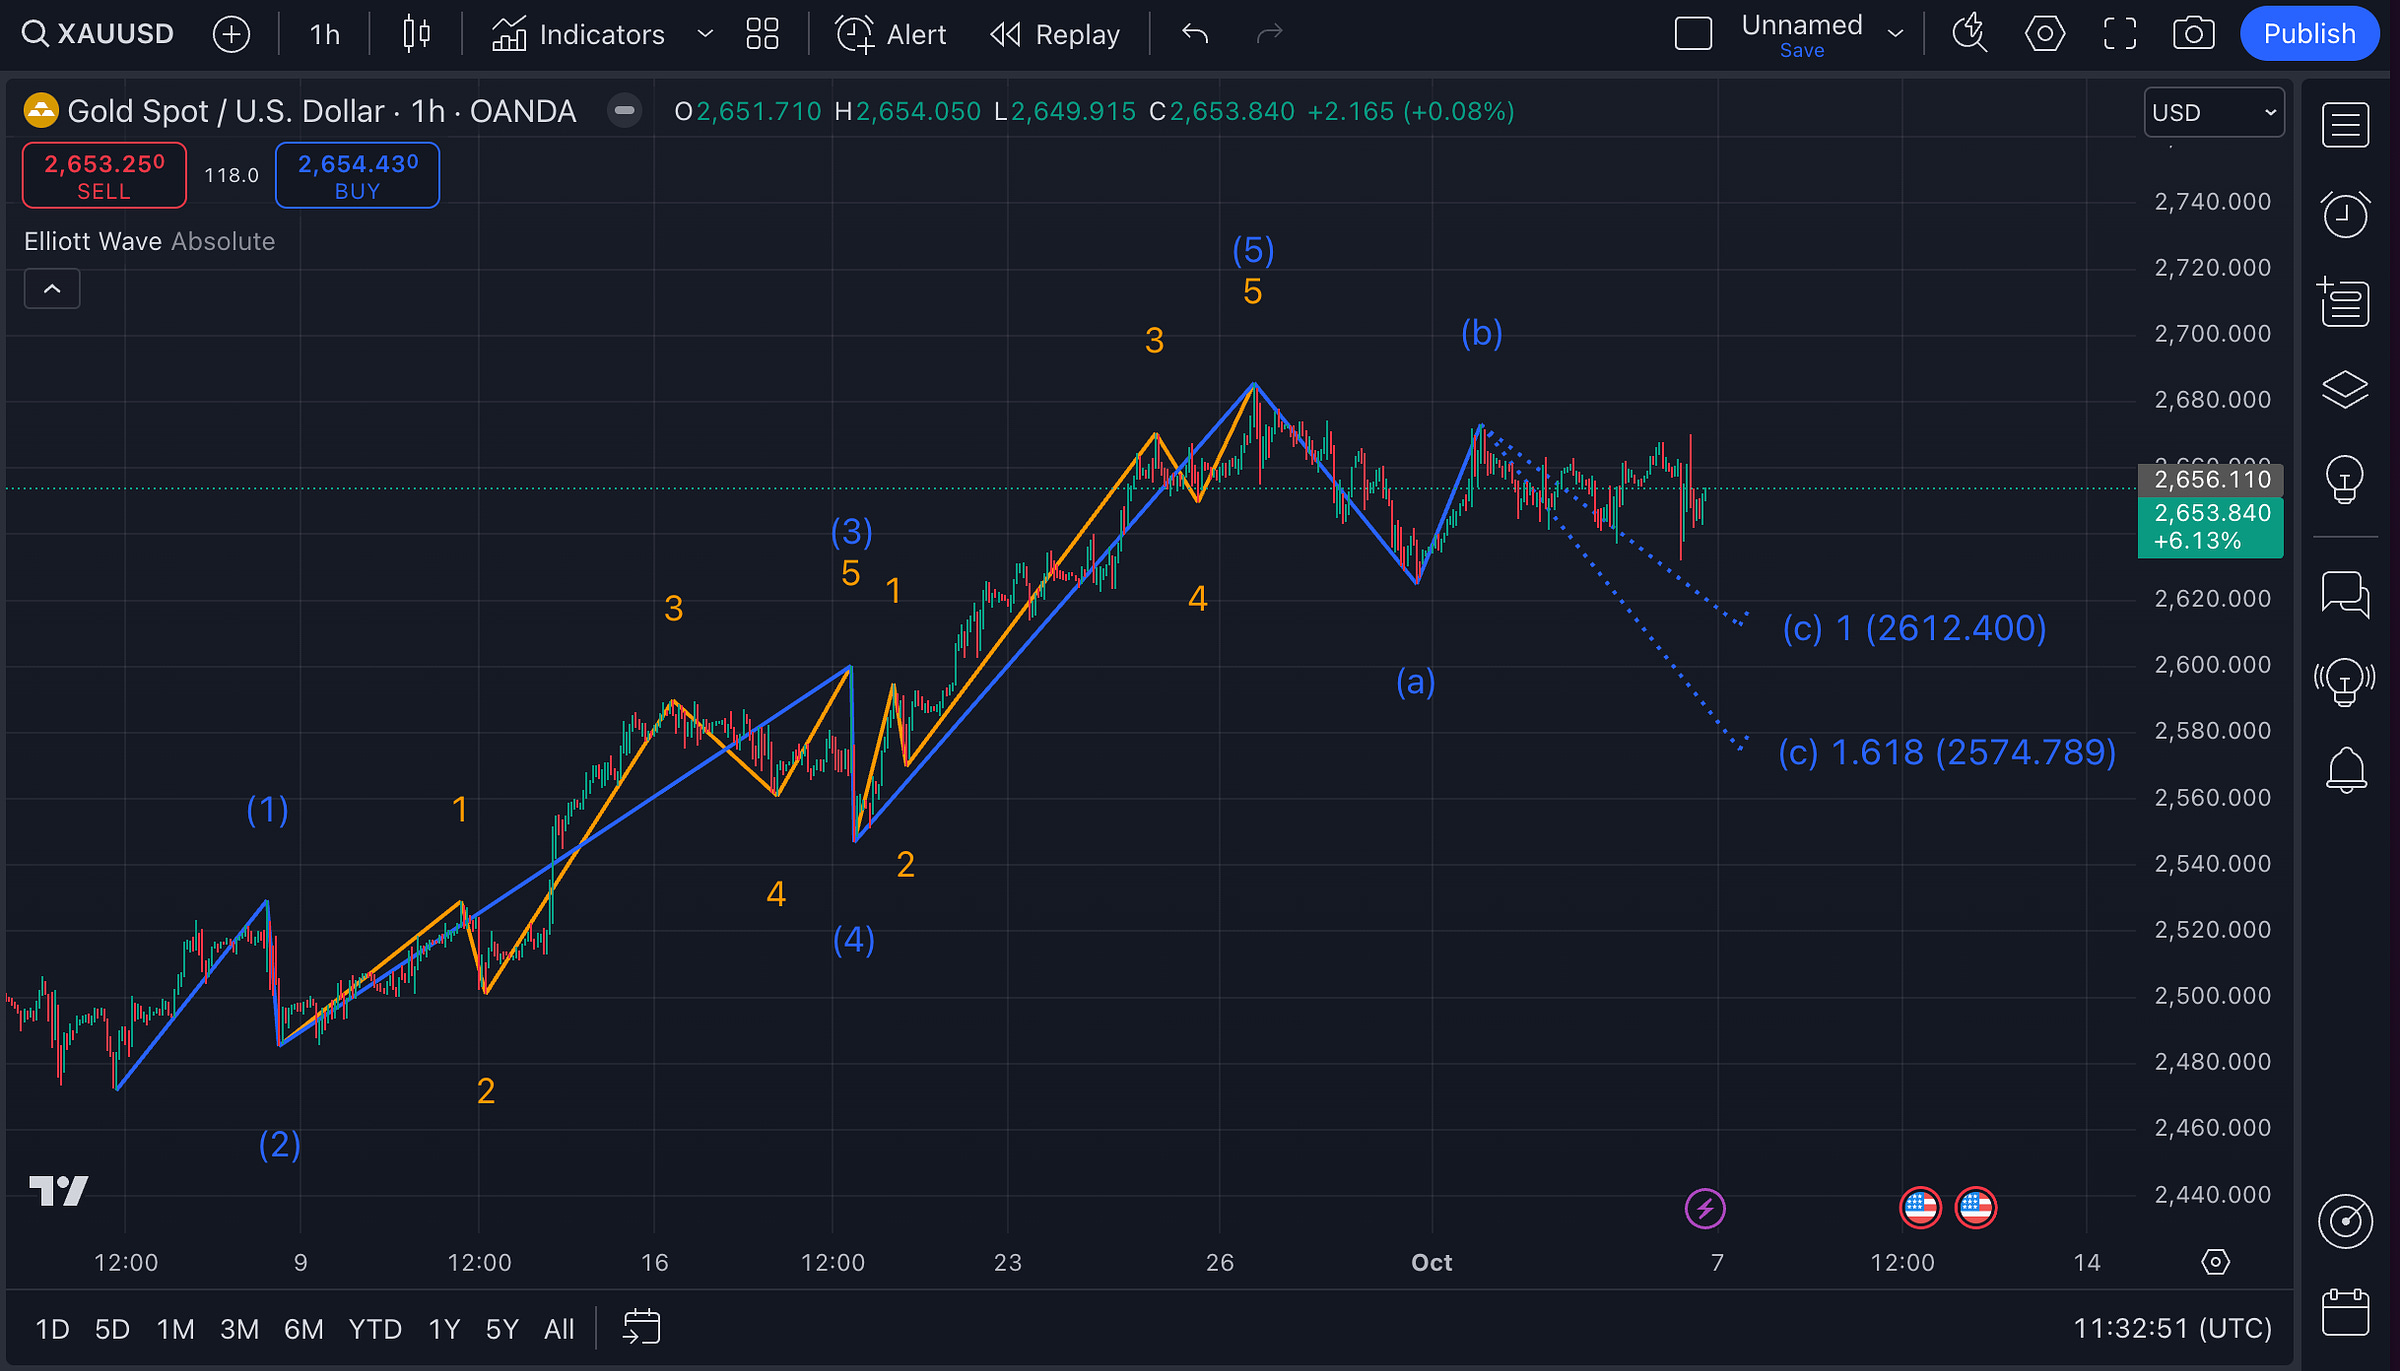
The market is currently in the Wave C correction wave. Wave C tends to be the final leg of the correction and usually mirrors the length or exceeds the length of wave A.
Projection levels for Wave C:
(c) 1 level at $2,612.40: The 1st target, based on a 1:1 Fibonacci extension of the A wave.
(c) 1.618 level at $2,574.79: Deeper target, which corresponds to a 1.618 Fibonacci extension of Wave A.
Last 30 days - 30min charts
Key takeaway:
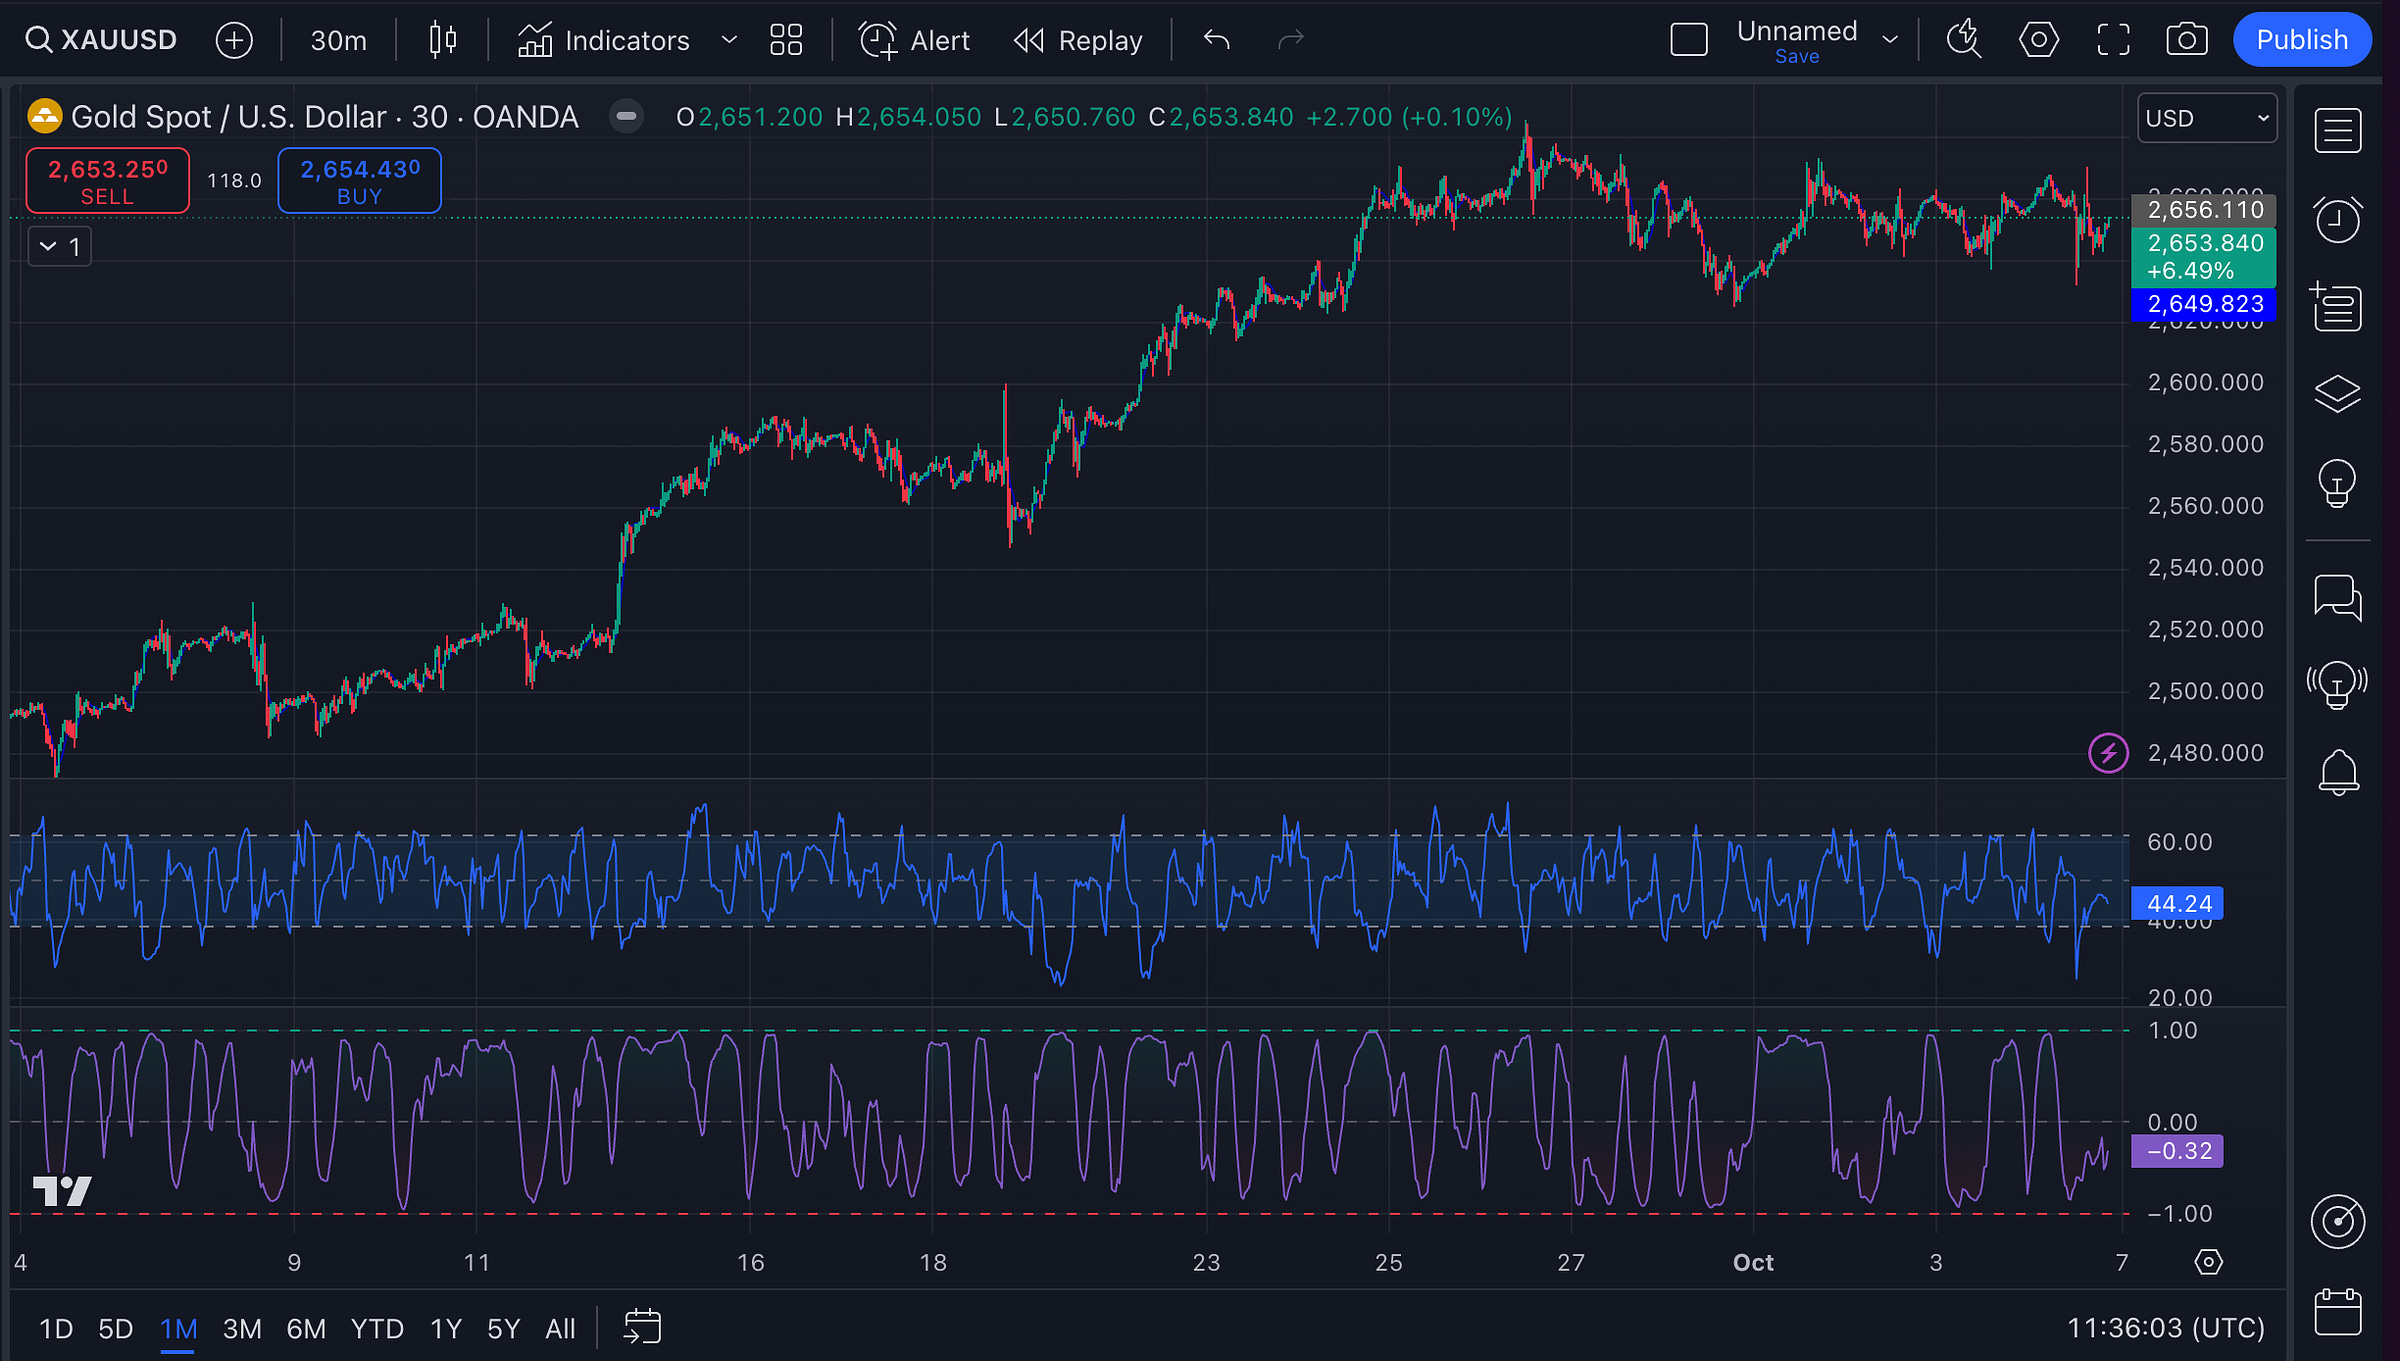
Indicators confirm short-term consolidation and a potential drift lower, tying in with the previous analysis of a corrective phase in the market. Volatility is low and momentum is lacking.
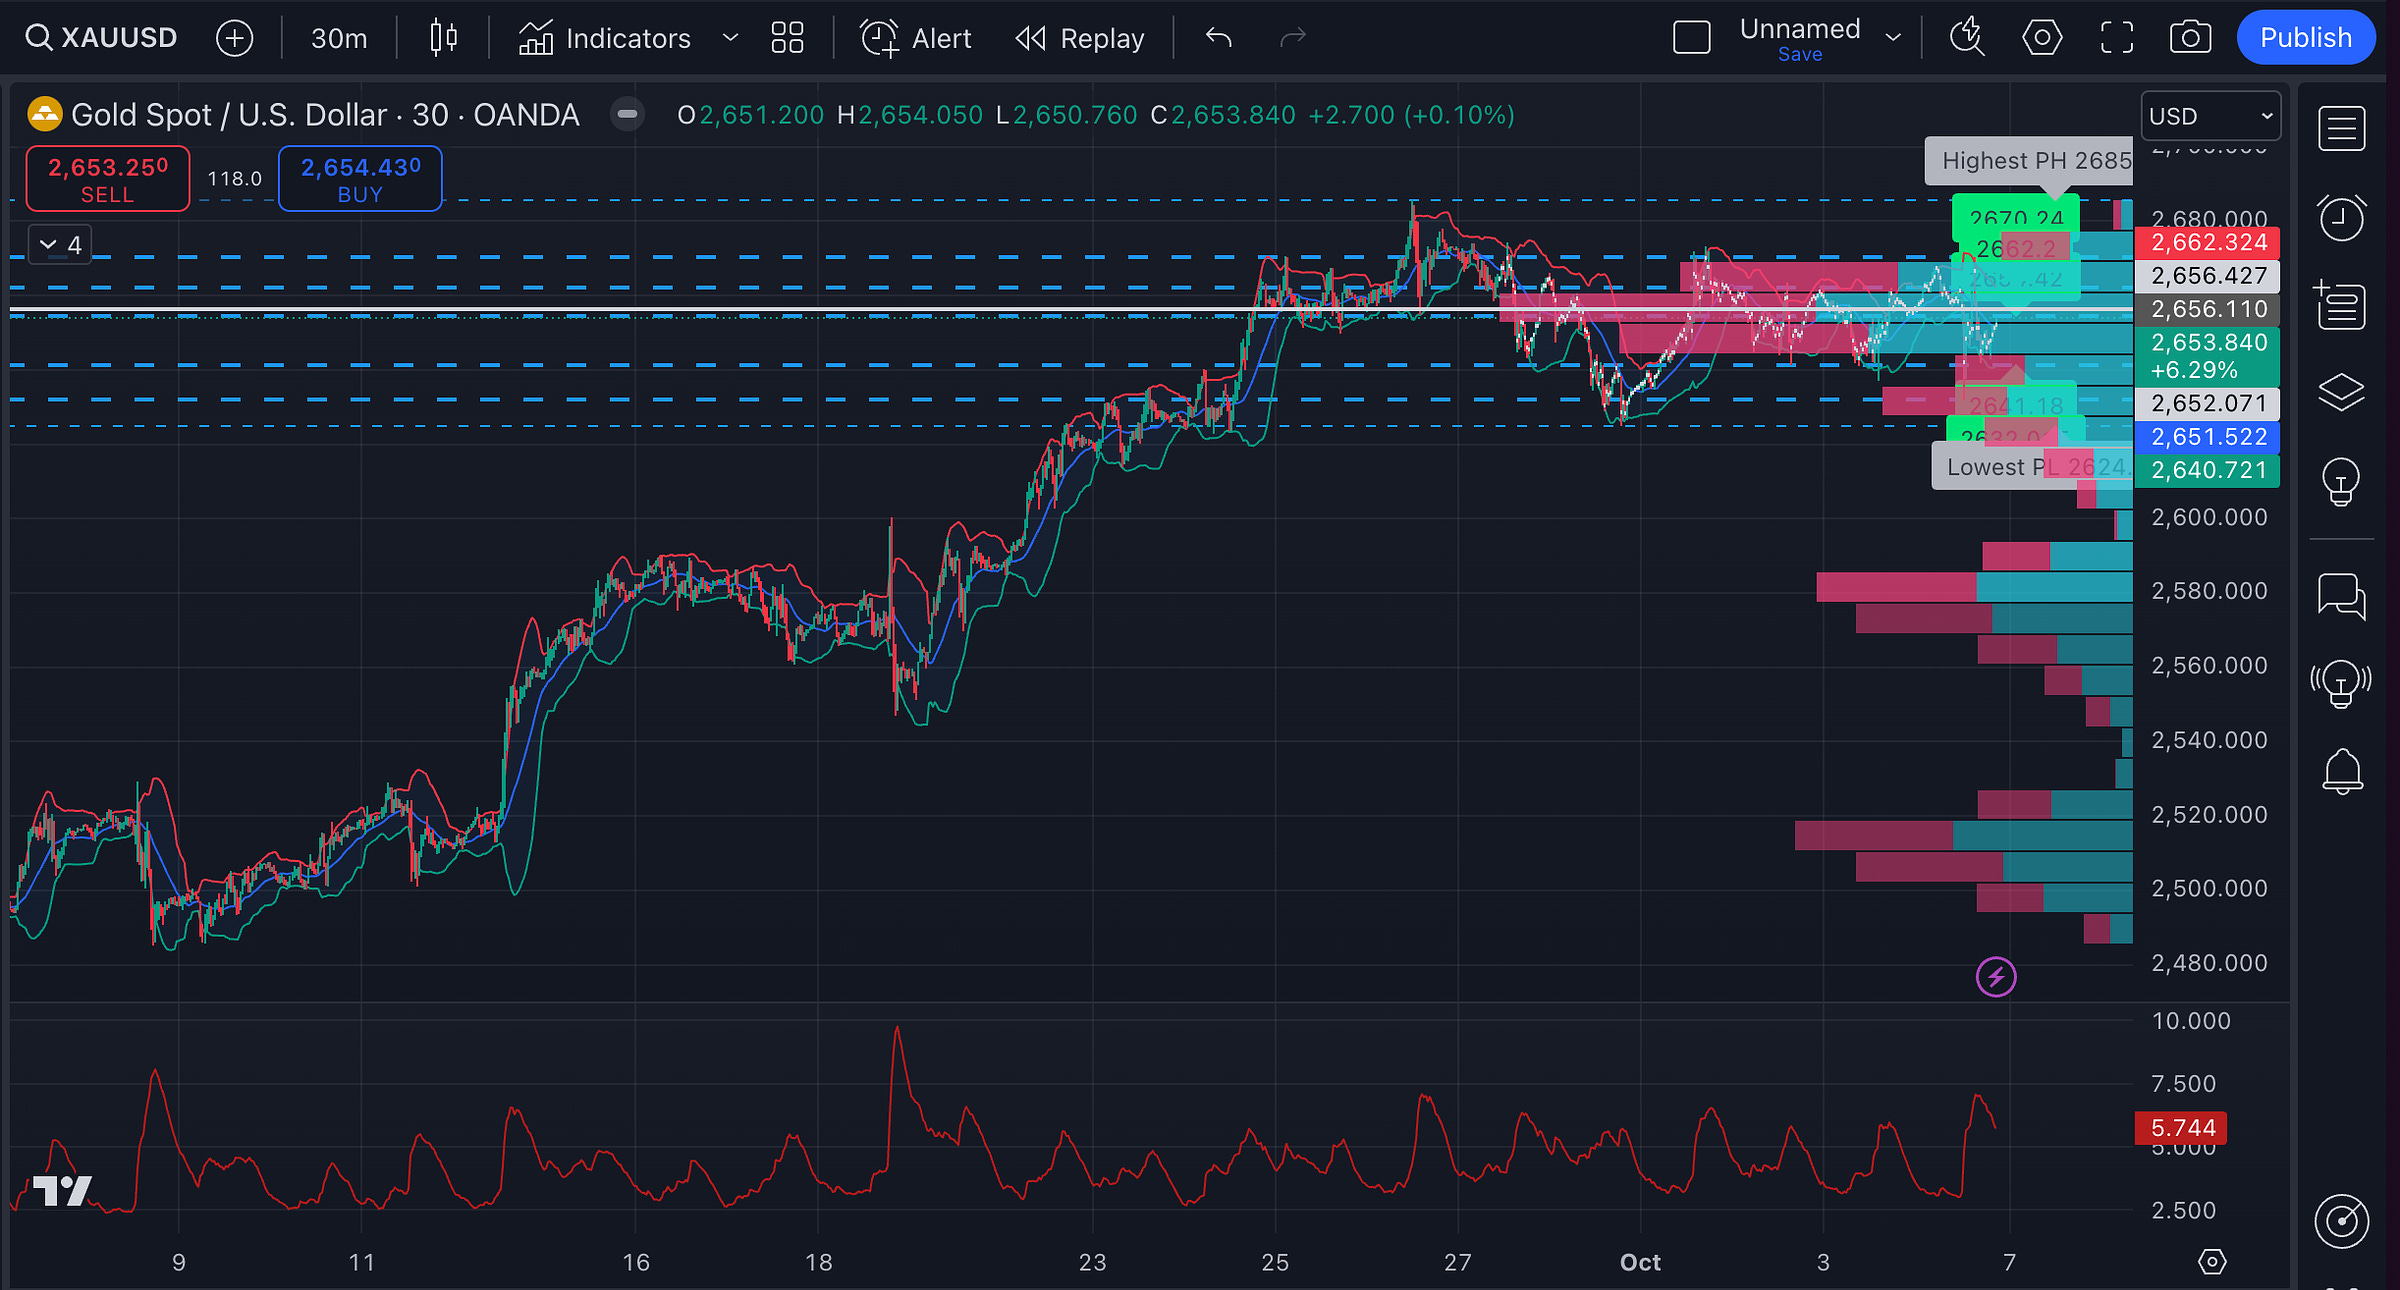
The price is above the ZLEMA → slight bullish bias in the short term.
However, it’s hovering close to the ZLEMA → we’re in a short-term consolidation and low momentum.
The CHOP shows that the market is currently in a moderately choppy phase, which aligns with the sideways movement. → This ties in perfectly with the symmetrical triangle from the earlier chart and the corrective wave (A-B-C) from the Elliott Wave chart.
The TSI shows a slightly bearish momentum in the short term.
The TSI’s slightly negative value combined with weak momentum suggests that Gold might continue to drift lower in the near term, potentially revisiting support levels around $2,640, which aligns with the bearish Wave C from the Elliott Wave analysis.
The largest volume node (POC) is around $2,650, which means this is a significant support level.
Another key volume level around $2,656 - $2,662, indicating resistance.
When the price touched the upper Bollinger Band, it failed to break out, which shows that buying pressure is not yet strong enough to push prices higher.
The volatility is low, consistent with the choppy and sideways action seen across multiple charts.
💡 Key Levels To Watch
Resistance:
$2,655 - $2,662 - repeatedly served as resistance across multiple charts. On the Bollinger Bands, the price was capped around this level. In the MACD and RSI readings, bullish momentum faded at this range.
$2,670 - $2,680 - the highest recent pivot high (PH) and where the final fifth wave of the Elliott Wave impulse topped out, marking a bullish exhaustion.
Support:
$2,640-$2,650 - a large amount of trading activity has taken place here. In the Elliott Wave analysis, this zone also coincides with the corrective wave structure. Plus, the price bounced off this zone repeatedly.
$2,610 - potential end of the Wave C corrective phase if the market experiences a stronger short-term pullback.
$2,580 - $2,590 - deeper potential correction target, where buyers might come in.
📰 Key economic updates
👂 Listen about major macro events from this week:
🇺🇸 The United States
Fed Chair Jerome Powell Speech - interest rates at 4.25%-4.50% by the end of this year
Current interest rate stands between 4.75%-5.00%
Feds will likely continue with gradual interest rate cuts of 0.25% increments, if the economy performs as anticipated.
The rate is expected to drop further to a long-term level of around 2.9% in 2025.
The ISM Manufacturing PMI - 47.2, the 6th consecutive month of decline:
The manufacturing sector is weakening, with most sub-indices in contraction territory.
The Employment Index fell to 43.9 from 46.0 in August, showing that manufacturers are cutting jobs at a faster pace.
The New Export Orders Index was 45.3, down from 48.6 in August, meaning the overseas demand for U.S. manufactured goods is also weakening, likely reflecting global economic challenges.
Only one of the six largest manufacturing industries - Food, Beverage & Tobacco Products expanded in September.
77% of manufacturing gross domestic product (GDP) is now contracting, up from 65% in August.
JOLTS Job Openings - 8.04 million ↑, above the forecast
Despite slower overall job growth, the labor market shows stability.
There are about 1.1 available jobs for every person looking for work.
There is still demand for workers, especially in sectors like construction, transportation, warehousing, utilities, and state/local government (excluding education).
The quits rate dropped to 1.9%, the lowest since 2015 (outside of the pandemic period). Workers are more hesitant to leave their current jobs, likely due to uncertainty in the labor market.
Hiring has slowed due to election uncertainty, squeezed corporate profit margins, and slower demand in some industries.
Initial Jobless Claims - 225,000 ↑, slightly higher than the forecast
Despite the rise, claims are still considered low and consistent with a solid labor market.
Unadjusted claims dropped by 1,066 to 180,647.
Economists believe claims may rise to 250,000 in the coming weeks due to the hurricane Helene, which caused massive destruction across North Carolina, South Carolina, Georgia, Florida, Tennessee, and Virginia.
Labor strikes by Boeing machinists and dockworkers could lead to temporary layoffs in related industries. Boeing has already announced furloughs for tens of thousands of workers due to the strike.
The ISM Services PMI - 54.9 ↑, the highest reading since February 2023
Overall service activities are growing for the 3rd consecutive month, signaling strong demand and higher output.
The Employment Index fell to 48.1, showing a reduction in hiring activity for the first time in three months.
The Prices Index rose to 59.4 from 57.3 in August. Higher prices can indicate inflationary pressures, which may be passed on to consumers.
Twelve industries reported growth in September, up from 10 in August.
Non-Farm Payrolls - 254,000 ↑, the largest increase since March 2024
254,000 new jobs significantly exceeded the forecast of 147,000 and the previous month’s revised figure of 159,000.
The percentage of industries reporting payroll increases jumped to 57.6%, up from 51.8% in August, showing broad-based job creation across sectors.
Leisure and hospitality saw the largest gains, with restaurants and bars adding 69,000 jobs.
Manufacturing lost 7,000 jobs, mainly in the motor vehicle sector, while warehousing and transportation lost 8,600 jobs.
Average hourly earnings increased 0.4% in September, following a 0.5% rise in August.
Wages grew 4.0% year-over-year, slightly higher than the prior month’s 3.9%.
The average workweek fell to 34.2 hours from 34.3 in August, suggesting that employers are trimming hours slightly.
The dollar strengthened to a seven-week high following the report, and U.S. Treasury yields rose.
Unemployment Rate - 4.1% ↓
This drop from 4.2% was largely due to a gain of 430,000 jobs, which easily absorbed the 150,000 people who entered the labor force.
The employment-to-population ratio increased slightly to 60.2% from 60.0% in August, indicating a higher percentage of the population is now employed.
The number of people jobless for less than five weeks dropped significantly by 322,000 to 2.1 million.
The long-term unemployed (jobless for 27 weeks or more) remained stable at 1.6 million.
4.6 million people were employed part-time for economic reasons.
The overall picture → the U.S. economy is more resilient than expected.
Labor market holds up: Despite strong nonfarm payrolls and decline in unemployment, there are underlying issues, such as an increase in part-time work for economic reasons and more people working multiple jobs. Strikes at Boeing and port facilities could temporarily disrupt employment data in the coming months.
Manufacturing weakness: The manufacturing sector is facing headwinds from declining demand and supply chain issues, and it's clear that this part of the economy is in a slump.
Services sector strength: In contrast to manufacturing, the services sector is expanding strongly and helping to prop up overall economic growth.
Inflation and wages: Overall, inflation has moderated but not disappeared, and wage growth could continue to put pressure on prices.
Federal Reserve policy outlook: The strong jobs report and resilient economy have reduced the likelihood of aggressive rate cuts by the Federal Reserve. Markets now expect a 25-basis-point cut in November, but the odds of a 50-basis-point cut have almost vanished.
Potential impact on Gold → immediate downward pressure with potential for upward momentum
Stronger U.S. economy: This week’s strong data could dampen demand for Gold as a safe haven, especially if investors see less need to hedge against economic risk. If the labor market continues to show strength and inflation moderates further, Gold prices could face downward pressure.
Dollar strength: The U.S. dollar has rallied on the back of positive labor market data. A stronger dollar can weigh on Gold prices, as it makes Gold more expensive for buyers using other currencies. If this dollar strength persists in the short term, Gold may struggle to gain momentum. That said, its upside may be limited if the Federal Reserve starts cutting rates.
Potential for rate cuts: The expectation of a 25-basis-point rate cut in November remains strong. Lower rates reduce the opportunity cost of holding Gold, a non-yielding asset, making it more attractive to investors.
Inflation and economic uncertainty: Wage growth remains solid, and the services sector continues to experience price increases. This could reignite inflation fears. Plus the continued contraction in manufacturing, coupled with uncertainties around labor strikes and the fallout from Hurricane Helene, introduces elements of risk, which might eventually give Gold a boost.
🇪🇺 Eurozone
🇩🇪 Germany's inflation - 1.6% YoY ↓, declined for the 2nd month in a row
There was a significant drop in energy costs, which fell by 7.6%.
Food prices rose by 1.6%, up from 1.5% the previous month.
The core inflation rate, which strips out food and energy, hit 2.7%, its lowest since early 2022.
Monthly inflation in September remained flat at 0%, slightly better than August but still lower than expected.
🇮🇹 Italy’s inflation - 0.7% YoY ↓
This marks a continued decrease after two months of inflation being above 1.0%.
The main reason for the slowdown in September was a drop in energy prices.
Transportation costs increased by 2.5% in September, slightly lower than the 2.9% rise seen in August.
Eurozone inflation - 1.8% YoY ↓, the lowest level since April 2021.
This is also below the 2% target set by European Central Bank's (ECB).
The drop was due to a steep fall in energy prices, which declined by 6%.
Services inflation decreased slightly to 4%, from 4.1% the month before.
The core inflation rate, which excludes volatile items like food and energy, also eased to 2.7%, down from 2.8% in August.
The ECB lowered interest rates to 3.50% in September and will likely push for further rate cuts soon.
The situation in the Eurozone → inflation is declining, but deeper economic issues persist
A drop in energy prices playing a key role in holding inflation down across Eurozone.
The Eurozone as a whole saw inflation drop to 1.8%, the lowest level since April 2021.
The broader economic situation remains weak. Germany is seeing rising unemployment and a declining business climate, while France is struggling with rising taxes and budget deficits.
The ECB may continue to cut rates, but experts are skeptical about whether this will be enough to spur growth. Structural issues like weak consumer confidence and a fragile labor market are still significant concerns across Europe.
Potential impact on Gold → upward pressure due to lower interest rates and economic uncertainty
Lower rates: As inflation in Europe cools below the ECB’s 2% target, the central bank may continue cutting interest rates. Lower interest rates typically weaken the euro, bond yields, and other major currencies, making Gold more attractive.
Economic uncertainty: Economic stagnation in Germany and other key economies creates risk-aversion among investors. Gold tends to perform well in periods of economic uncertainty, as traders seek safer assets. If economic growth remains weak or if key countries like Germany slip further toward recession, Gold will likely benefit from continued investor demand for safety.
China’s role: Some temporary boosts, like China's economic stimulus, may provide relief to Europe’s markets. If Chinese growth picks up, European economies could see improved exports and economic stability. However, without sustained consumer confidence and structural changes in Europe, the midterm Gold outlook remains bullish.
🇨🇳 China
NBS Manufacturing PMI - 49.8 ↑, manufacturing shrinking
Despite the improvement from the last month, this is still below 50, meaning manufacturing activity is shrinking but at a slower rate.
Factory output grew for the first time in five months.
New orders and foreign sales continue to shrink but at a slower pace.
Buying levels, employment, and prices all fell.
Input costs rose, but the increase was less sharp than before.
Delivery times are getting longer.
Caixin Manufacturing PMI - 49.3 ↓, lowest since July 2023
This drop suggests a clear slowdown, both domestically and in exports, pulling down manufacturers' confidence to near record lows.
New orders have decreased significantly, marking their worst decline in two years.
There’s a lot of uncertainty about global trade, which has further dampened confidence, now at its second-lowest level since 2012.
China’s leadership acknowledged the economy is facing new challenges, calling for stronger measures to support growth.
Key takeaways → the country’s economy is slowing down
Weak manufacturing and global Demand: China's weak manufacturing PMI suggests weaker domestic demand, as well as a sharp drop in export orders. With China's economy struggling to meet its growth targets, global demand for Chinese goods is slowing, which further impacts the country’s industrial output and trade.
Government stimulus: The government has responded to these challenges with significant stimulus measures, including interest rate cuts and liquidity injections. But their effectiveness is still uncertain, especially given that major issues like weak demand and global trade tensions persist. The economy might need further stimulus measures if the situation continues to worsen.
Sentiment: Confidence among manufacturers has hit near record lows, affected by a gloomy global trade outlook and concerns over reduced foreign demand. This lack of optimism impacts business decisions, including hiring and production levels, making it difficult for China to quickly recover.
Potential impact on Gold → strong support due to China’s economic slowdown, weak manufacturing, and possible further stimulus
Safe-haven demand: Economic uncertainty in China, the world's second-largest economy, will likely push investors toward safe-haven assets like Gold. This could lead to a short-term rise in Gold prices, particularly if there are further signs of weakening economic data or additional stimulus from the Chinese government.
Stimulus measures: China’s stimulus efforts, including lowering interest rates, might weaken the Chinese yuan (CNY). A weaker yuan could make Gold more attractive for Chinese investors seeking to preserve their wealth, thereby increasing domestic demand for Gold.
Weakening global trade: Prolonged global trade issues, especially between China and major economies like the U.S. and the European Union (e.g., the tariffs on electric vehicles), may continue to hurt sentiment. This can keep demand for safe-haven assets, like Gold, strong. However, if China's economy doesn't fully recover or its demand for raw materials decreases, there could be some deflationary pressure, which might limit the upside in Gold prices.
🇯🇵 Japan
Tankan Large Manufacturers Index - 13, steady sentiment
The manufacturers' outlook for the next quarter remains at 14, unchanged from before.
While business sentiment is stable, manufacturers don't expect significant improvements going forward.
The non-manufacturers sentiment improved, reaching a stronger 34, up from 33 in the last quarter. This reflects solid domestic demand, especially from sectors like tourism.
Monthly Consumer Confidence - 36.9 ↑, the highest in 5 months
Despite the rise, the index fell short of the 37.1 forecasted by economists.
The employment sub-index saw the biggest improvement, rising by 0.8 points to 42.2, signaling more optimism around job prospects.
The income growth index also improved slightly, climbing to 40.1 from 39.7.
There was a minor increase in willingness to buy durable goods, which went up to 31.0 from 30.9.
However, the overall livelihood perception fell a bit, decreasing to 34.4 from 34.7, showing some concern about general living conditions.
93.1% of people expect prices to rise, which is a 1% increase from the previous month.
Key takeaways → Japan’s current economic situation reveals an underlying risk of inflation and potential rate hikes.
Inflation expectations: With 93.1% of consumers expecting prices to rise over the next year, inflation concerns are very high.
Economic growth: While consumer confidence is improving, it’s only doing so marginally. Higher employment and income growth can support economic stability, but consumers still feel some uncertainty about their future financial security. Businesses, on the other hand, aren't overly optimistic about future growth, which could translate into less aggressive spending and investment.
BOJ policy: The Bank of Japan has signaled that it will continue raising interest rates to curb inflation, especially if companies continue to hike prices.
Potential impact on Gold → upward pressure in the short term with risk of dampening demand in the future
Short-term: The combination of high inflation expectations, cautious consumer sentiment, and a potentially tightening BOJ suggests that there could be heightened volatility in the markets. If the BOJ hikes rates aggressively, this could strengthen the yen, possibly dampening demand for Gold in JPY terms. However, if global uncertainty persists, especially regarding China and U.S. economic slowdowns, investors might seek safety in Gold, supporting XAUUSD. Inflationary pressures could further boost Gold prices as a hedge.
Mid-term: In the mid-term, inflation will continue to be a key factor → we could see sustained demand for Gold. Additionally, if global economic growth slows down further or if Japan’s recovery stalls, the safe-haven appeal of Gold would likely increase.
🇦🇺 Australia
Balance of Trade - 5,644M ↑, above expectations
Exports fell by 0.2% month-over-month - the first decline in four months, driven mainly by a sharp 4% drop in rural goods exports.
Imports also dropped by 0.2% largely due to lower demand for consumption goods, which hit its lowest point for the year.
The slight drop in both exports and imports signals a softening in trade activity, which could point to an economic slowdown or weakening global demand.
The AUD/USD pair fall by 0.22% after the news.
Potential impact on Gold → support for XAU/USD in both the short and mid-term
Short-term: With weaker export and import data, and the AUD showing signs of softening, Gold could see increased demand as a safe-haven asset.
Mid-term: If China’s stimulus measures boost demand for Australian exports, this could help stabilize Australia’s economy, reducing the need for safe-haven assets like Gold. However, if global growth remains weak, gold could see continued upward pressure as a hedge against economic uncertainty, particularly if Australia's key export sectors don’t recover strongly.
🇨🇦 Canada
Ivey PMI s.a. - 53.1 ↑, economic activity rebounded
The Ivey PMI rose from 48.2 in August, which had been the first time in over a year the index dropped below 50. The actual figure exceeded forecasts of 50.3, showing stronger-than-expected growth.
Employment fell slightly to 51.6 from 54.7 in August, indicating slower growth in hiring.
The prices index dropped significantly to 58.2, its lowest level since March. Easing price pressures could signal lower inflation.
The unadjusted PMI also improved to 54.5 from 50.3.
Potential impact on Gold → neutral
The easing of inflation pressures and slowing employment growth could lead to a more dovish BoC. This would likely support Gold prices, as lower interest rates and economic uncertainty could increase demand for safe-haven assets like Gold. However, if inflation continues to cool significantly, Gold might lose some of its appeal as a hedge, leading to softer XAU/USD in the short term.
🎭 Market sentiment
In August, central banks added a net 8 tonnes of Gold.
This is the lowest amount since March.
Poland was the biggest buyer, adding 6 tonnes, followed by Turkey and India, which each bought 3 tonnes. Meanwhile, Kazakhstan sold off 5 tonnes of its Gold reserves.
Emerging market central banks have been the main buyers of Gold this year:
Turkey has bought the most so far, adding 52 tonnes.
Poland has steadily increased its reserves over the past five months to 398 tonnes.
India has also been building up its Gold holdings, with 45 tonnes added this year.
The Czech National Bank has bought 33 tonnes.
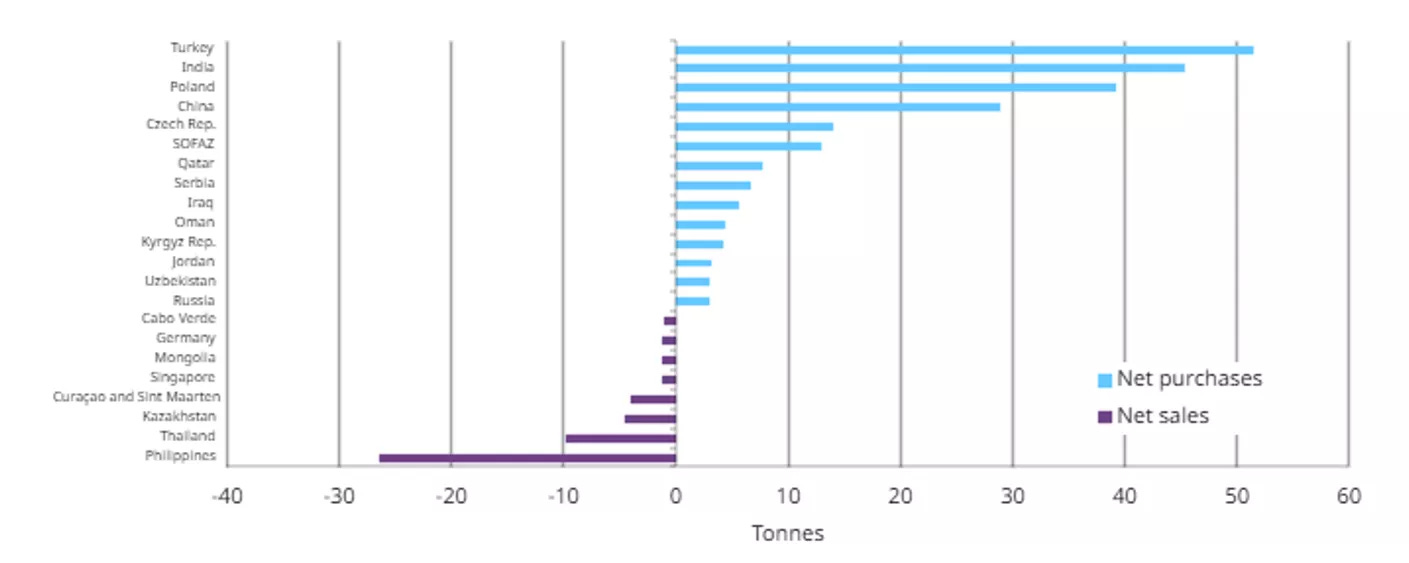
Even though central bank Gold buying has slowed down, they aren’t selling much either, which might mean they’re being cautious and waiting to see what happens.
The Commitments of Traders (COT) report
Open Interest
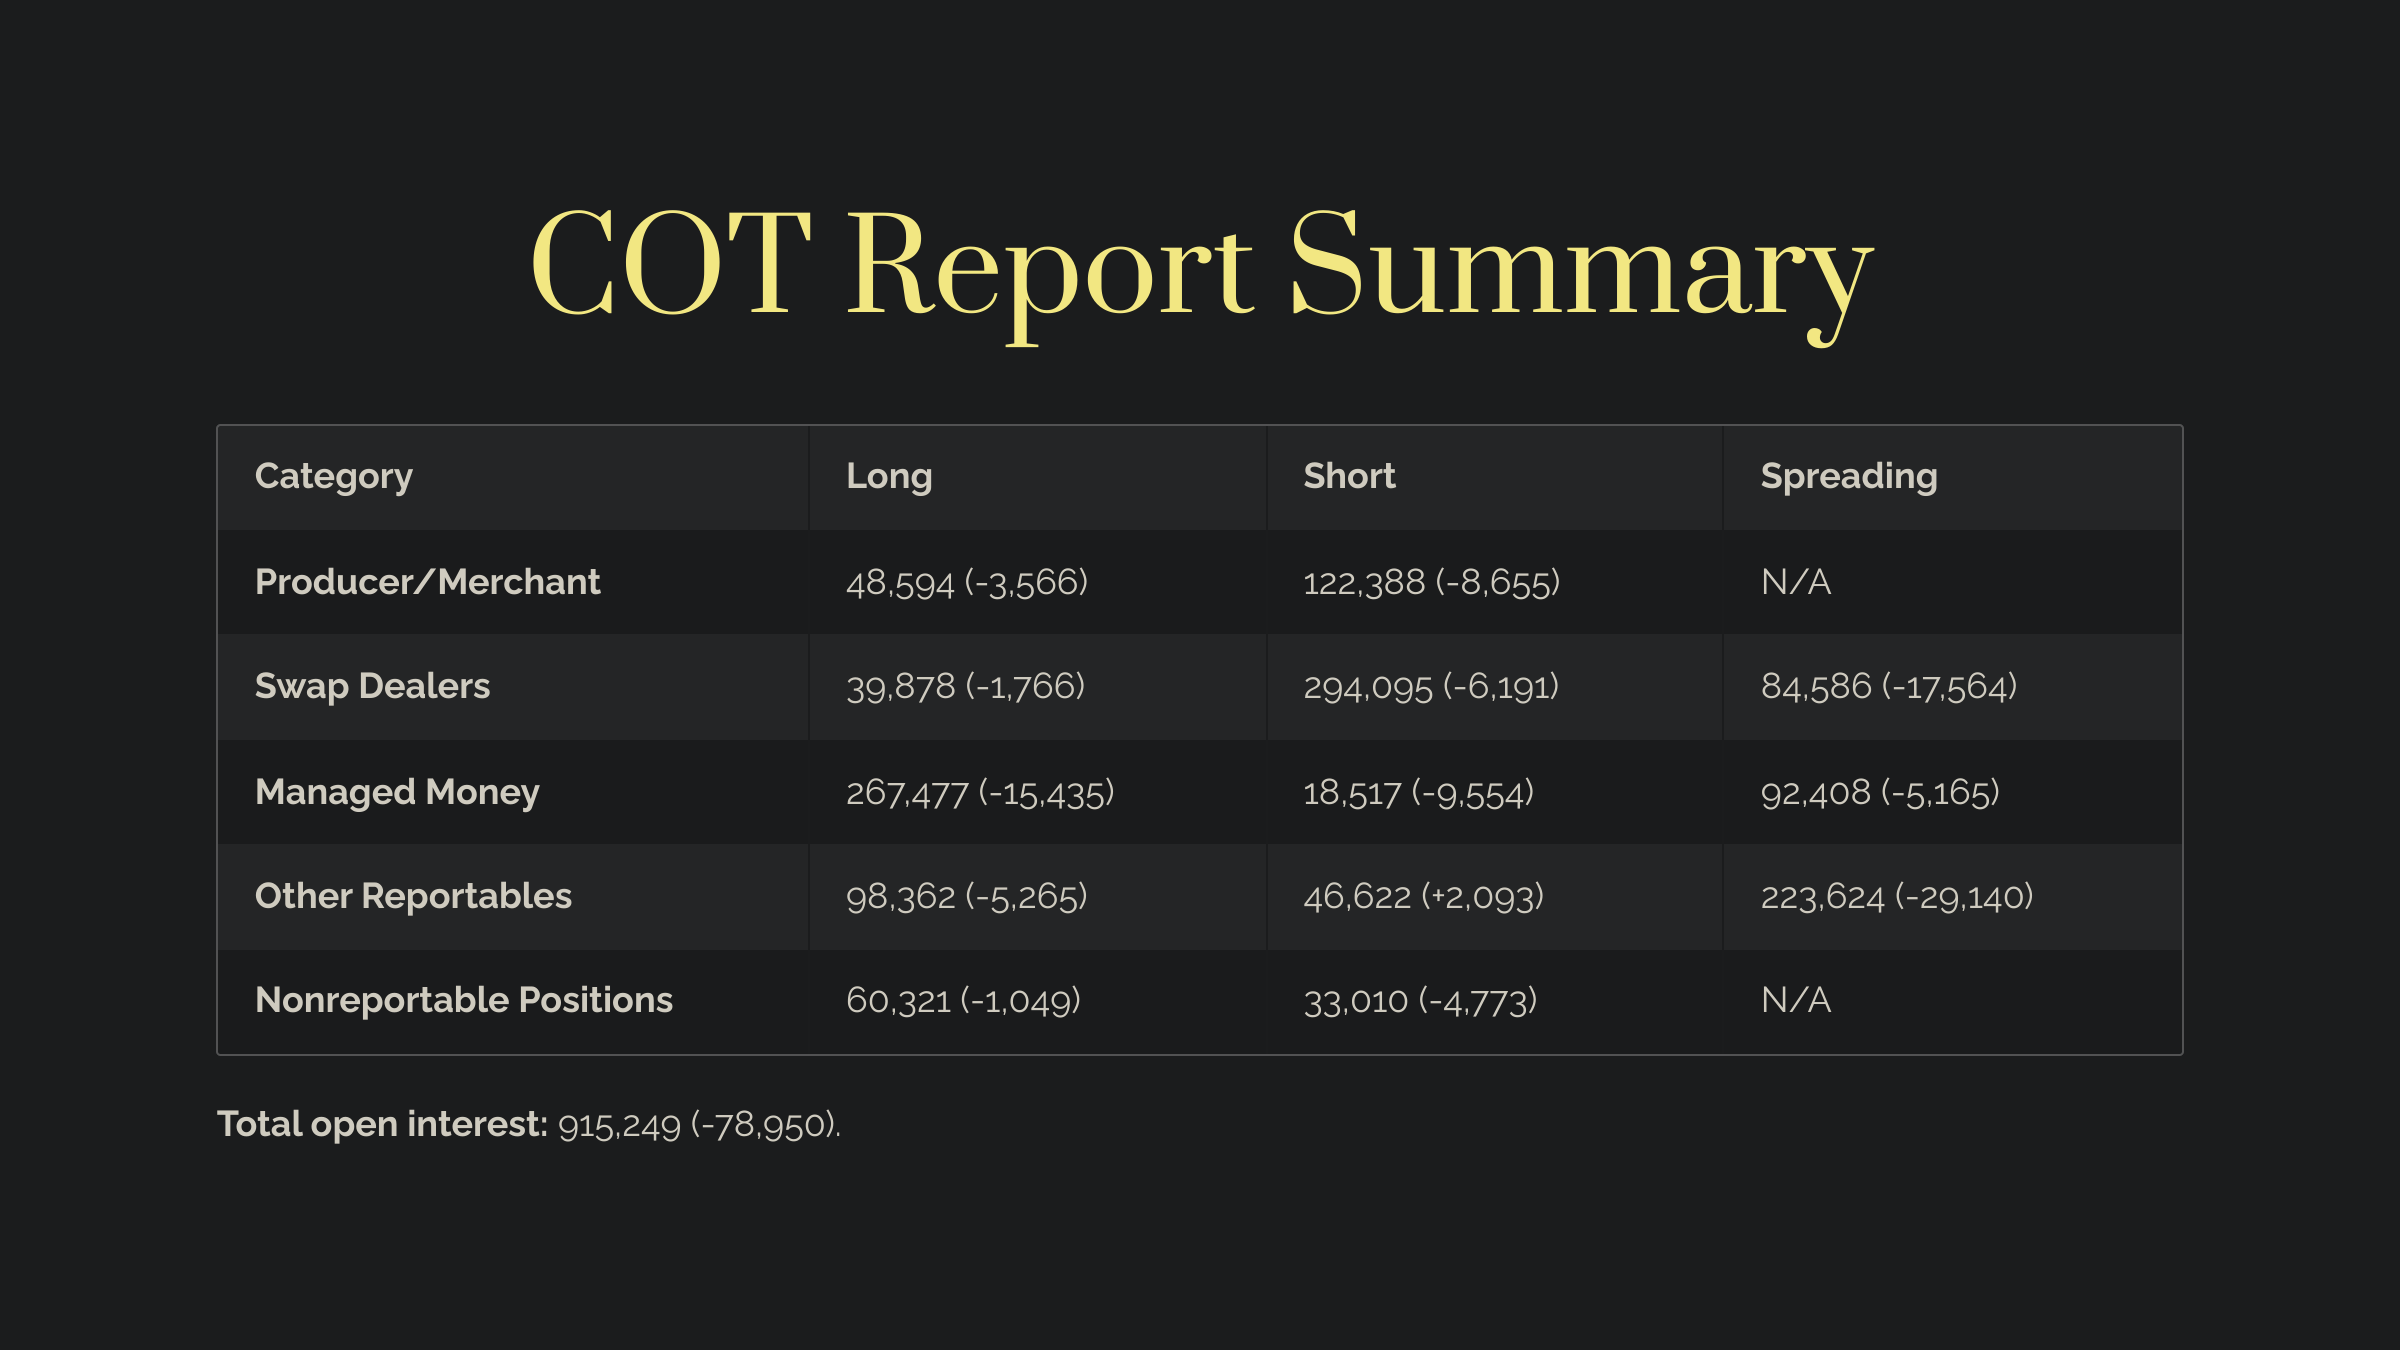
Total Open Interest: -78,950 contracts
Suggests a reduction in participation, meaning traders may be closing out positions or losing confidence in their previous stances.
Producer/Merchant Positions - typically large corporations or mining companies hedging their exposure to Gold
Reduced both their long and short positions.
The reduction in shorts may hint that they are less concerned about near-term downside risk.
Swap Dealers - financial institutions that make markets and provide liquidity
Reduced their short exposure quite a bit, turning less bearish on Gold compared to last week.
The steep drop in spreading positions signals less appetite for complex trades, likely due to reduced volatility expectations or reduced trading opportunities in the short term.
Managed Money - hedge funds and other institutional investors
Sharply reduced both their long and short positions.
A 15,000+ decrease in longs might mean many speculators are taking profits or becoming less optimistic on the immediate upside for Gold.
A reduction of shorts might mean many traders are also less certain of downside potential.
We might see range-bound trading in the near term as a result.
Other Reportables - smaller institutional traders, like prop trading desks
Reduced their long positions while increasing shorts slightly.
The massive reduction in spreading (down 29,000 contracts) shows less interest in arbitrage or spread trades, again reinforcing a lack of directional conviction in the short term.
Nonreportable Positions - retail traders or smaller speculators
reduced both long and short positions, reflecting lower participation and uncertainty.
The larger drop in short positions suggests some retail traders may be stepping away from betting on a falling Gold price.
Changes in percent of open interest
4 Largest Traders Long: 21.7%
4 Largest Traders Short: 30.2%
8 Largest Traders Long: 32.5%
8 Largest Traders Short: 47.3%
The concentration of short positions in the hands of major traders suggests that some big institutions still have a bearish outlook. However, the concentration on the long side is also significant, meaning that some large players see value in holding Gold long-term. This divergence creates the potential for sharp moves if there is a catalyst (like economic data or geopolitical tensions).
Key takeaways:
Gold may be in for a period of sideways trading or consolidation.
Many traders have pulled back their positions, which typically means less volatility and potential for breakouts in either direction is low unless new market-moving information emerges (such as interest rate announcements or unexpected economic data).
There is a strong concentration of short positions among the biggest players.
If economic uncertainty increases (for example, if inflation picks up), there may be a shift back to long positions, as Gold typically acts as a safe haven. The key is whether demand for safety picks up.
👀 What to expect
Technical side
For the next week, Gold is likely to remain in a consolidation phase.
The market has been in sideways consolidation, and the indicators show low volatility.
This reflects a lack of momentum from both bulls and bears.
Given that MACD and TSI are showing signs of weakening bullish momentum, I expect short-term bearish pressure to persist.
A break below $2,640 would confirm short-term bearish pressure and likely lead to a test of $2,612 and trigger a new buying opportunity.
Once the corrective phase completes, I expect Gold to resume its uptrend.
The larger technical structure still favors a bullish bias in the mid-term.
If the price bounces off $2,612 or $2,590, it will likely retest the $2,662 resistance and attempt a breakout toward $2,670-$2,680.
In case of broader market weakness or a strengthening USD, a deeper correction toward $2,590 or even $2,550 could unfold, especially if the price fails to hold the $2,612-$2,640 support zone. This would represent a more prolonged consolidation phase before Gold resumes its uptrend.
Overall outlook
In the short term, Gold could face downward pressure due to:
the strength of the U.S. dollar, which has risen on strong nonfarm payrolls and unemployment data.
Reduced traders’ positions and the concentration of short positions among big players.
However, most of the macro news from around the world keep giving Gold solid support:
Inflation is still a concern in the U.S., particularly in wages and services. Economic uncertainties, like U.S. labor strikes and disruptions from Hurricane Helene, could also increase safe-haven demand for Gold. Plus, further rate cuts could offer support by reducing the opportunity cost of holding non-yielding assets like Gold.
In Europe, economic stagnation in key countries like Germany and France will likely drive safe-haven demand, and further ECB rate cuts could weaken the euro, making Gold more attractive in euros.
China’s economic slowdown is another key factor supporting Gold. Shrinking domestic demand and potential stimulus measures may increase Gold demand, especially if the yuan weakens, boosting Gold’s appeal in CNY terms.
Central banks continue to buy Gold, providing midterm support for prices.
Safe trading,
and remember: All that glitters is not Gold,
Joe


