Hello, fellow traders!
Gold surged to a new high above $2,750 but lost momentum midweek as U.S. Treasury yields rose and risk appetite improved. Early in the week, safe-haven demand boosted Gold on China’s LPR cut and geopolitical tensions, but U.S. dollar strength and profit-taking trimmed gains. After some choppy action, Gold ended the week trading within a narrow range.
In this week’s update, I’ll:
Look at the technical setup of XAU/USD and what it tells us about potential future price action.
Highlight the recent key support and resistance levels.
Break down this week’s key economic data from around the world (audio available!) and how it might affect XAU/USD in the mid term.
Explain the latest shift in the market sentiment as to the COT report and what it means for Gold's outlook.
Share my short-term and mid-term predictions on XAU/USD price action and trajectory.
📊 Let’s look at the technical data
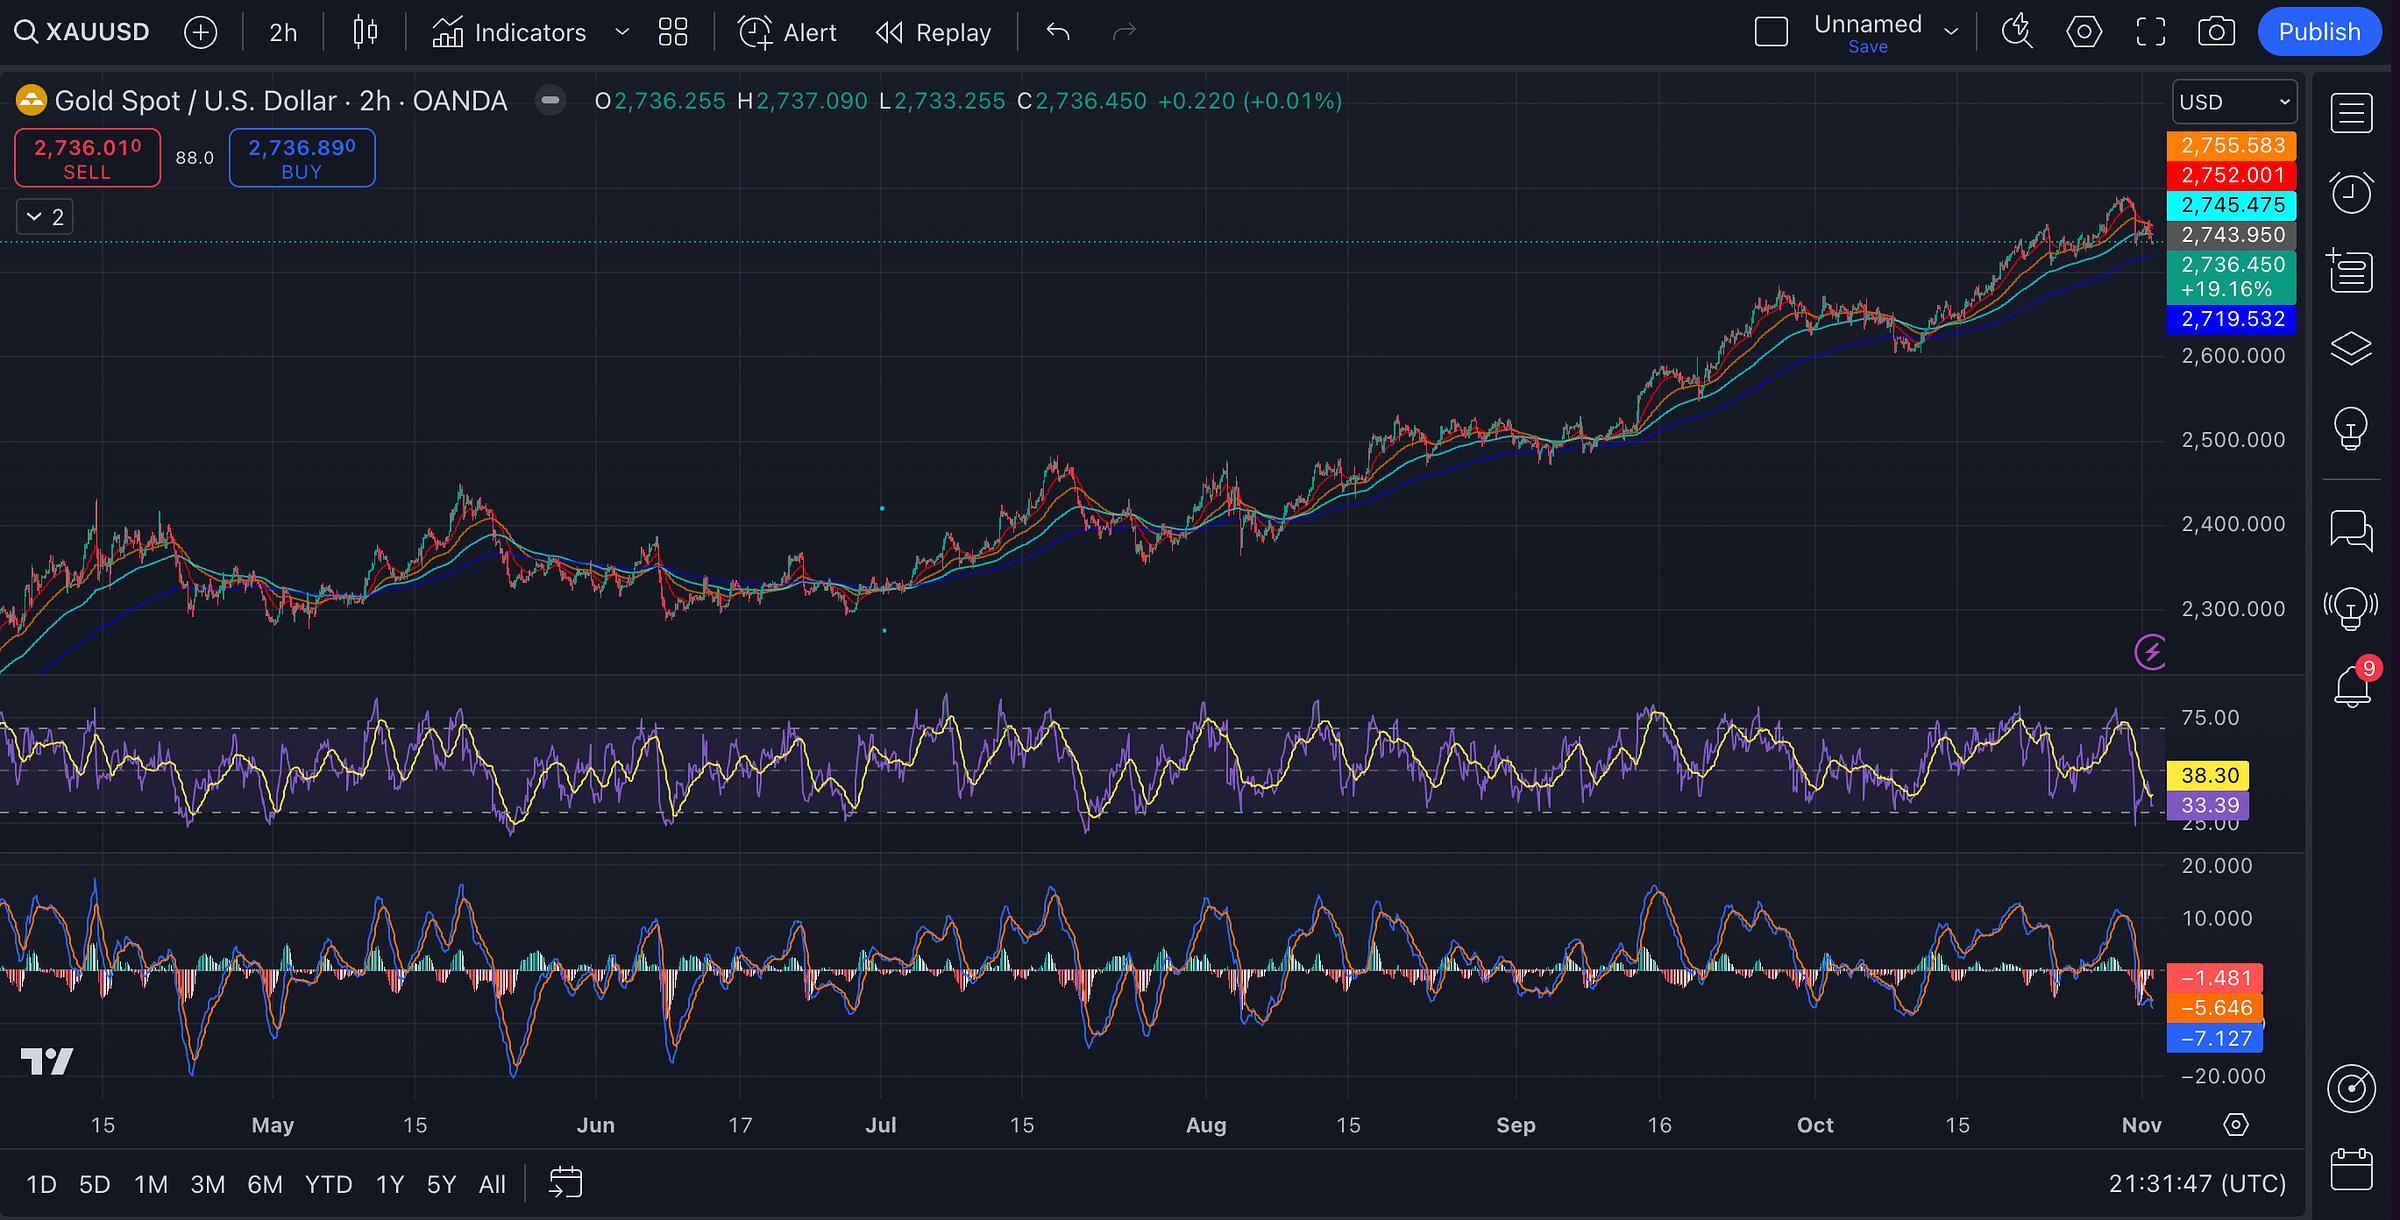
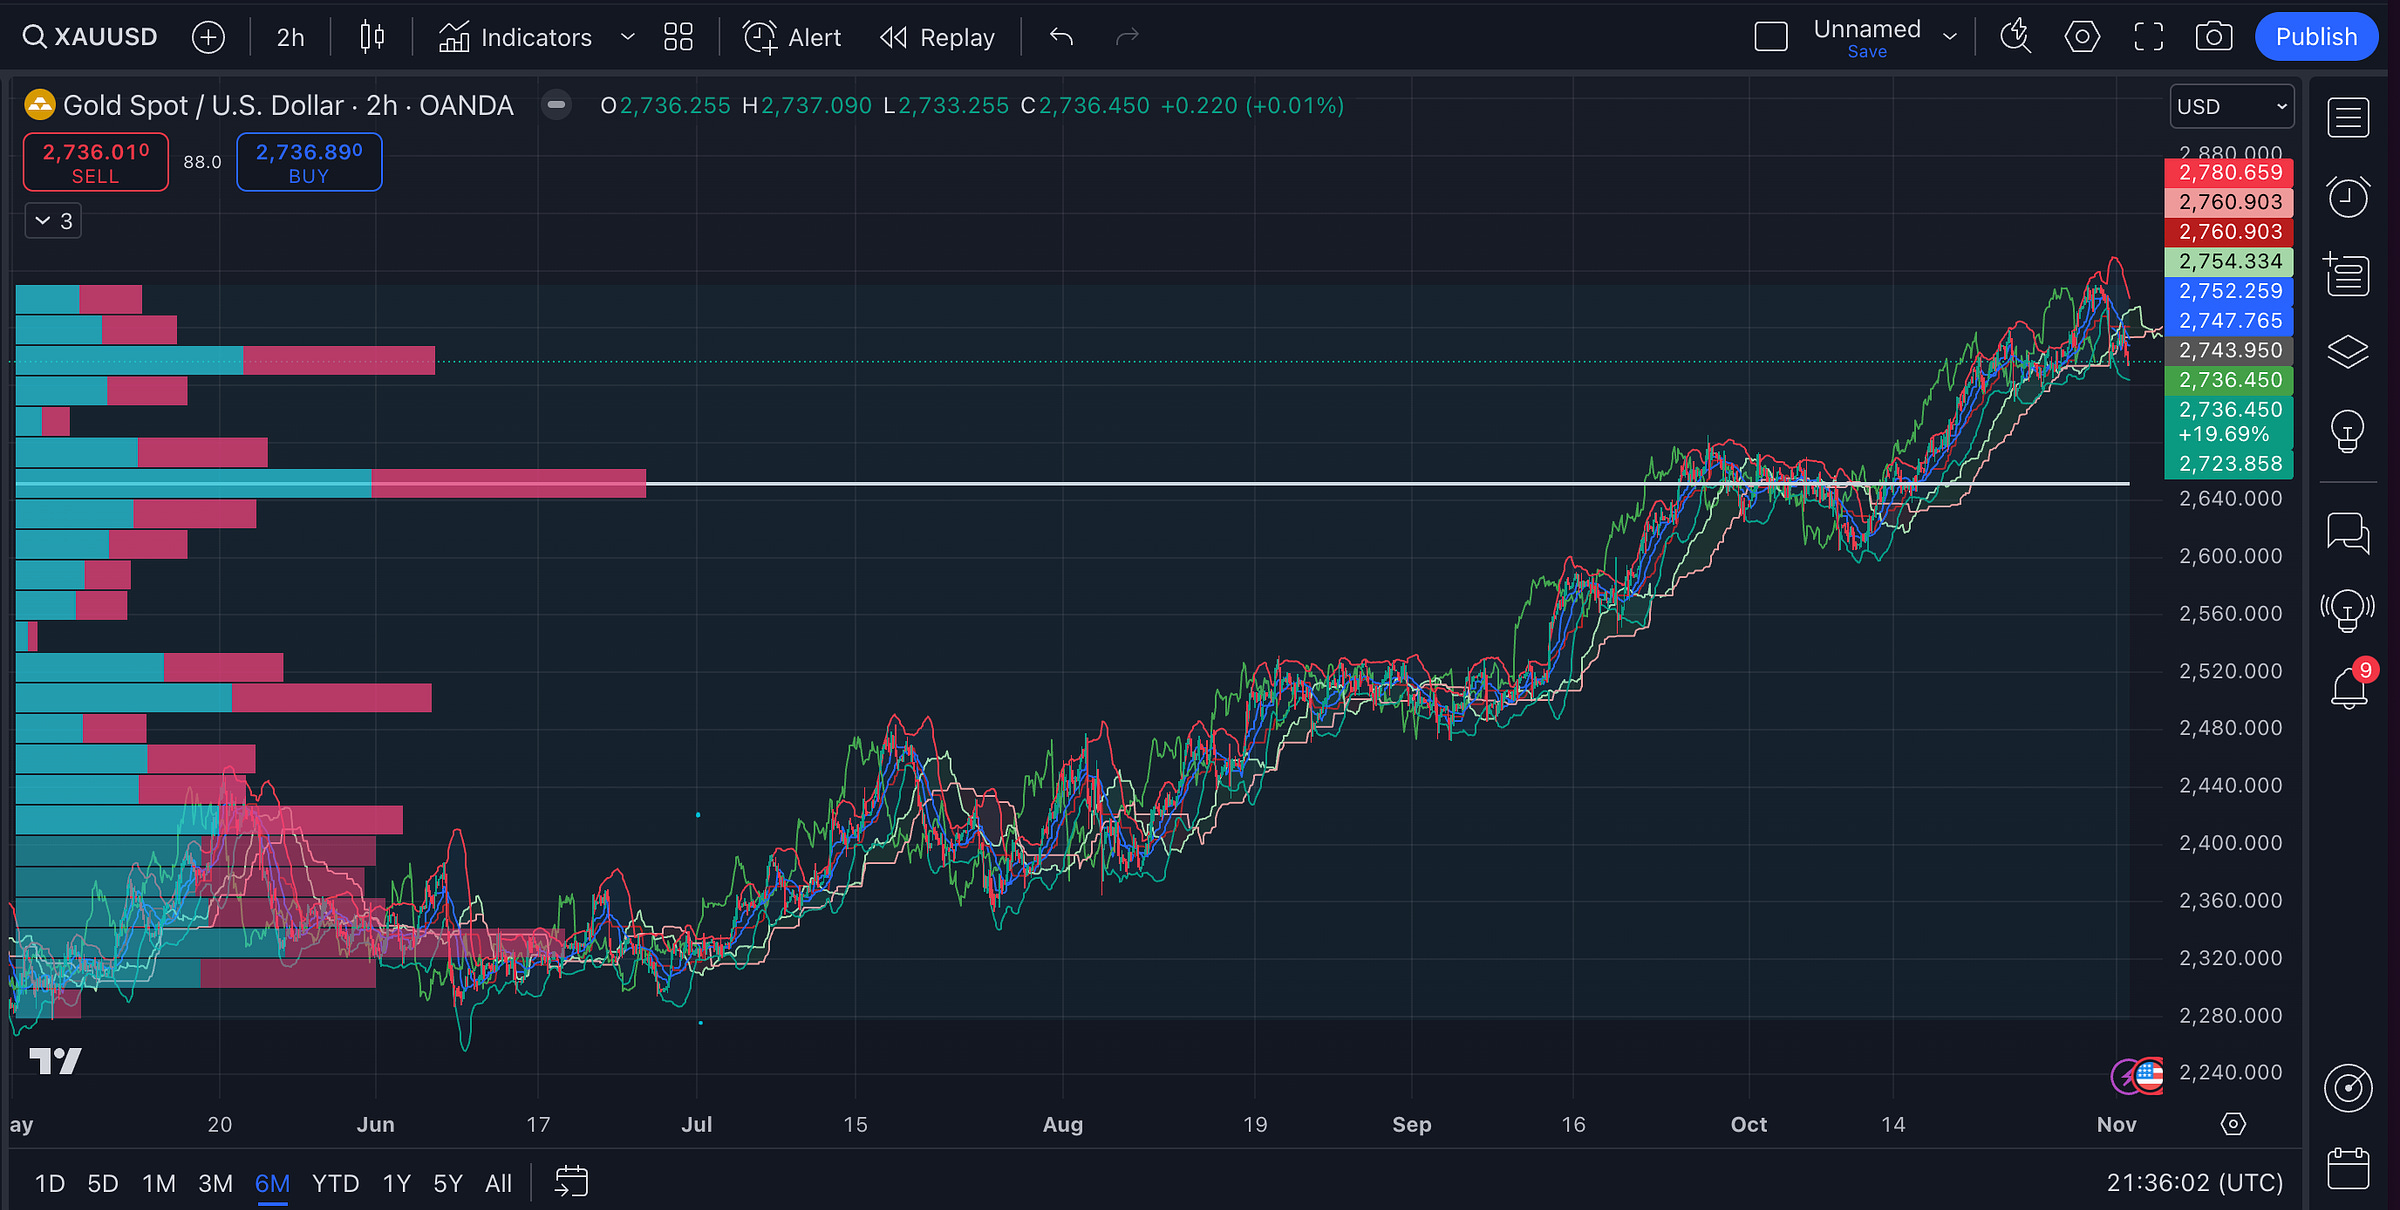
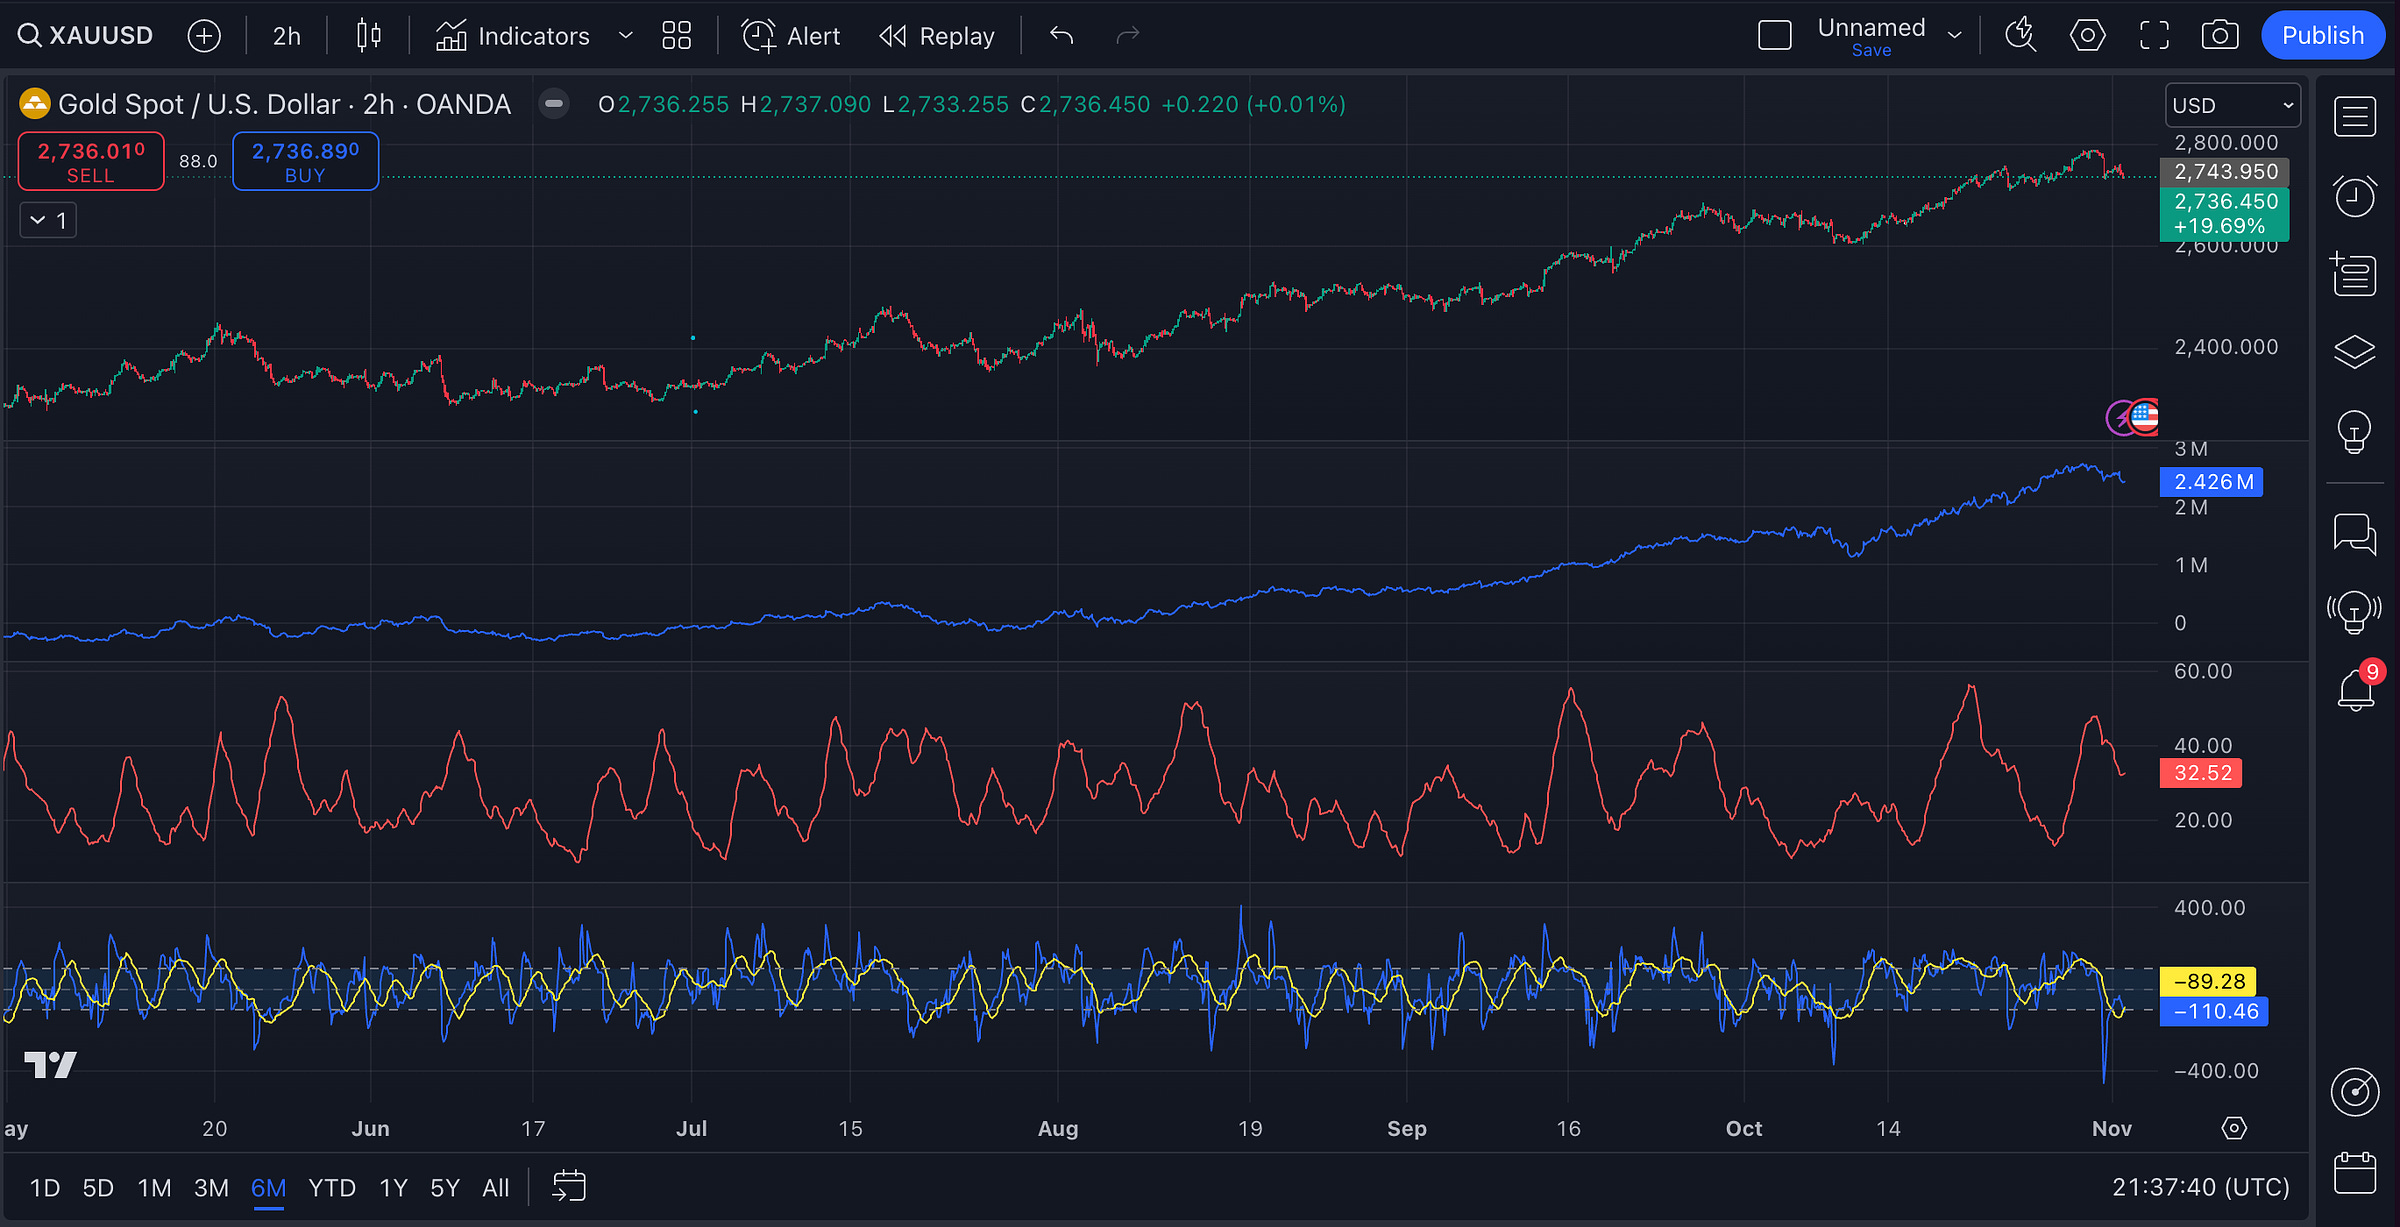
Last 6 months - 2h charts
Key takeaway:
The medium-term trend remains bullish, but short-term indicators are showing bearish/neutral signals. This might be a good time to wait and see if Gold finds support before committing to any major positions.
Short-term caution: Indicators like MACD and RSI show bearish momentum in the short term. Be cautious about entering long positions at the moment until we see confirmation of support holding, especially around the 2,740-2,750 level.
Bouncing potential: CCI in oversold territory hints that we might see a short-term bounce soon, especially if it crosses back above -100. This could create some near-term buying interest, though it’s not guaranteed to be a full reversal.
Medium-term uptrend intact: Despite short-term bearish signals, the overall structure of the chart with a strong OBV and a green Ichimoku Cloud suggests that the longer-term bullish trend is still in place. If the price stabilizes above key supports, we may see Gold continue its climb after a period of consolidation.
Key support levels: The Volume Profile shows strong support around current price levels and 2,650. The 200 EMA near 2,720 also acts as a dynamic support. If prices dip further, these could be good levels to watch for buying opportunities, as there’s likely more interest at these levels.
Last 3 months - 1h charts
Key takeaway:
The short-term sentiment is
Keep reading with a 7-day free trial
Subscribe to The Gold Trader to keep reading this post and get 7 days of free access to the full post archives.


