


Gold Hits New Highs: Here's How to Trade It Next Week [Weekly XAU/USD Analysis + Forecast]


Hello, fellow traders!
Gold hit another record high above $2,880 this week, fueled by falling U.S. Treasury yields and safe-haven demand. Fresh U.S. tariffs on Mexico, Canada, and China added to market caution, while weaker job openings and a drop in the ISM Services PMI pressured the dollar.
After a brief midweek dip, Friday’s disappointing jobs report helped XAU/USD rebound.
Next week, all eyes are on Fed Chair Powell’s testimony and the January inflation report, both key for rate expectations.
In this week’s update, I’ll:
Decode the technicals: pinpoint the hidden technical clues that could signal a sudden breakout—or a ruthless selloff.
Unpack the global data: highlight the global economic numbers making waves and where they could push Gold’s price in the mid term.
Identify strategic “make-or-break” price zones.
Spot the sentiment shifts: what’s brewing beneath the surface and why this matters for Gold’s future direction.
Predict what’s next for Gold + trading setups: give away my short-term and mid-term calls for where XAU/USD is headed and offer several trading setups in the current market.


📊 Let’s look at the technical data
1h charts
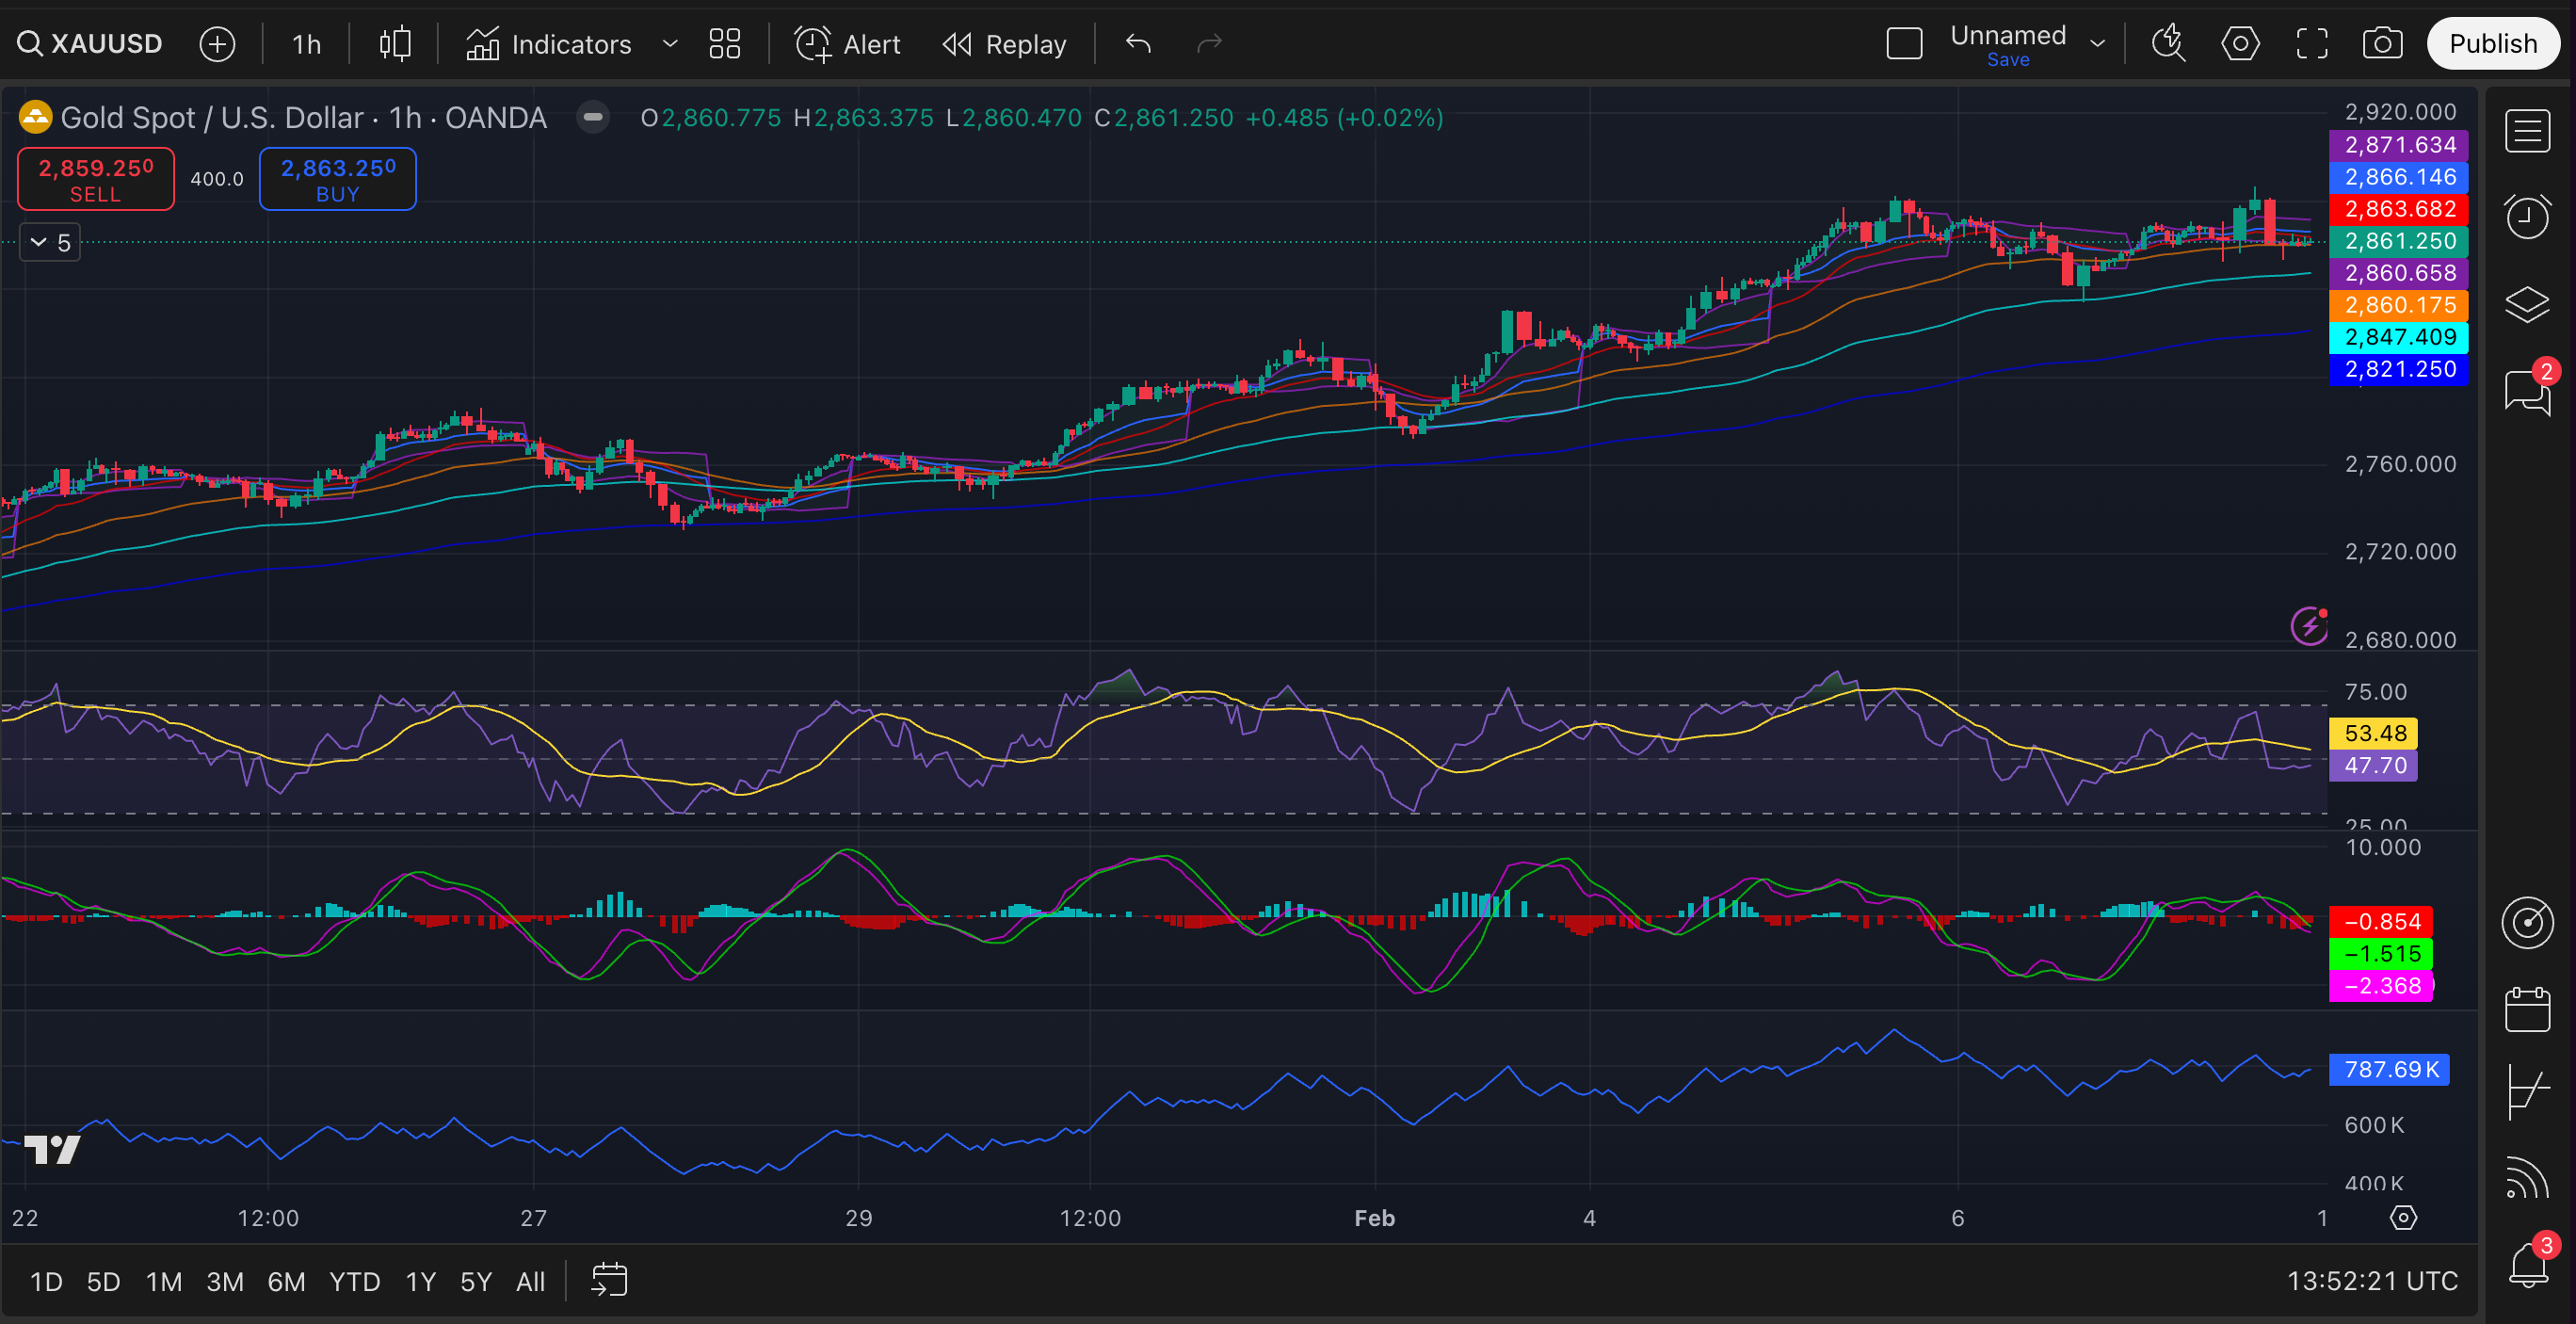

Key takeaways:
Gold still bullish mid-term: The price is currently above the 100 and 200 EMAs, and the overall structure is an uptrend.
Bearish short-term momentum building: RSI is neutral, so there’s no extreme exhaustion, but the momentum is waning. Indicators like the MACD, Chaikin, BBPower, and DeMARSI are hinting at an ongoing or potential pullback.
Liquidity is weakening → expect choppy movement and intraday whipsaws rather than strong trending action in the next few days.
Key support: To maintain short-term bullish momentum, Gold needs to stay above the 50 EMA (~$2,860). A break below might spark heavier selling.
Possible future scenarios:
Keep reading with a 7-day free trial
Subscribe to The Gold Trader to keep reading this post and get 7 days of free access to the full post archives.