


Gold Breaks Down: Is It Time to Exit Longs? [Weekly XAU/USD Analysis + Forecast + Trading Playbook]

Hello, fellow traders!
Gold took a hit this week, sliding below $3,300 and logging its biggest drop since February.
Early-week caution gave Gold a short boost, but optimism over trade deals and strong US jobs data pushed prices down hard—dropping near $3,200 by Thursday. Mixed signals from the US economy, like a slight GDP dip and sticky inflation, weren’t enough to stop the bleed.
Now, it’s all about the Fed on May 7. If they hint at cuts, Gold could bounce. But if they double down on inflation concerns, more downside is likely.

🔥 In this week’s premium market breakdown:
Interpret hidden TA signals before they hit the headlines: Pro breakdown of charts with key price action, structure, and warning signals.
Exact price zones to act on: Get clear entries, exits, and invalidation zones, so you can trade with structure.
Trade setups that deliver: High-probability scalping and swing trade ideas with clear take-profit and stop-loss levels.
Global macro gist: Spot which headlines matter for Gold, and which are just noise and understand how real-world policy is shaping the charts.
Sentiment shifts: Decode what the biggest traders in the world are doing right now and how their moves will shape next week’s volatility.
Intermarket intelligence: See how Gold is stacking up against Bitcoin, crude oil, equities, and global yields - understand correlations, breakouts, and capital rotations.

📊 Let’s look at the technical data
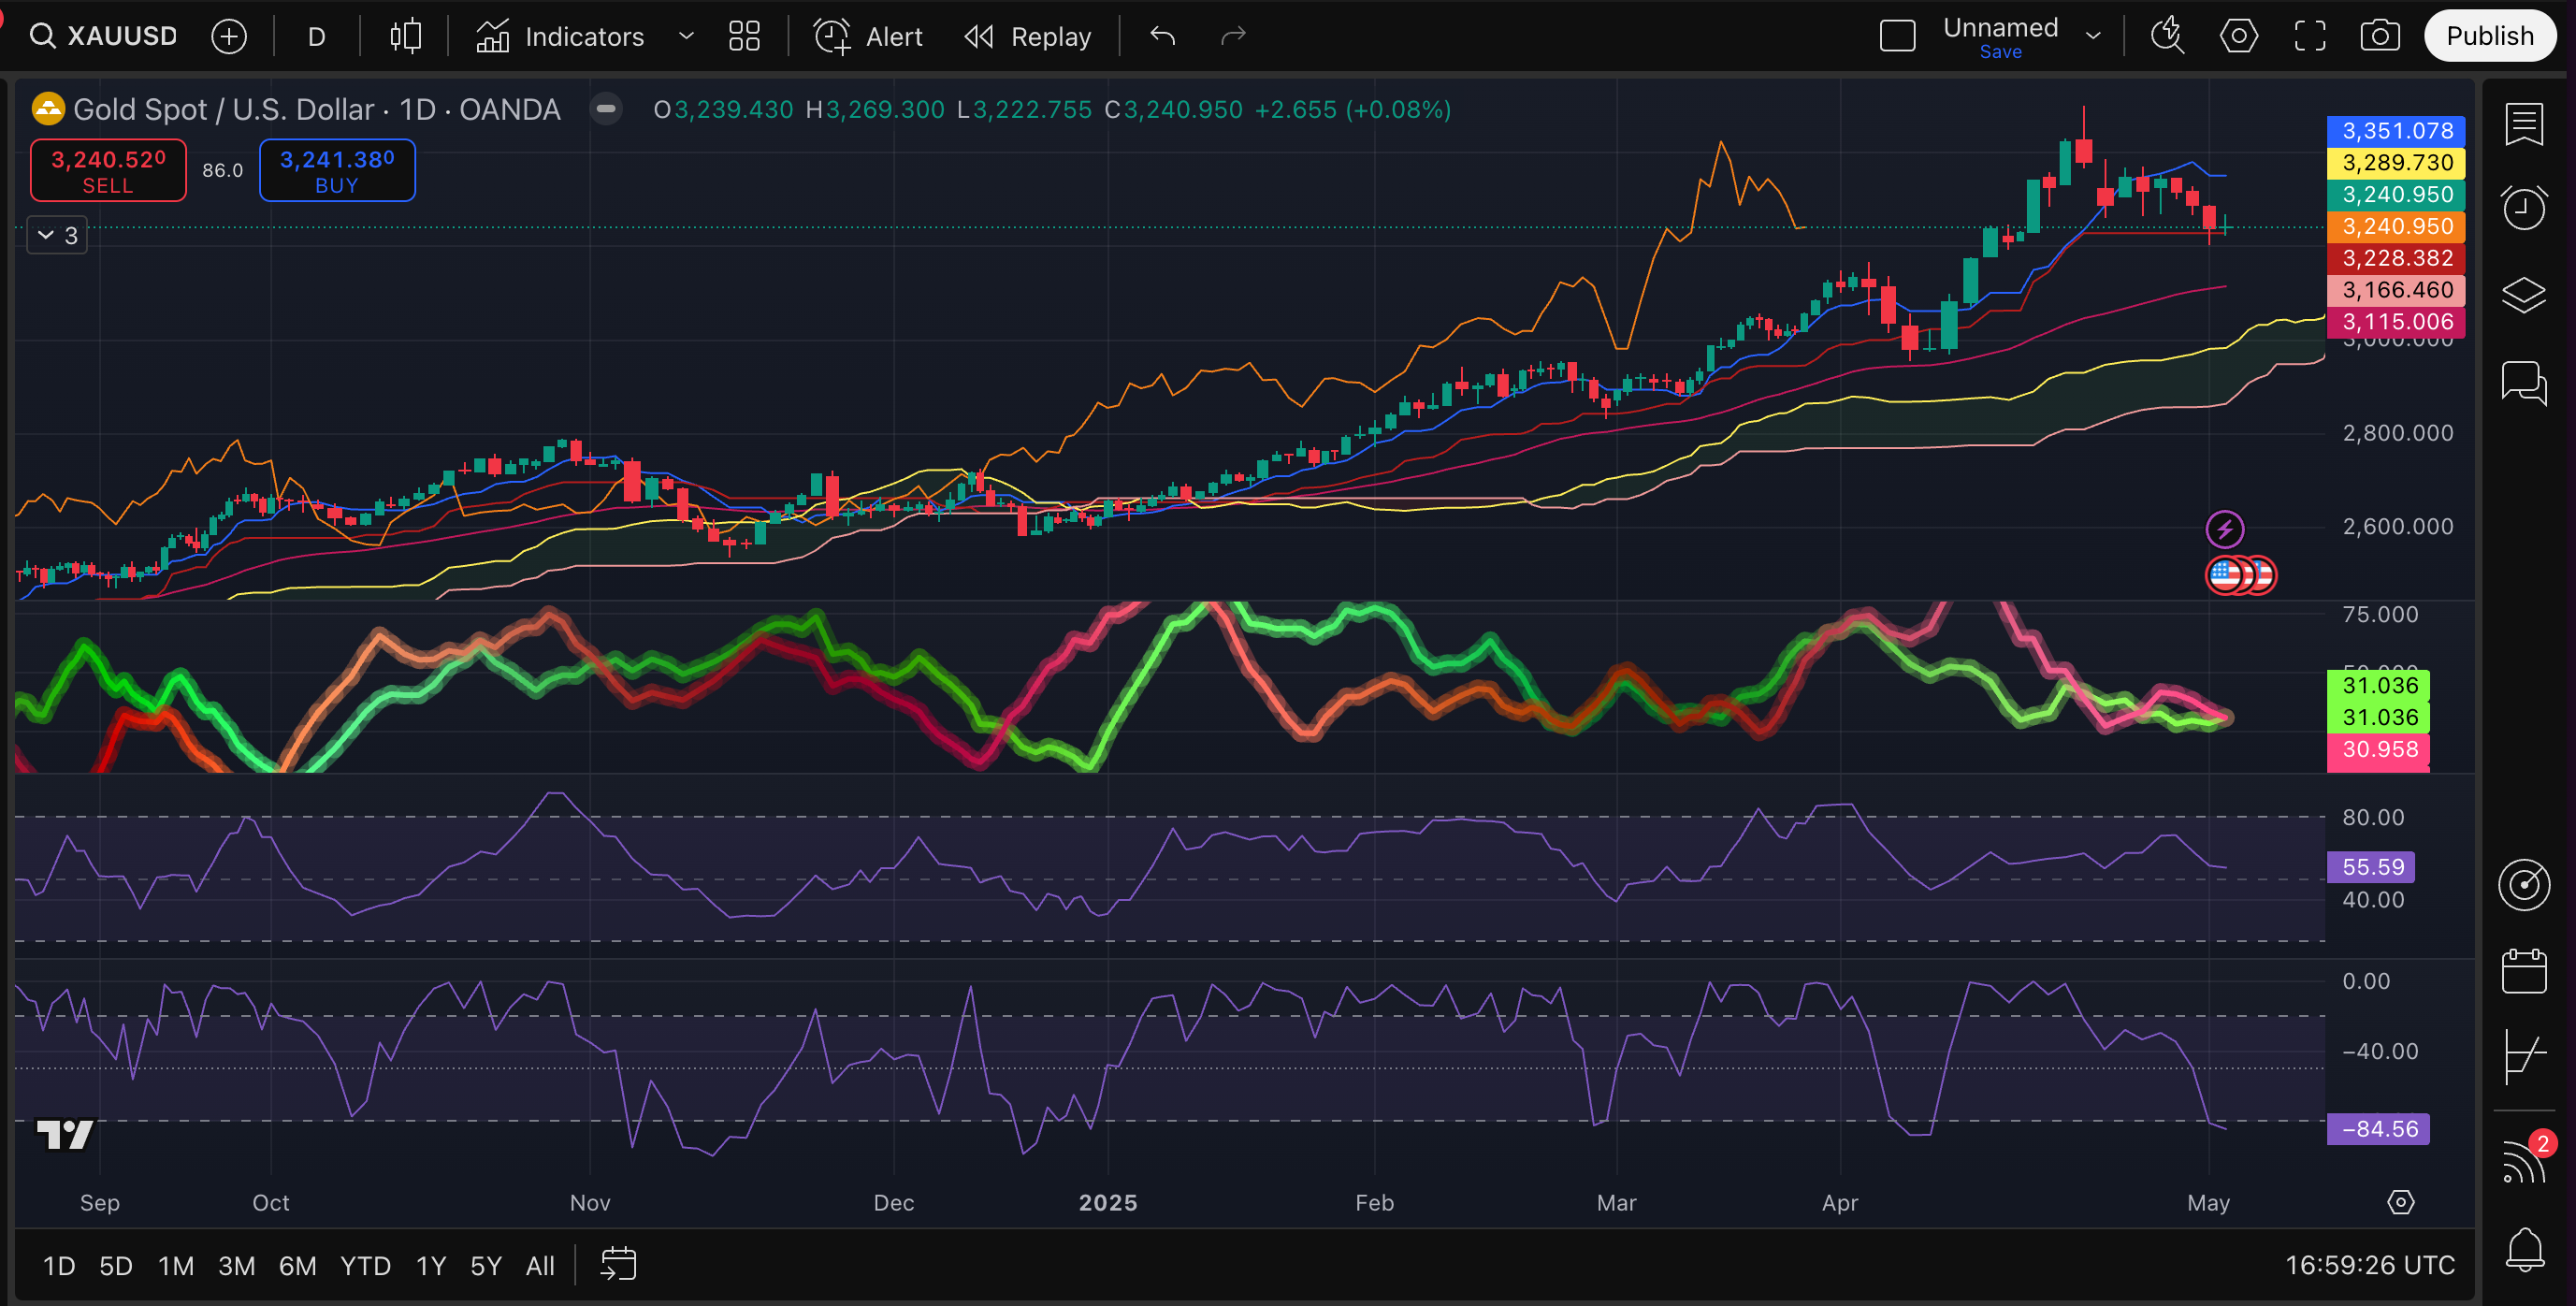


📅 Current Price: $3,240.95
Daily sentiment: 🟠 bullish but signs of correction pressure building
Medium/long-term bulls are still in control → Price above Ichimoku Cloud and EMA 50 (~$2,430).
⚠️ But Tenkan-sen and Kijun-sen flattening → upward momentum is stalling. If price starts to hover between them or dip below, expect more consolidation.
Gold Spotter:
Both lines are flattening, slightly below midline (50) → weakening momentum.
Watch for a bullish crossover if the green lines holds above the red one → would signal market stabilization; the first sign of bulls trying to defend the uptrend.
Money Flow Index dropping from overbought (now ~63) = less inflow of capital.
Williams %R oversold → We’re might be nearing a short-term bounce zone — could trigger a local rally, especially if paired with a Gold Spotter bullish cross.

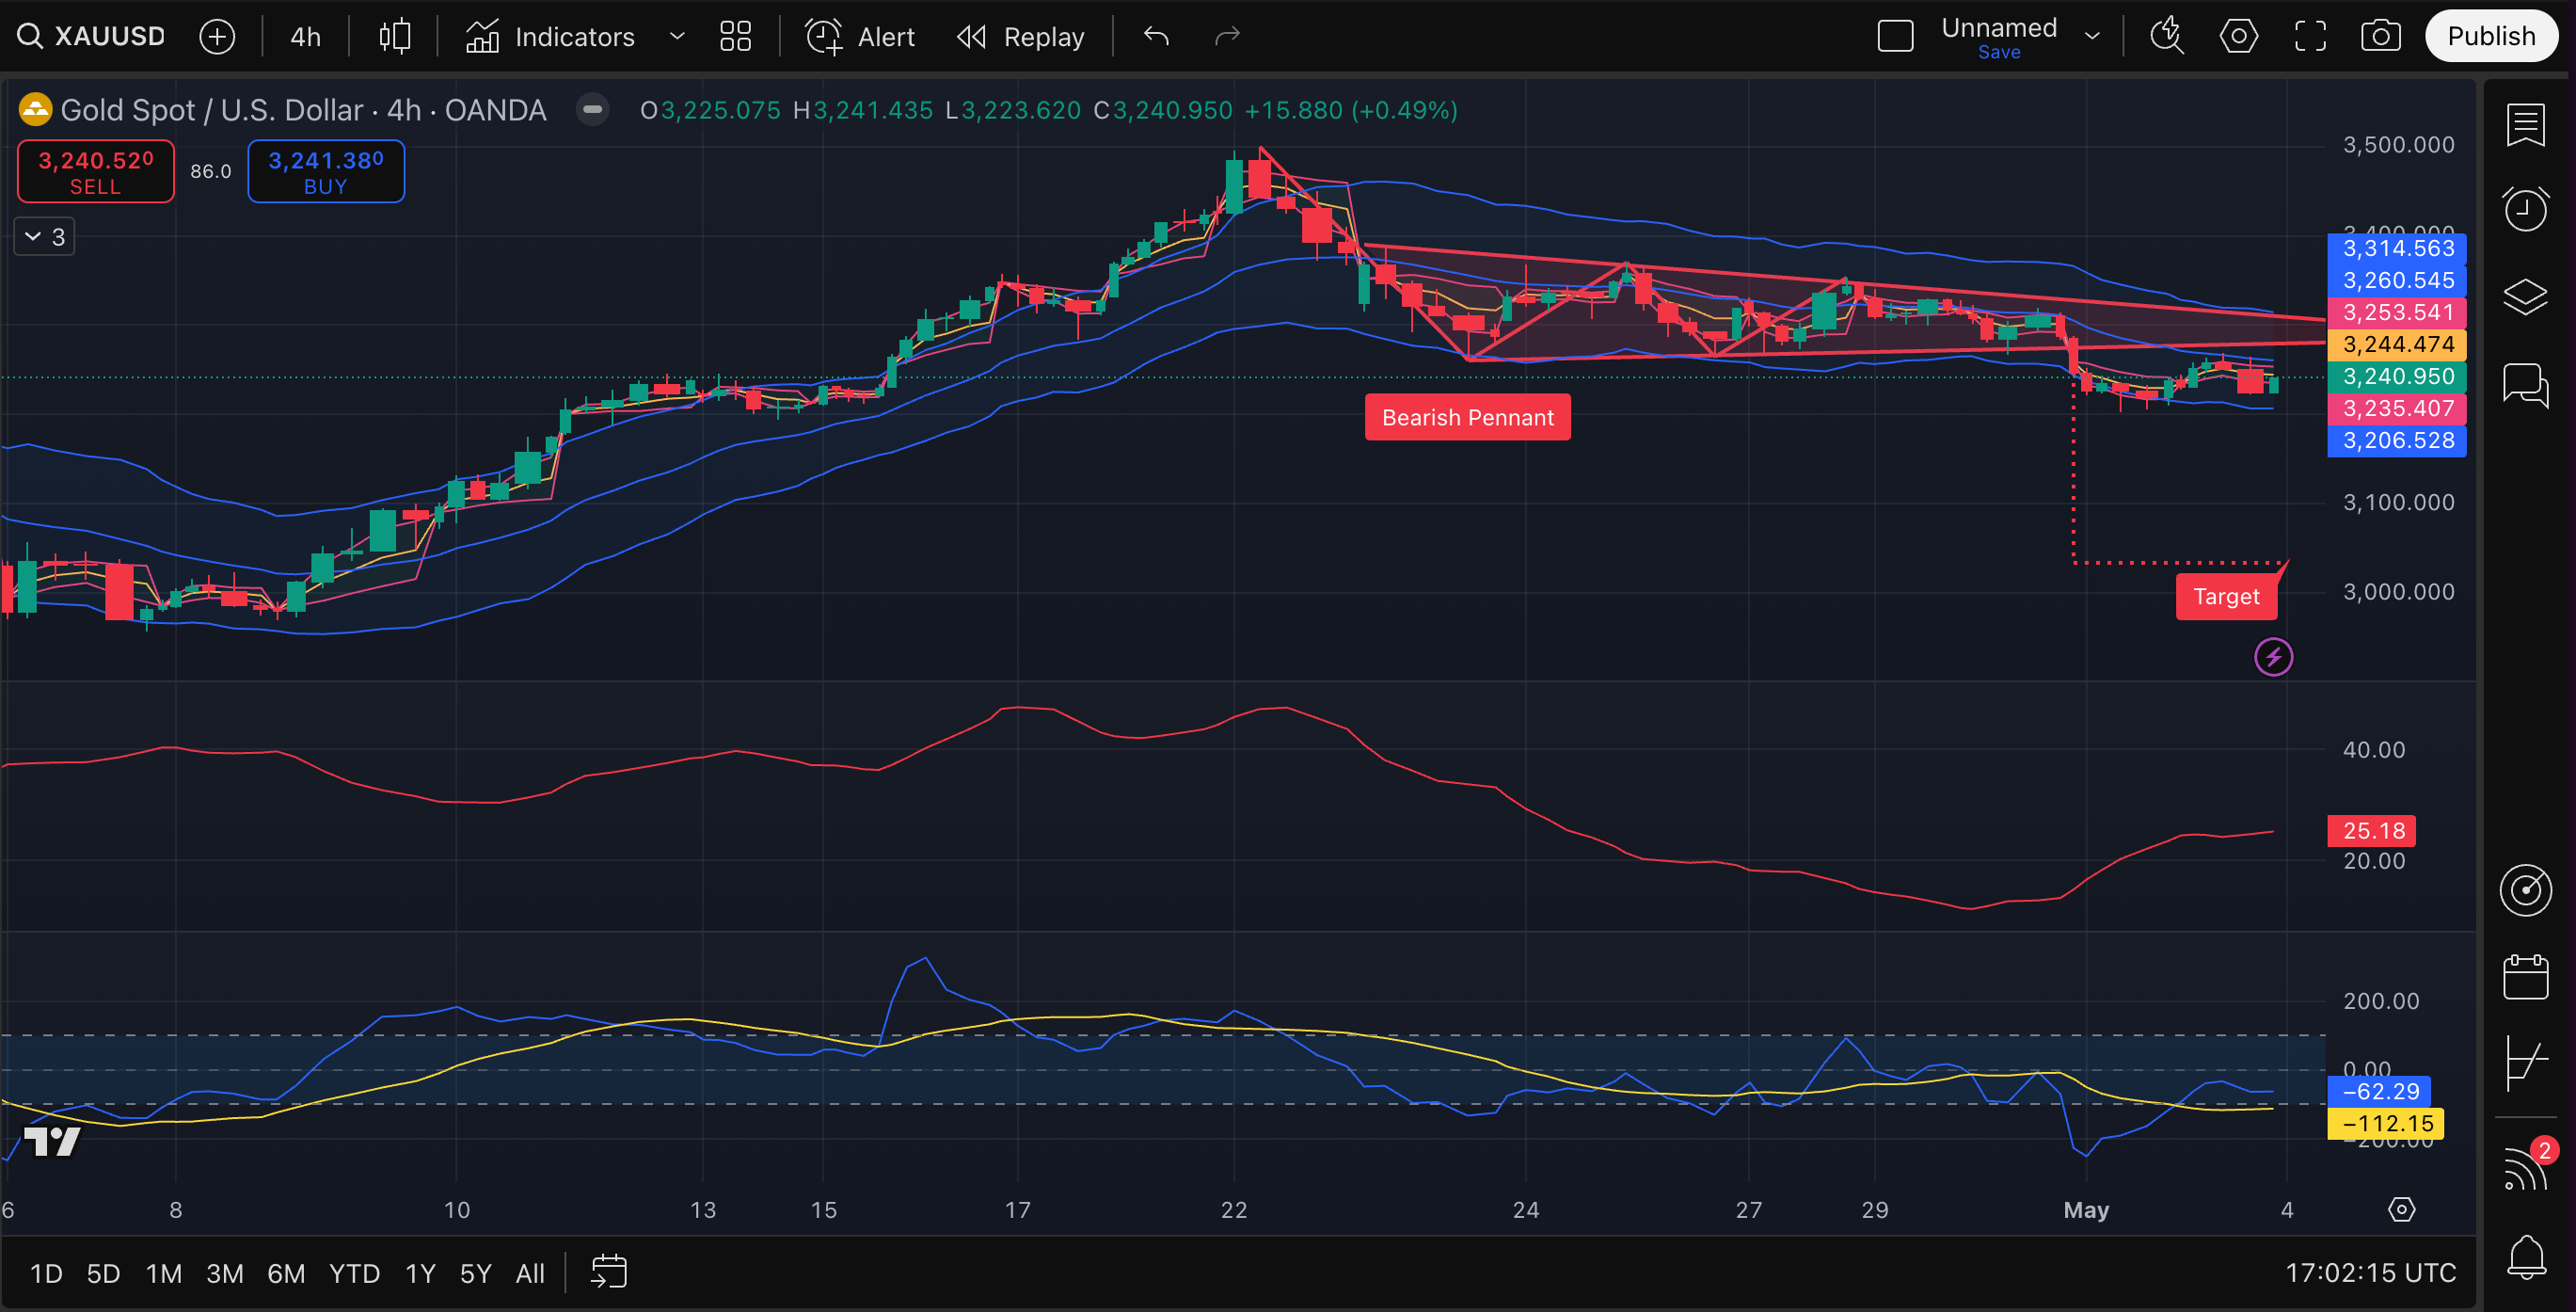
Medium-term: 🔴 Bearish
Bearish Pennant broken down → Classic continuation pattern following the recent drop. Target projection: ~$3,000
CCI deep in negative territory & Parabolic SAR above price → strong medium-term selling momentum.
Slight but steady capital outflow → sellers dominating.
Bullish invalidation level: Reclaim and hold above
Keep reading with a 7-day free trial
Subscribe to The Gold Trader to keep reading this post and get 7 days of free access to the full post archives.