


Gold Breaks All-Time High—Again: Can It Keep Climbing? Key Scenarios for Feb 17-21 [Weekly XAU/USD Analysis + Forecast]


Hello, fellow traders!
Gold hit another all-time high this week, marking its third consecutive record-breaking run. Prices surged past $2,940, driven by news of newly imposed 25% tariffs on steel and aluminum.
Midweek, Gold faced some pressure from Fed Chair Powell’s cautious stance and fresh inflation data, but it quickly rebounded. By the end of the week, it held strong, closing with gains of over 2%.
In this week’s update, I’ll:
Decode the technicals: pinpoint the hidden technical clues that could signal a sudden breakout—or a ruthless selloff.
Unpack the global data: highlight the global economic numbers making waves and where they could push Gold’s price in the mid term.
Identify strategic “make-or-break” price zones.
Spot the sentiment shifts: what’s brewing beneath the surface and why this matters for Gold’s future direction.
Predict what’s next for Gold + trading setups: give away my short-term and mid-term calls for where XAU/USD is headed and offer several trading setups in the current market.


📊 Let’s look at the technical data
1h charts - short-term bearish, long-term intact
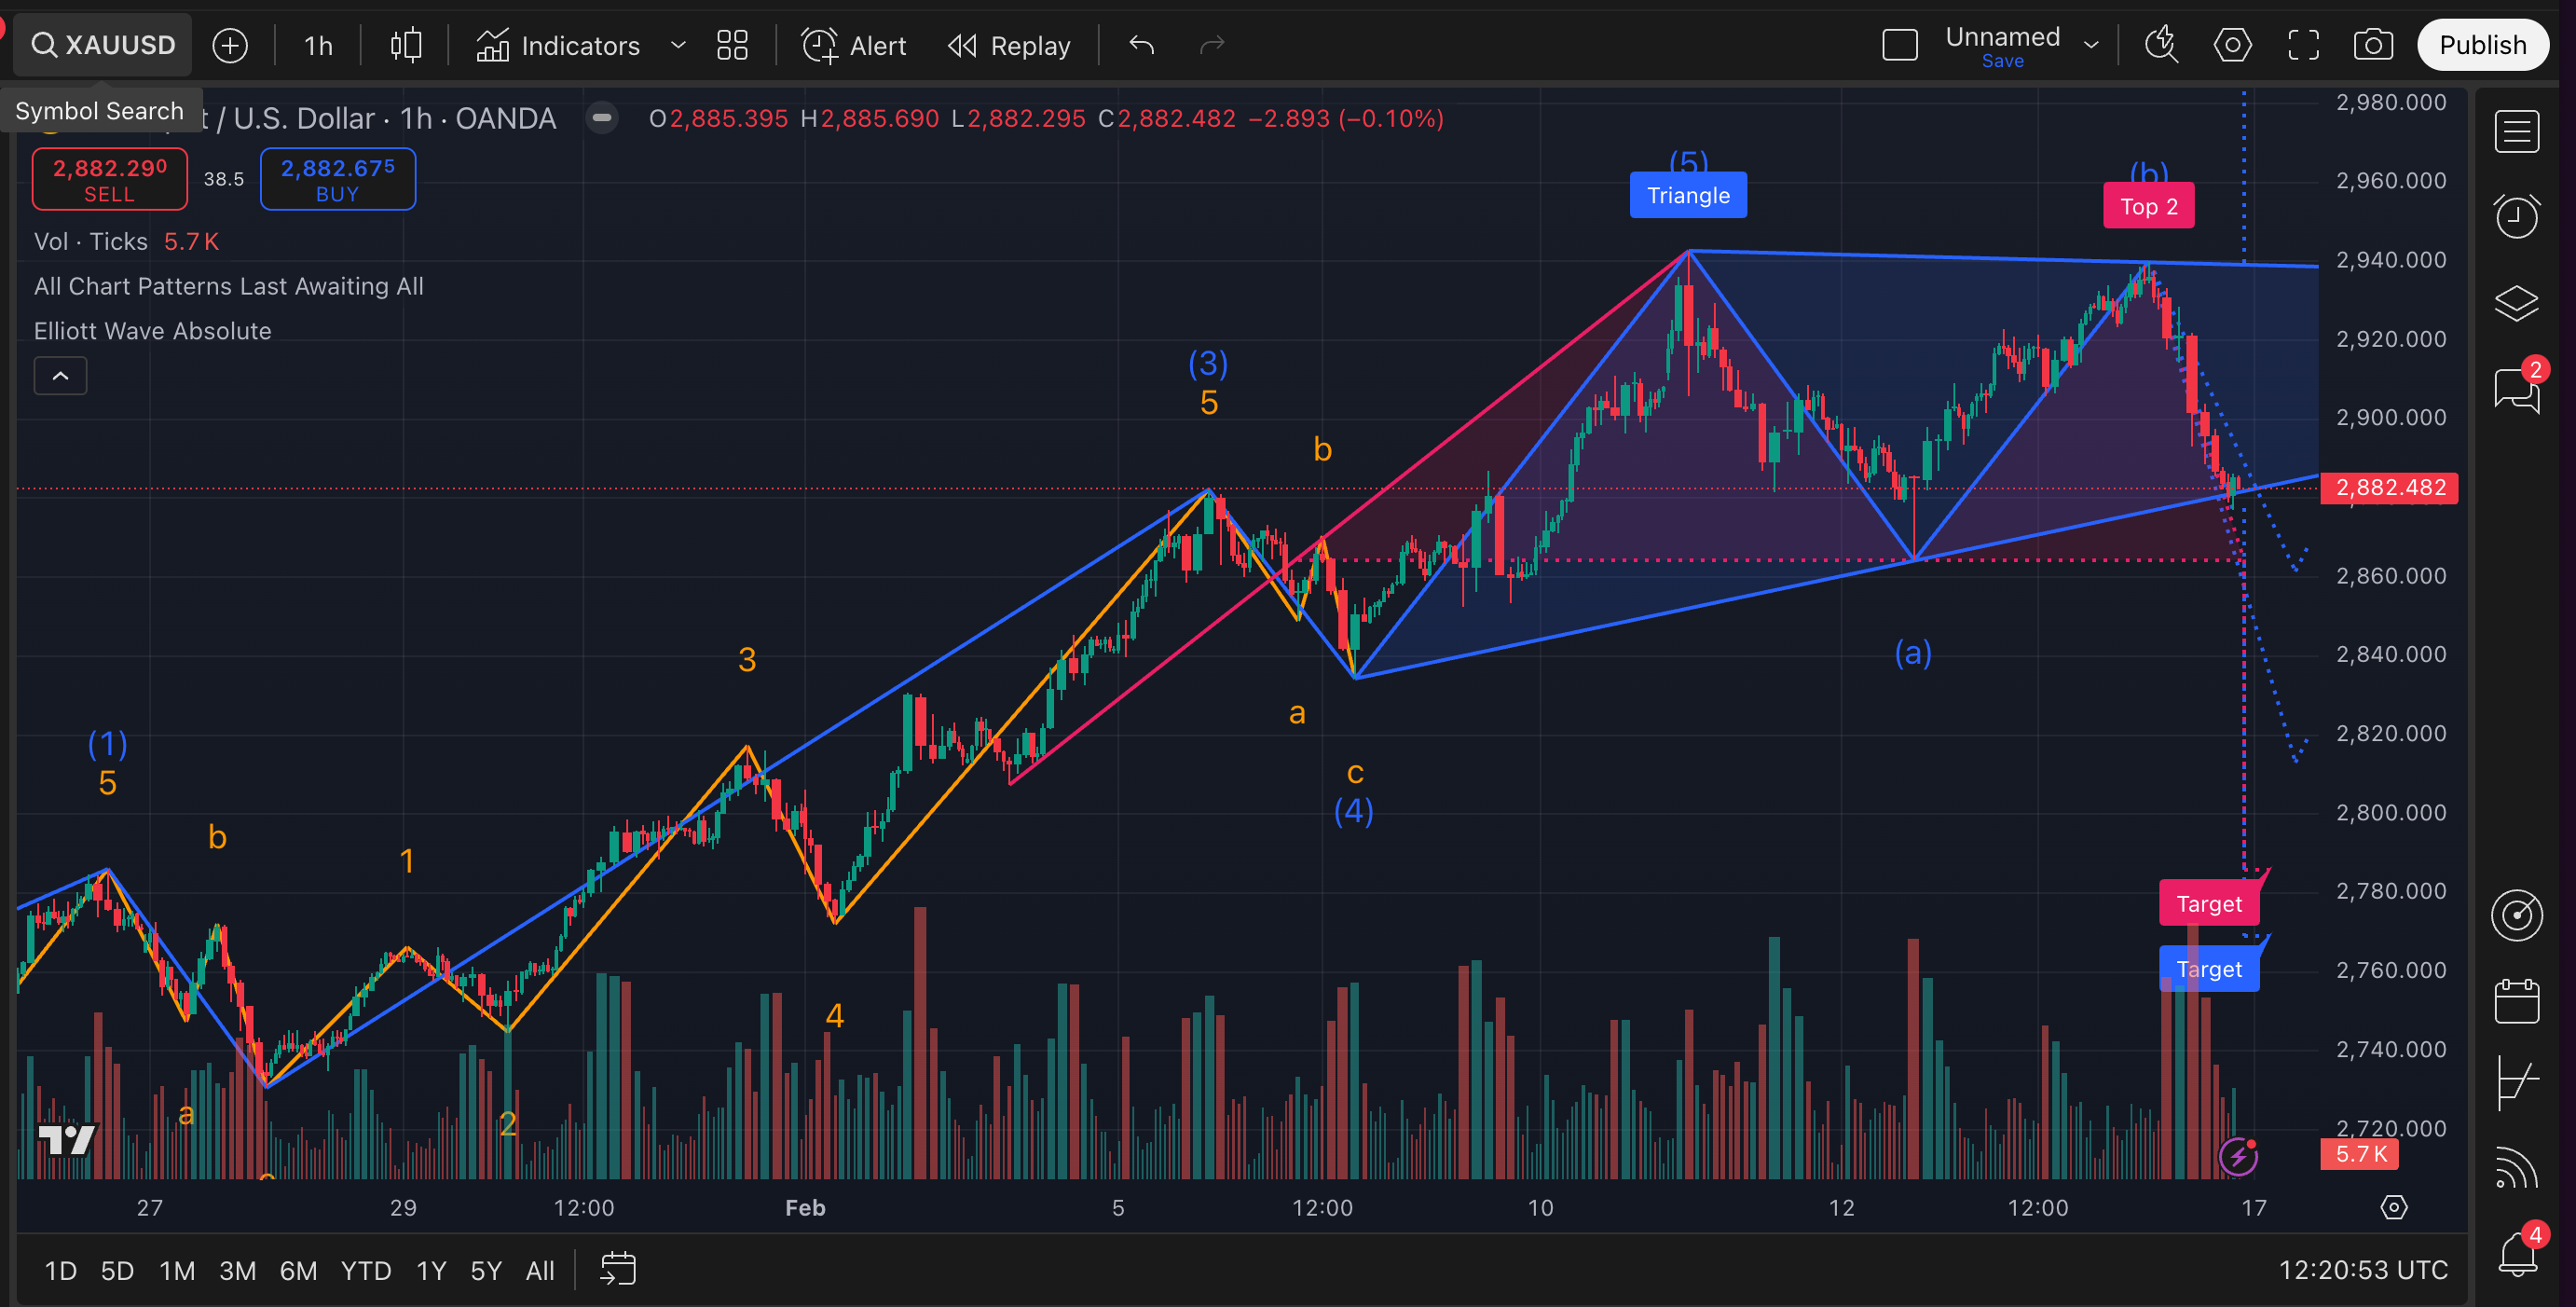
Key takeaways:
Larger uptrend still intact, but Gold is in a corrective sub-phase. If wave C stabilizes around $2,860–$2,813, the broader uptrend could resume.
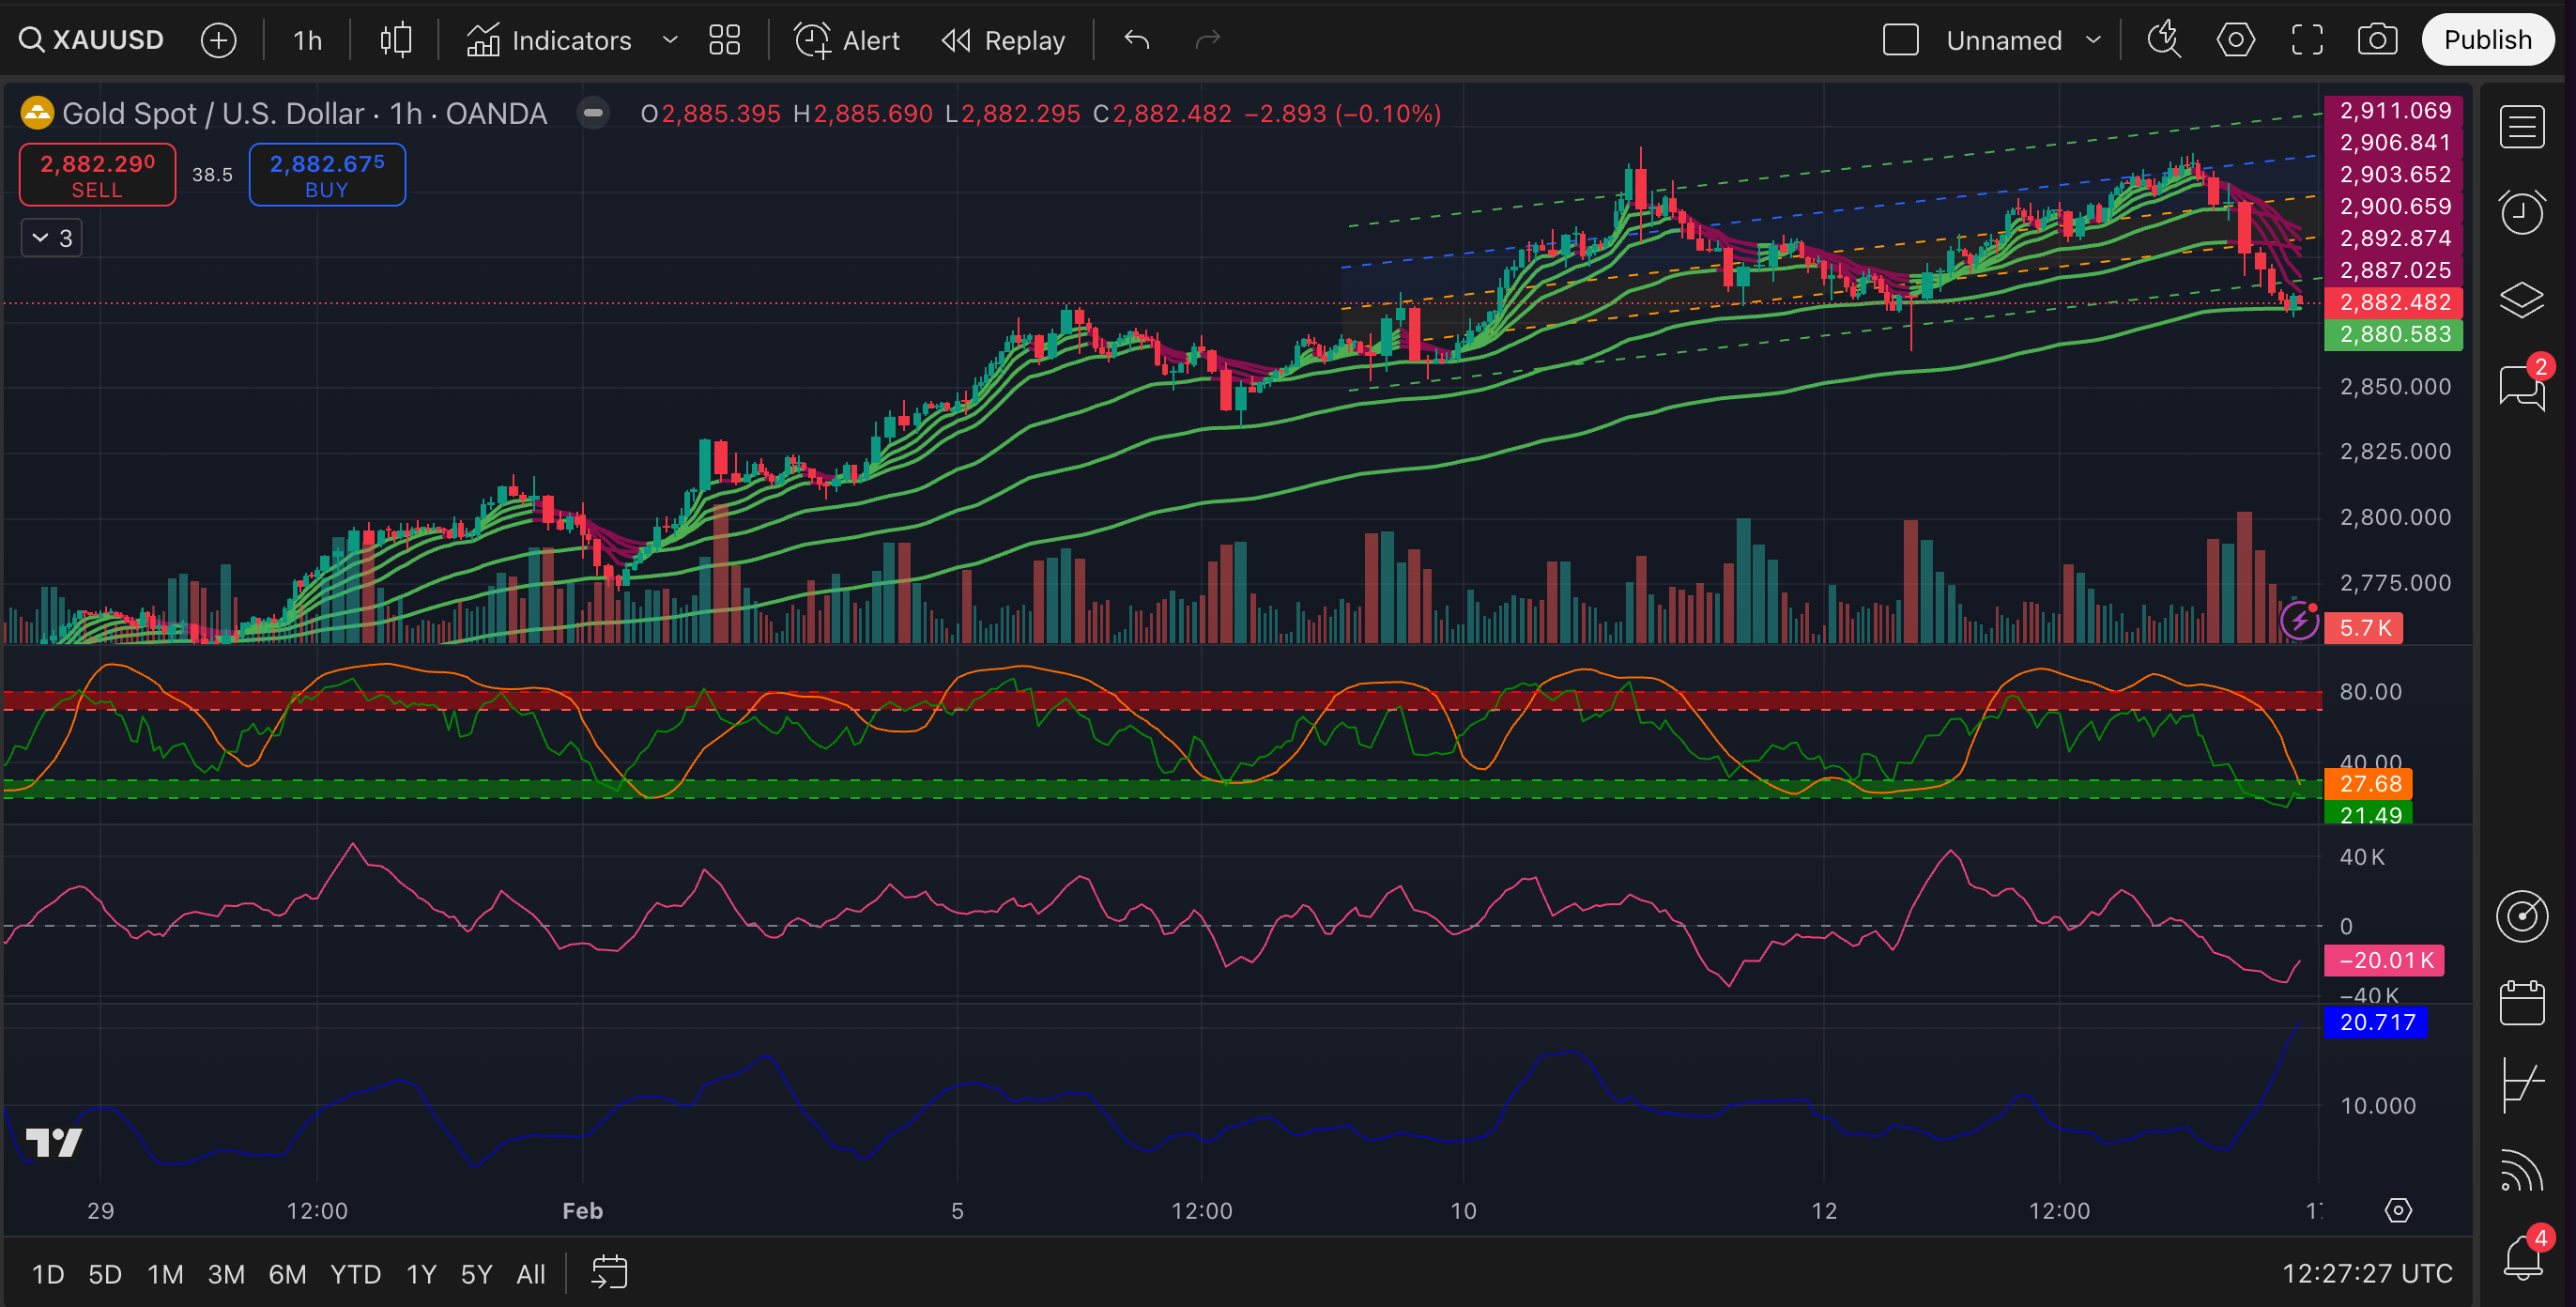
Short-term momentum bearish:
Trading below the middle Bollinger Band and key short-term MAs.
Chaikin, Chande Momentum, and RVI are trending lower, confirming downside pressure.
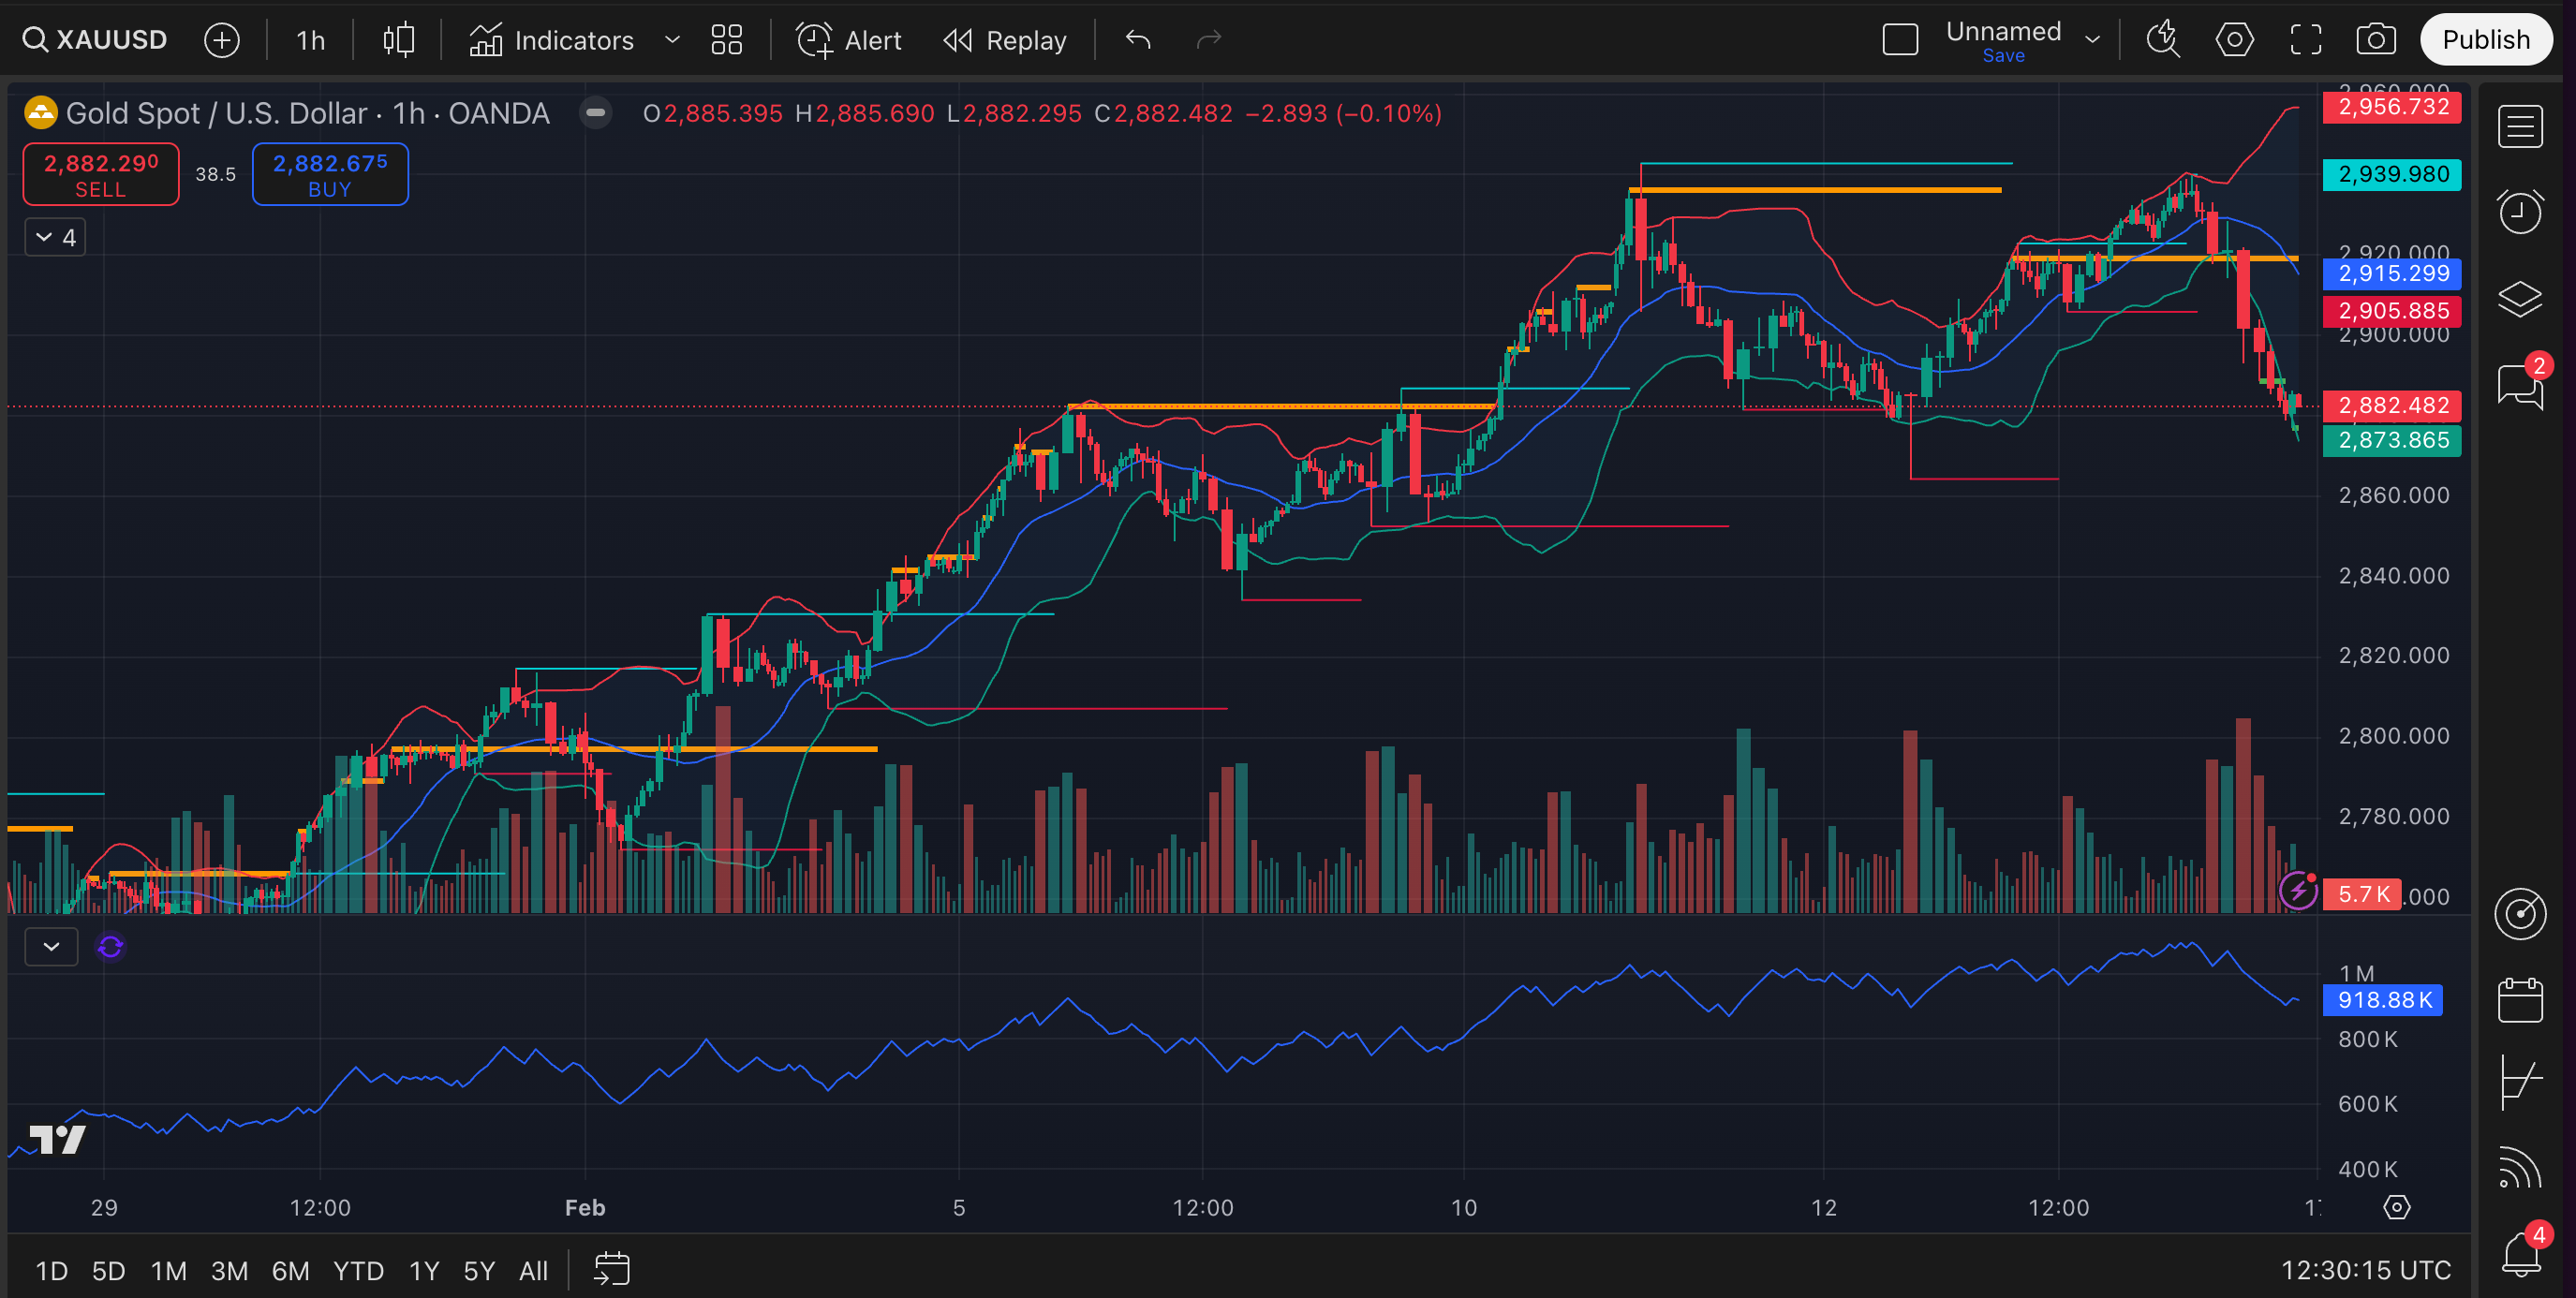
Bulls need a strong close above $2,900–$2,915 to shift momentum back up.
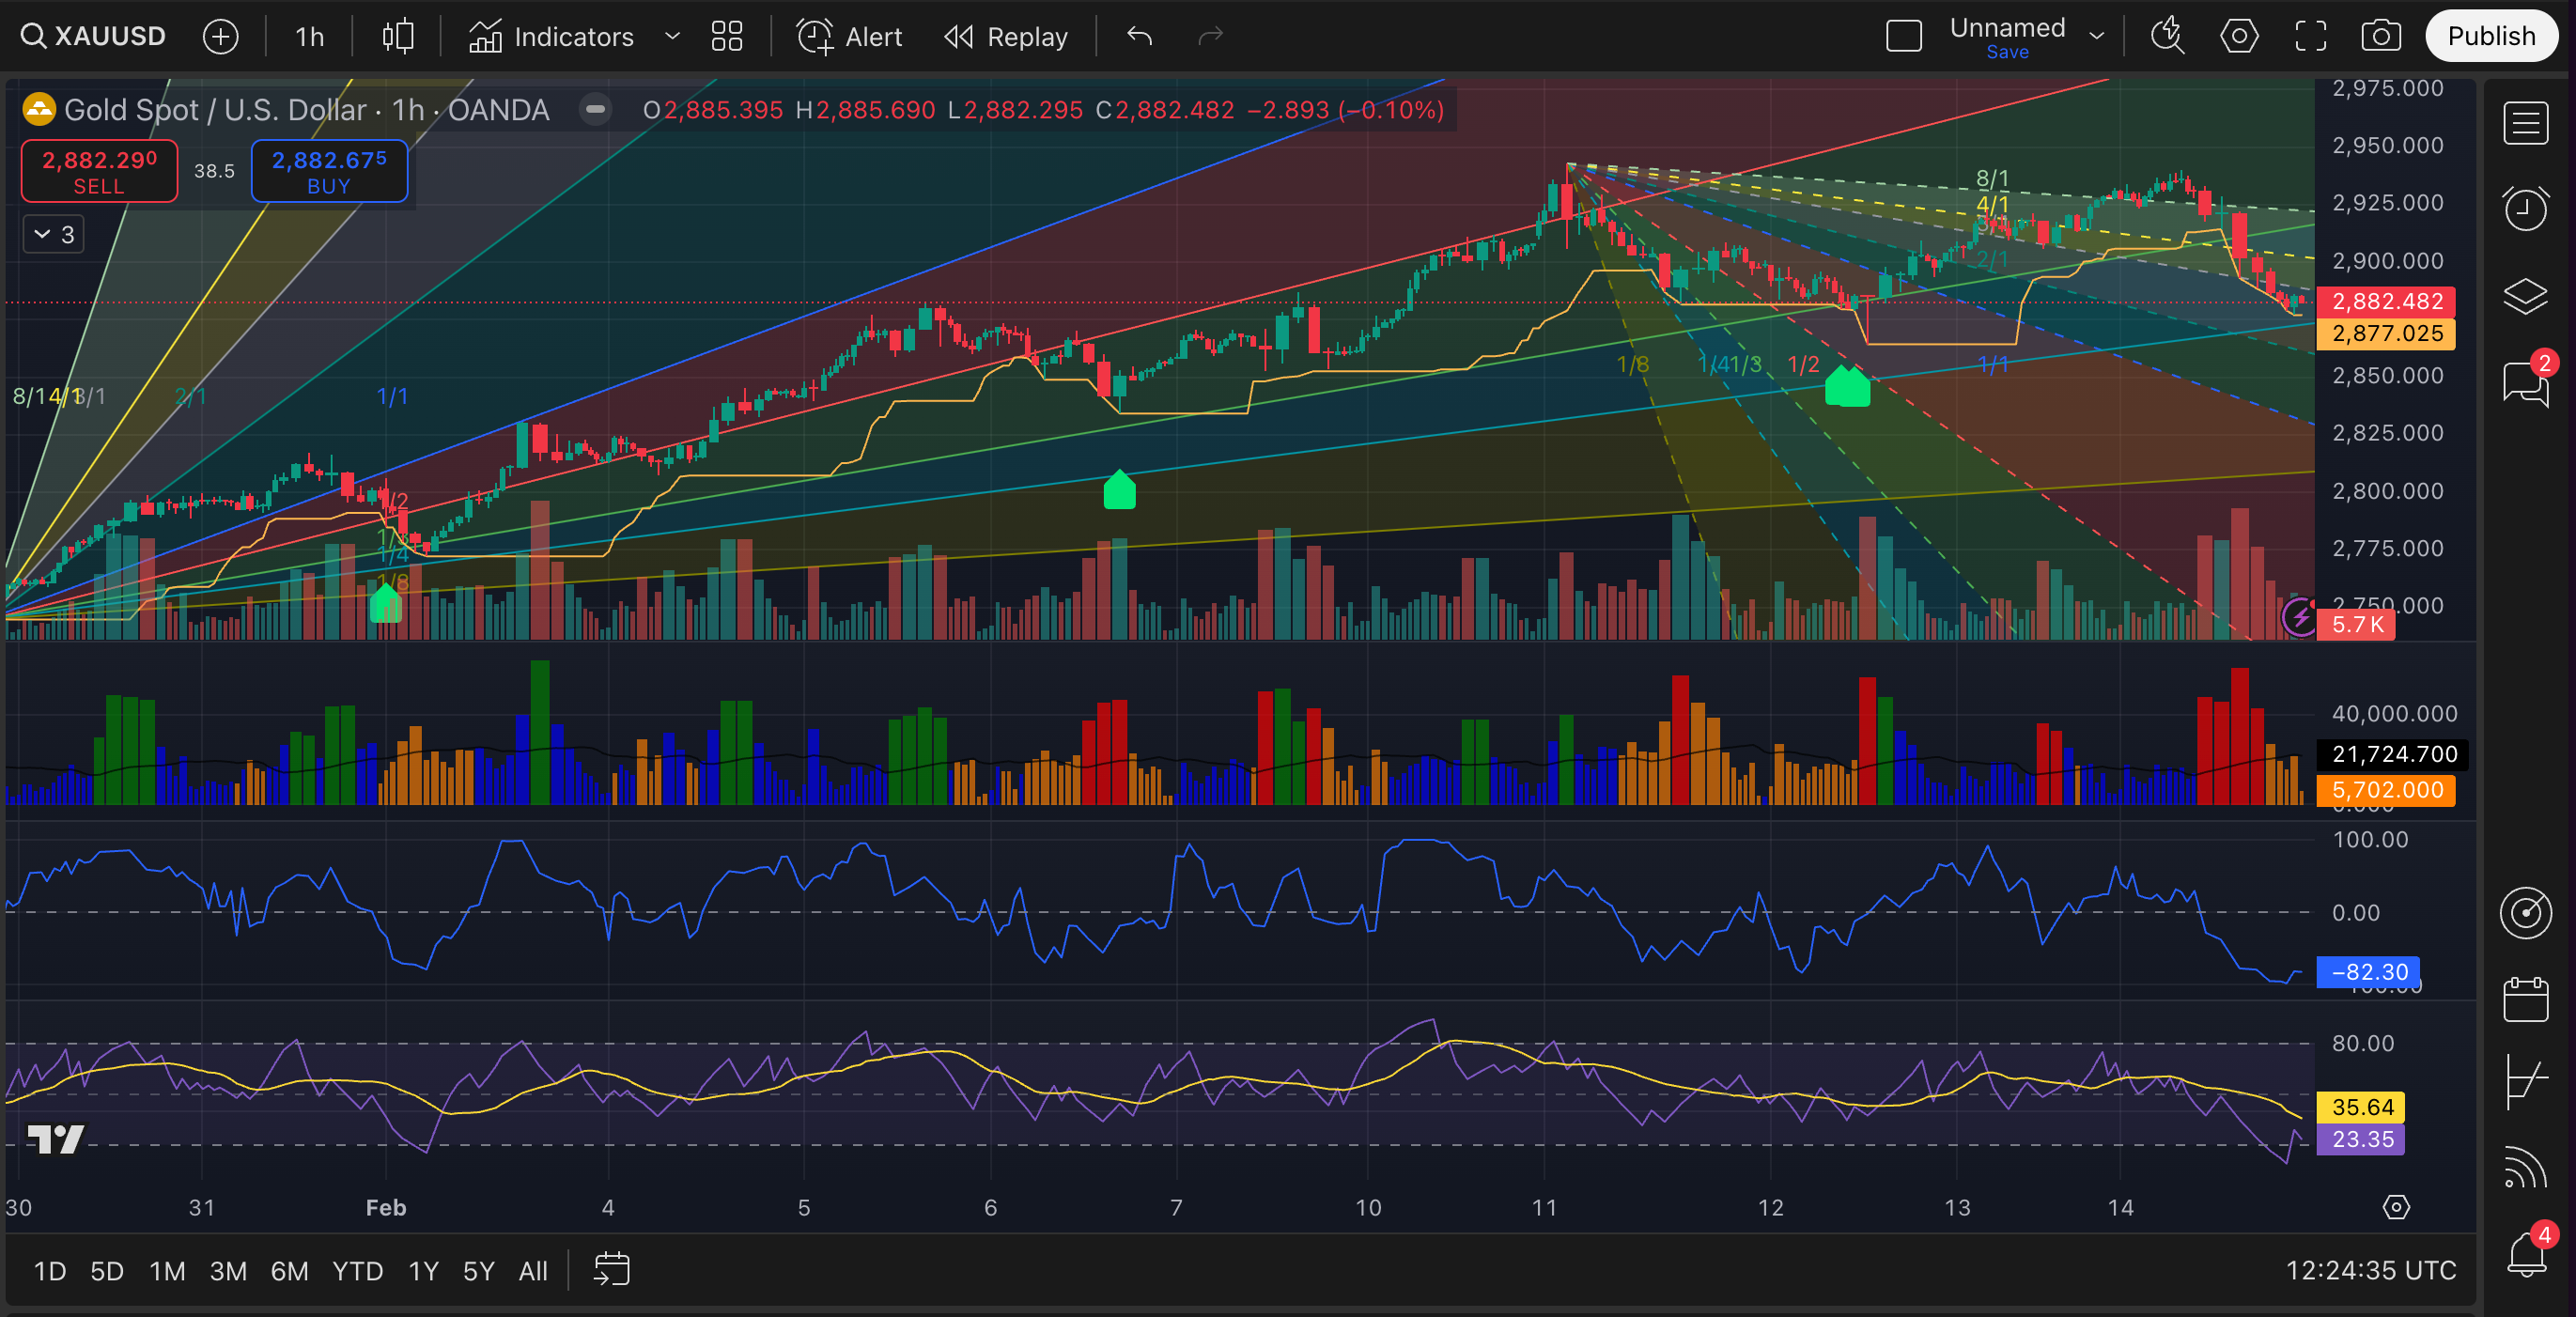
Further downside pressure likely → a descending triangle is forming.
Bounce possible → Gold is oversold as to Stochastic and RSI. If support holds, a small bounce or pause in selling could happen.
Possible scenarios:
Keep reading with a 7-day free trial
Subscribe to The Gold Trader to keep reading this post and get 7 days of free access to the full post archives.