
Forget the Rate Cut. The Only Thing I'm Trading This Wednesday is the "Dot Plot." Here is the Plan [Gold Market Movers: Sep 15 - 21]
How amateurs will lose money this week (and how we won't)

On Wednesday, the Federal Reserve is expected to cut interest rates.
Traders who are new to the game see this as a simple, one-way bet: Rate cuts equal a weaker dollar, which means Gold goes to the moon.
This is the biggest amateur trap of the entire week.
After 13 years of trading Gold for a living, I can tell you that the rate cut itself is meaningless.
The real story - the one that will dictate the trend for the next six months - is hidden in plain sight, in the Economic Projections, aka the "Dot Plot." It's where each member reveals where they truly believe rates are headed next year.
This Wednesday, we could get a "Dovish cut" with a "Hawkish dot plot." Your entire week will be defined by your ability to understand this one nuance.
We will walk through this this calendar event-by-event, and I will show you exactly where the money is, and where the traps are.
Let’s get to work.
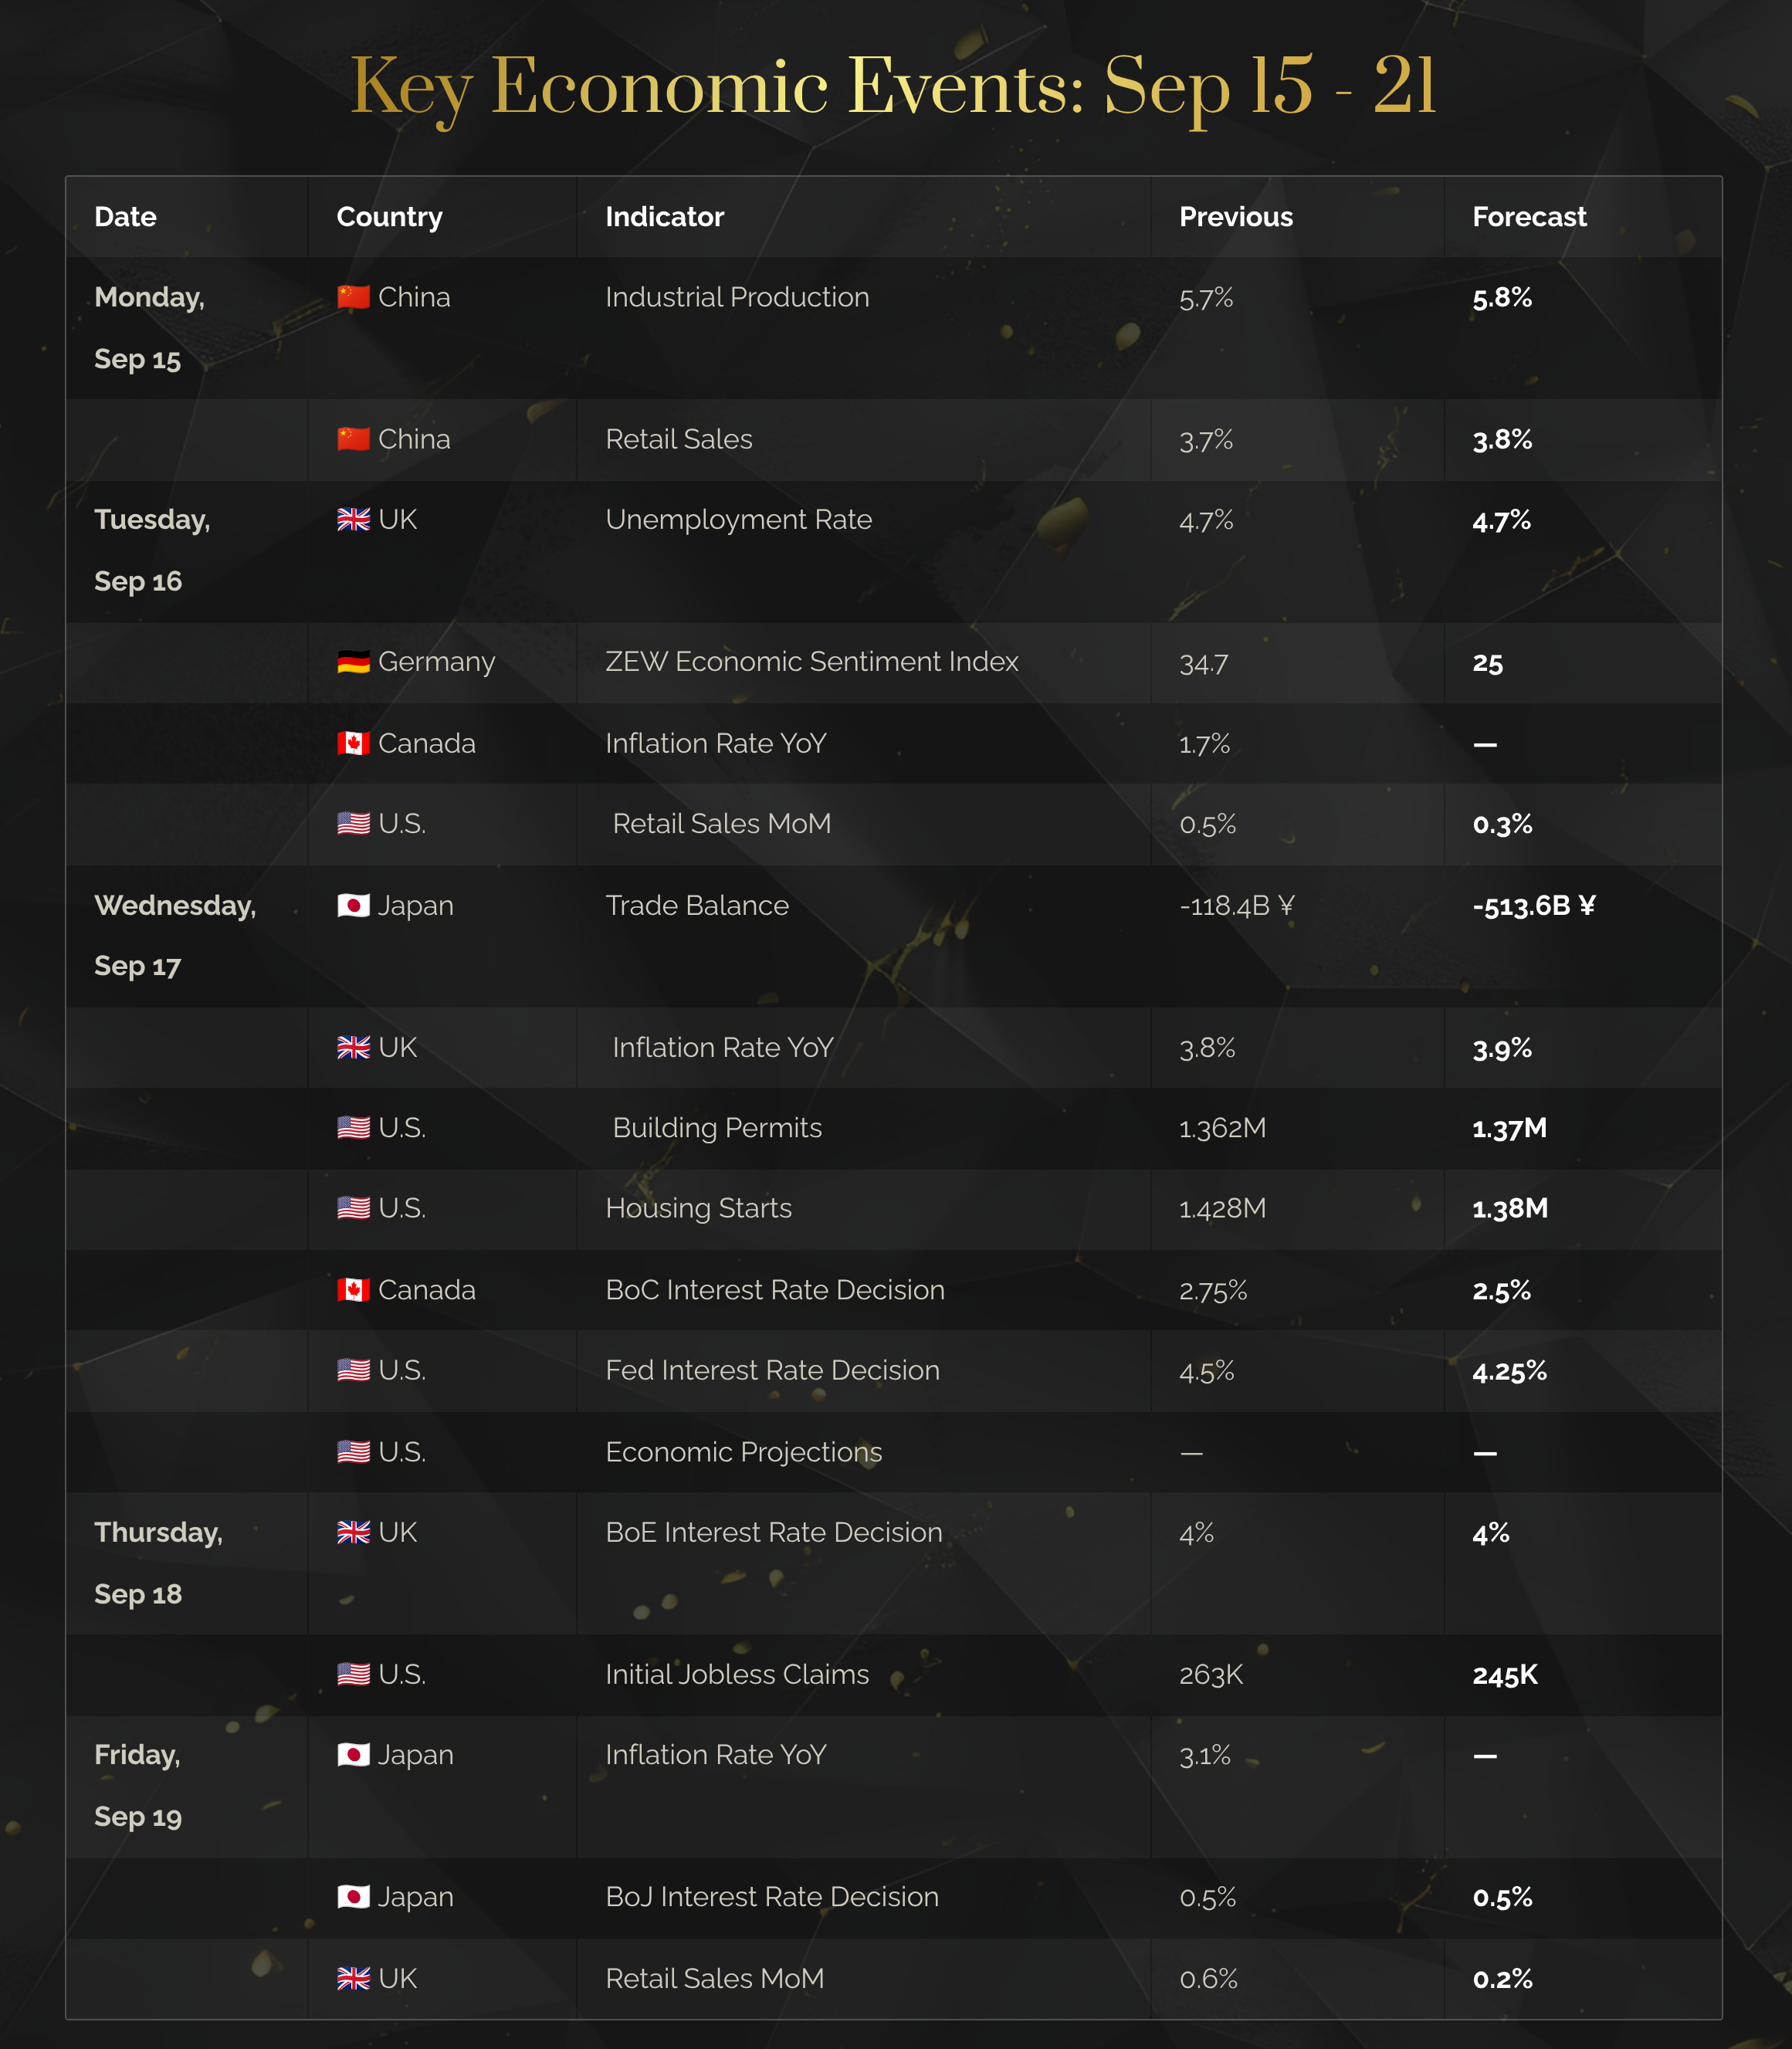

🗓️ MONDAY, SEP 15
🇨🇳 China Industrial Production + Retail Sales YoY (ALREADY RELEASED)
PRODUCTION forecast: 5.8% | Previous: 5.7% - ACTUAL 5.2%
RETAIL SALES forecast: 3.8% | Previous: 3.7% - ACTUAL 3.4%
TLDR: This is not a trade. It's the first major clue for our real target later this week (the Fed). Use this data to either confirm/reject your thesis for Wednesday.
💥 Impact:
This is the first piece of data that can confirm/reject the "global growth is fine" story.
There are two forces at play here for Gold:
The economy: If Chinese factories (Industrial Production) are slowing down, it signals a global slowdown. Fears of a global slowdown increase the pressure on the U.S. Federal Reserve to cut (but can also paradoxically hit Gold as it sparks a flight to the safety of the US Dollar).
The physical buyer: The Chinese consumer (Retail Sales) is the world's #1 buyer of physical Gold - jewelry, bars, everything. When they feel confident and are spending money, it creates a solid "floor" under the Gold price.
We need to know if these forces are working together or fighting each other.
Trading insight:
This release happens during low-liquidity hours and is notorious for volatile, messy reactions. Stay cautious.
The most potent, explosive scenario is coordinated weakness in both prints. E.g. IP below 5.4% and RS below 3.5%. This confirms global slowdown fears. It gives us the confidence to look for opportunities to buy Gold on any weakness over the next 48 hours, ahead of the Fed.
Coordinated strength (Strong IP above 6.2% + Strong RS above 4.2%): This does not mean you need to short Gold. It is a warning that global slowdown might not be materializing. Be cautious, e.g. look for a better price and a more perfect setup before putting on a long Gold trade later in the week.
Mixed data (e.g., weak IP, strong RS): This leads to unpredictable chop. Do nothing.
When the numbers hit, I am looking at these two charts for a cleaner, faster signal of how big money is interpreting the news:
Australian Dollar (AUD/USD) → If the China data is truly weak, the AUD/USD should drop (~ 25-30 pips) + show no immediate reversal. If the AUD/USD does nothing, the market doesn't care about the data, and neither should we.
U.S. Dollar Index (DXY) → the reaction tells us what the market is afraid of. Is it immediate global panic, or is it the future actions of the Fed?
If DXY ↑ → If the China news is bad enough to spark fears of a global recession, money will flee everything and run to the safety of the U.S. Dollar. This would be a temporary headwind for Gold. If you see AUD/USD falling and DXY rising, it means immediate fear
If DXY ↓ → the market isn't panicking about today. It's looking ahead, seeing cuts, and selling the Dollar in anticipation of future Fed action.
🗓️ TUESDAY, SEP 16
🇬🇧 UK Unemployment Rate
Forecast: 4.7% | 📰 Previous: 4.7%
TLDR: Do not trade this directly. Watch for surprise print and DXY reaction.
💥 Impact:
Let’s be crystal clear: for Gold’s main trend, this number is irrelevant.
But we should watch it for one reason - chain reaction between GDP and DXY: Bad UK Data → Weaker GBP/USD → Stronger DXY and vice versa.
Trading insight:
The question that matters for us is: How strong is that DXY rally/weakness and is it genuine?
The answer tells us whether the market is in a genuine panic (fleeing to the safety of the USD) or just shrugging off localized UK weakness.
Have two charts open: GBP/USD and the DXY:
≥4.9% → signals the BoE has cover to get dovish → Risk-off sentiment rises. Watch how the currencies react.
GBP/USD ↓ + DXY flat → market is ignoring the dollar's apparent strength → a good signal that Gold will get support before the Fed.
GBP/USD ↓ + DXY ↑ → Stand aside.
≤4.5% → would force the BoE to talk tough on inflation. It reinforces the story about resilient economy, which can pull money into equities and away from Gold.
GBP/USD ↑ + DXY ↓ but finds support → committed buyers are waiting to step in and support the Dollar. Be skeptical of Gold’s strength.
GBP/USD ↑ + DXY ↓ hard → bullish support for Gold.

🇩🇪 Germany ZEW Economic Sentiment Index
Forecast: 25 | Previous: 34.7
TLDR: A bad number is already priced in. Watch for extremes.
💥 Impact:
The ZEW is a sentiment survey of financial analysts in Germany. It’s an opinion poll, not hard data.
However, it has one specific function for us: it's the most likely data point this week to cause a move in the Euro. The Euro makes up ~58% of the U.S. Dollar Index (DXY). So, a strong Euro forces the DXY down, and a weak Euro forces it up.
Trading insight:
The forecast is 25, a significant drop from the previous 34.7. The market is already pessimistic.
A surprisingly resilient number (e.g., 40+) would shock the market and spark a EUR/USD rally, which would put direct pressure downward on the DXY.
You have to ask: “Is this a genuine sell off?“ We check one thing: the US 10-Year Treasury Yield.
Yields ↑ - money is flowing into stocks and away from Gold. Do not chase Gold’s upside.
Yields ↓ or flat - Gold’s rally has support.
A shockingly bad print (e.g. below 15) signals deep pessimism. . The Euro will get sold off hard. The DXY will spike. Gold will drop. This news adds to the “global slowdown“ story.
I'll be watching the DXY's daily chart.
Dollar will spike initially, but does it have the strength to break and hold above the previous day's high? If the dollar reverses from its highs, it’s a clear signal this rally was a sham.
You have a choice this week
You can try to piece together the rest of the puzzle yourself...
...or you can get the the complete intelligence briefing, including:
🇺🇸 U.S. Retail Sales - know before the print which underlying number actually matters, and what it means for the Fed's next move.
🇺🇸 Fed Wednesday plan - a precise, step-by-step plan that covers the release, the dot plot, and Powell's speech.
🇬🇧 UK Retail Sales - how to use this print to manage your existing Gold positions for maximum profit and minimum stress heading into the weekend.
When you subscribe, you also get access to my entire professional toolkit:
Real-time trade setup alerts: Delivered straight to your Telegram - with exact entries, exits, and stop-loss levels.
The Gold trend-shift indicator: My proprietary warning system for TradingView that helps you see major trend shifts before the crowd.
My weekly roadmap and exact battle plan - get unmatched clarity on what’s ahead.
You don’t need more news. You need a plan.

Keep reading with a 7-day free trial
Subscribe to The Gold Trader to keep reading this post and get 7 days of free access to the full post archives.